Edit chart
Loading graph
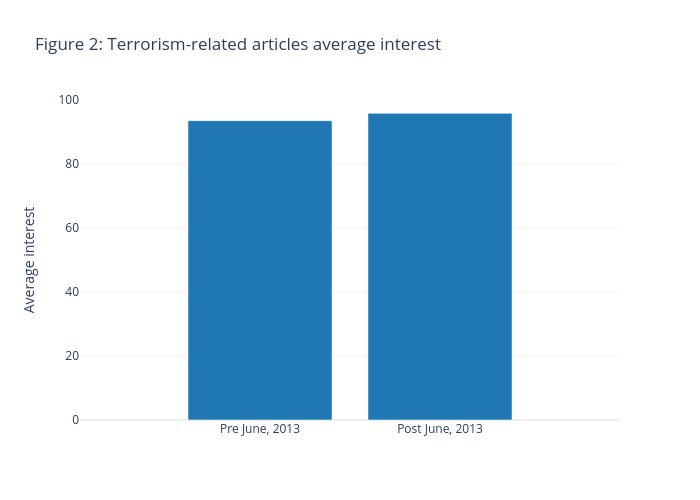
Arturjesslen's interactive graph and data of "Figure 2: Terrorism-related articles average interest" is a bar chart, showing Average interest; with Average interest in the y-axis. The x-axis shows values from -1 to 2. The y-axis shows values from 0 to 100.