Edit chart
Loading graph
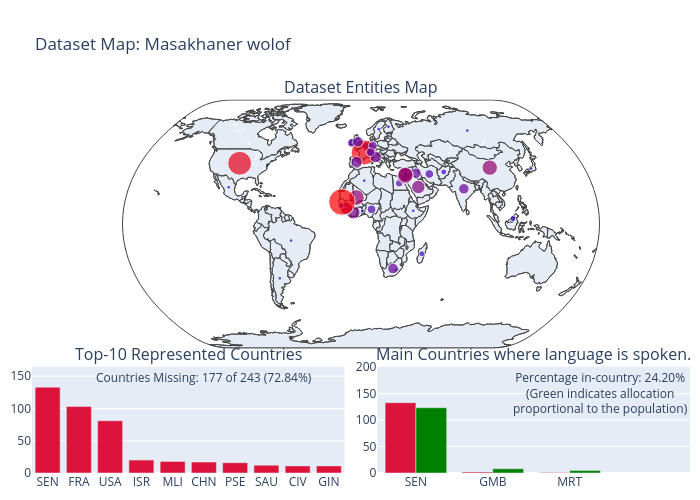
Antonis.anastasopoulos's interactive graph and data of "Dataset Map: Masakhaner wolof" is a scattergeo. The x-axis shows values from 0 to 0. The y-axis shows values from 0 to 0. This visualization has the following annotations: Dataset Entities Map; Top-10 Represented Countries; Main Countries where language is spoken.; Countries Missing: 177 of 243 (72.84%); Percentage in-country: 24.20%(Green indicates allocationproportional to the population)