Edit chart
Loading graph
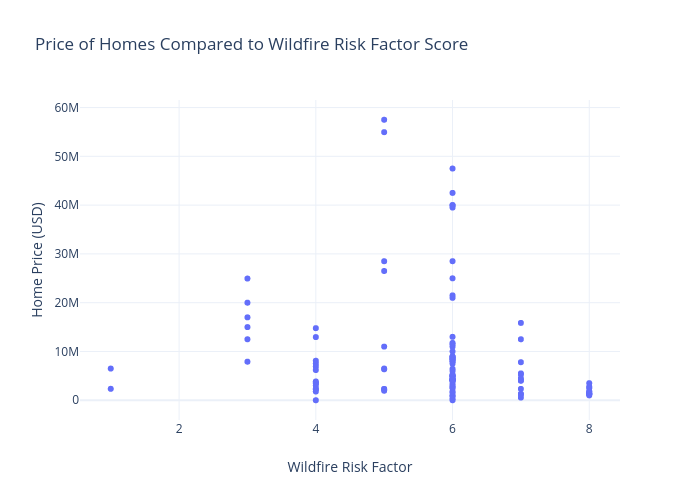
Angelina_dlt's interactive graph and data of "Price of Homes Compared to Wildfire Risk Factor Score" is a scatter chart; with Wildfire Risk Factor in the x-axis and Home Price (USD) in the y-axis.. The x-axis shows values from 0.5738897396630933 to 8.426110260336907. The y-axis shows values from -3893751.738423235 to 61393753.52742323.