Edit chart
Loading graph
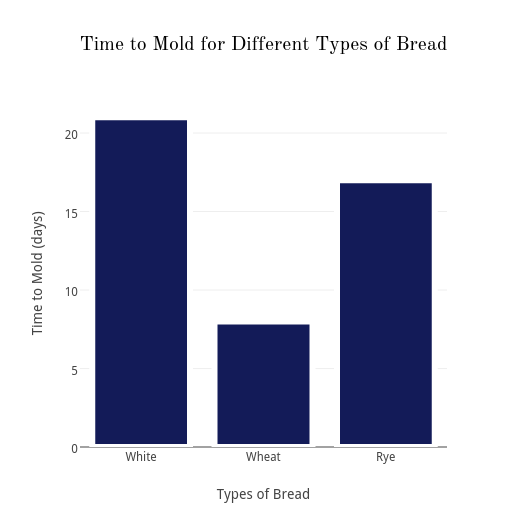
Amiraboucher's interactive graph and data of "Time to Mold for Different Types of Bread" is a bar chart, showing Col2; with Types of Bread in the x-axis and Time to Mold (days) in the y-axis.. The x-axis shows values from -0.5 to 2.5. The y-axis shows values from 0 to 22.105263157894736.