Edit chart
Loading graph
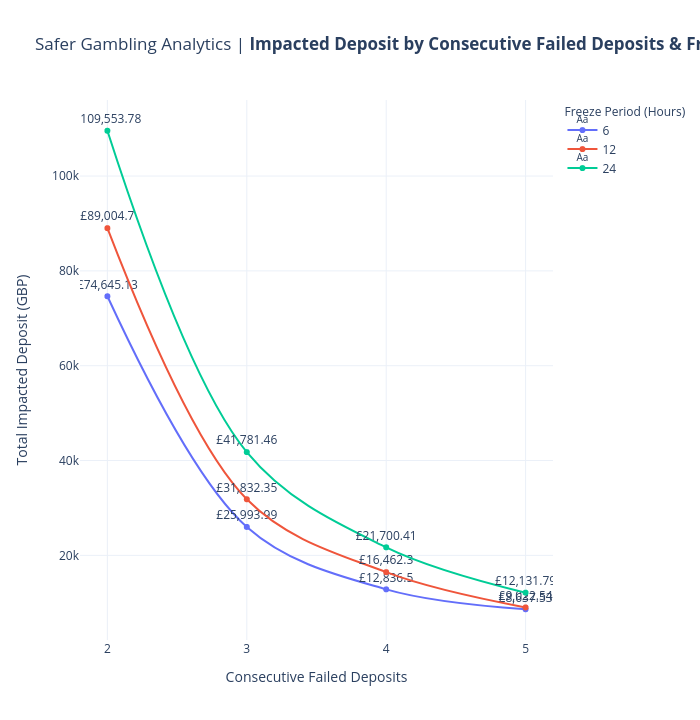
Ags911's interactive graph and data of "Safer Gambling Analytics | Impacted Deposit by Consecutive Failed Deposits & Freeze Hours" is a , showing 6, 12, 24; with Consecutive Failed Deposits in the x-axis and Total Impacted Deposit (GBP) in the y-axis.. The x-axis shows values from 0 to 0. The y-axis shows values from 0 to 0.