Edit chart
Loading graph
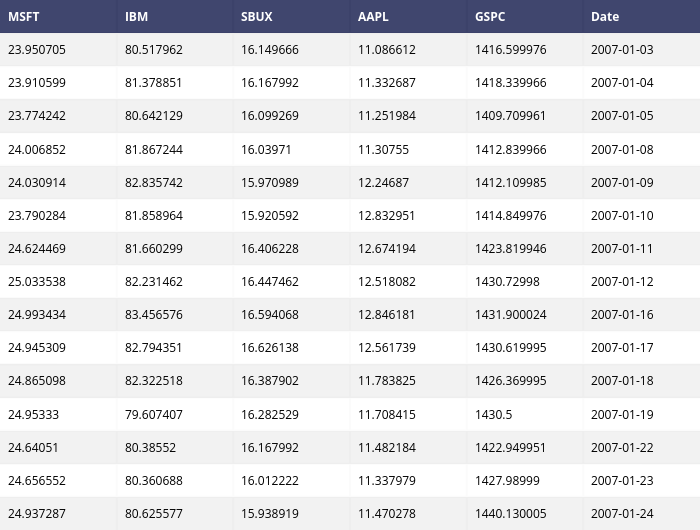
Adamkulidjian's interactive graph and data is a heatmap. The x-axis shows values from 0 to 0. The y-axis shows values from 0 to 0. This visualization has the following annotations: MSFT; IBM; SBUX; AAPL; GSPC; Date; 23.950705; 80.517962; 16.149666; 11.086612; 1416.599976; 2007-01-03; 23.910599; 81.378851; 16.167992; 11.332687; 1418.339966; 2007-01-04; 23.774242; 80.642129; 16.099269; 11.251984; 1409.709961; 2007-01-05; 24.006852; 81.867244; 16.03971; 11.30755; 1412.839966; 2007-01-08; 24.030914; 82.835742; 15.970989; 12.24687; 1412.109985; 2007-01-09; 23.790284; 81.858964; 15.920592; 12.832951; 1414.849976; 2007-01-10; 24.624469; 81.660299; 16.406228; 12.674194; 1423.819946; 2007-01-11; 25.033538; 82.231462; 16.447462; 12.518082; 1430.72998; 2007-01-12; 24.993434; 83.456576; 16.594068; 12.846181; 1431.900024; 2007-01-16; 24.945309; 82.794351; 16.626138; 12.561739; 1430.619995; 2007-01-17; 24.865098; 82.322518; 16.387902; 11.783825; 1426.369995; 2007-01-18; 24.95333; 79.607407; 16.282529; 11.708415; 1430.5; 2007-01-19; 24.64051; 80.38552; 16.167992; 11.482184; 1422.949951; 2007-01-22; 24.656552; 80.360688; 16.012222; 11.337979; 1427.98999; 2007-01-23; 24.937287; 80.625577; 15.938919; 11.470278; 1440.130005; 2007-01-24