Edit chart
Loading graph
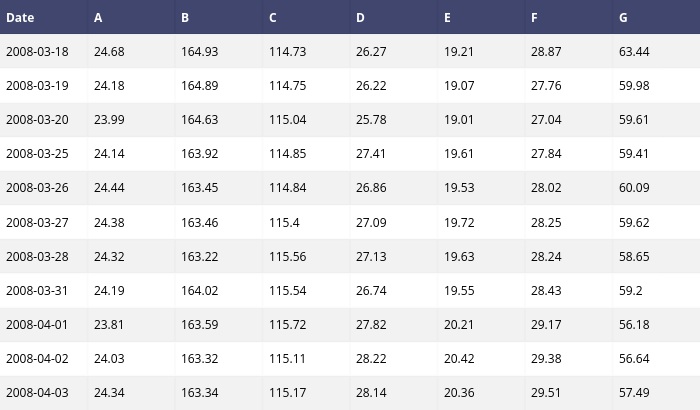
Adamkulidjian's interactive graph and data is a heatmap. The x-axis shows values from 0 to 0. The y-axis shows values from 0 to 0. This visualization has the following annotations: Date; A; B; C; D; E; F; G; 2008-03-18; 24.68; 164.93; 114.73; 26.27; 19.21; 28.87; 63.44; 2008-03-19; 24.18; 164.89; 114.75; 26.22; 19.07; 27.76; 59.98; 2008-03-20; 23.99; 164.63; 115.04; 25.78; 19.01; 27.04; 59.61; 2008-03-25; 24.14; 163.92; 114.85; 27.41; 19.61; 27.84; 59.41; 2008-03-26; 24.44; 163.45; 114.84; 26.86; 19.53; 28.02; 60.09; 2008-03-27; 24.38; 163.46; 115.4; 27.09; 19.72; 28.25; 59.62; 2008-03-28; 24.32; 163.22; 115.56; 27.13; 19.63; 28.24; 58.65; 2008-03-31; 24.19; 164.02; 115.54; 26.74; 19.55; 28.43; 59.2; 2008-04-01; 23.81; 163.59; 115.72; 27.82; 20.21; 29.17; 56.18; 2008-04-02; 24.03; 163.32; 115.11; 28.22; 20.42; 29.38; 56.64; 2008-04-03; 24.34; 163.34; 115.17; 28.14; 20.36; 29.51; 57.49