Edit chart
Loading graph
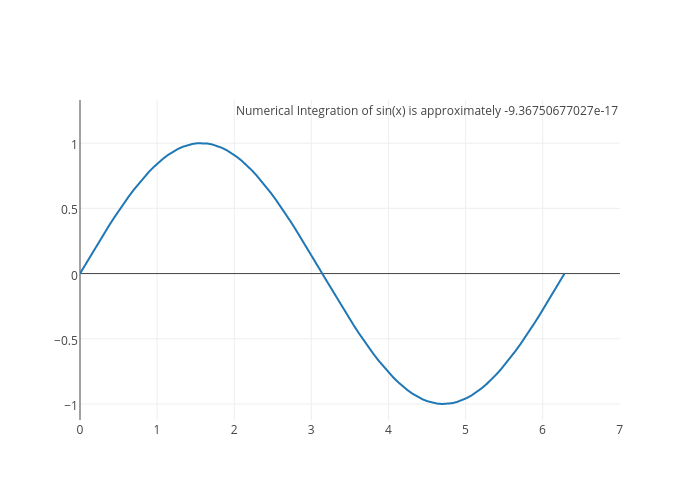
Adamkulidjian's interactive graph and data is a line chart. The x-axis shows values from 0 to 0. The y-axis shows values from 0 to 0. This visualization has the following annotation: Numerical Integration of sin(x) is approximately -9.36750677027e-17