Edit chart
Loading graph
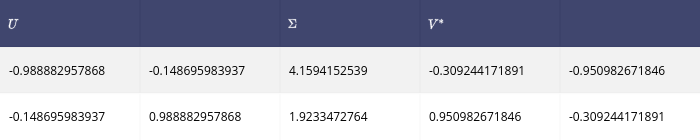
Adamkulidjian's interactive graph and data is a heatmap. The x-axis shows values from 0 to 0. The y-axis shows values from 0 to 0. This visualization has the following annotations: $U$; ; $\Sigma$; $V^*$; ; -0.988882957868; -0.148695983937; 4.1594152539; -0.309244171891; -0.950982671846; -0.148695983937; 0.988882957868; 1.9233472764; 0.950982671846; -0.309244171891