Edit chart
Loading graph
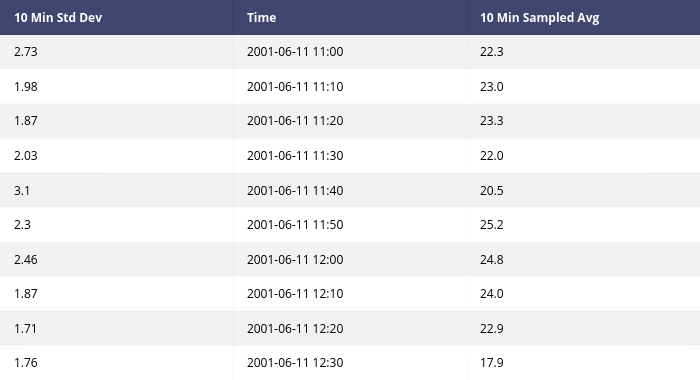
Adamkulidjian's interactive graph and data is a heatmap. The x-axis shows values from 0 to 0. The y-axis shows values from 0 to 0. This visualization has the following annotations: 10 Min Std Dev; Time; 10 Min Sampled Avg; 2.73; 2001-06-11 11:00; 22.3; 1.98; 2001-06-11 11:10; 23.0; 1.87; 2001-06-11 11:20; 23.3; 2.03; 2001-06-11 11:30; 22.0; 3.1; 2001-06-11 11:40; 20.5; 2.3; 2001-06-11 11:50; 25.2; 2.46; 2001-06-11 12:00; 24.8; 1.87; 2001-06-11 12:10; 24.0; 1.71; 2001-06-11 12:20; 22.9; 1.76; 2001-06-11 12:30; 17.9