Edit chart
Loading graph
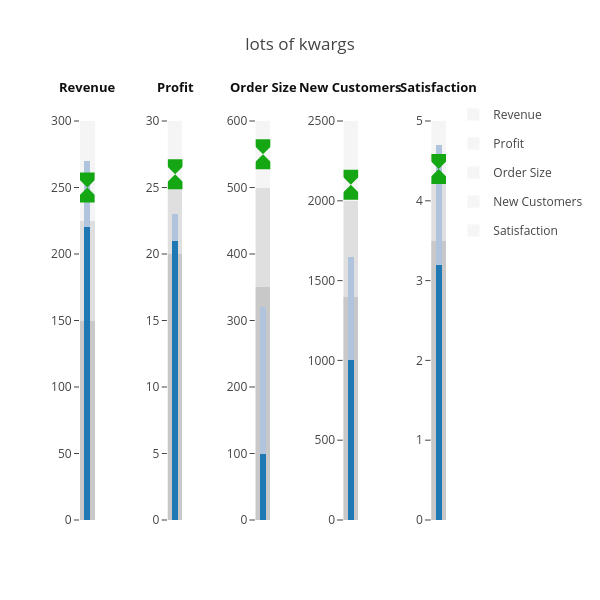
Adamkulidjian's interactive graph and data of "lots of kwargs" is a stacked bar chart, showing Revenue, Revenue, Revenue, Revenue, Revenue, Revenue, Profit, Profit, Profit, Profit, Profit, Profit, Order Size, Order Size, Order Size, Order Size, Order Size, Order Size, New Customers, New Customers, New Customers, New Customers, New Customers, New Customers, Satisfaction, Satisfaction, Satisfaction, Satisfaction, Satisfaction, Satisfaction. The x-axis shows values from 0 to 0. The y-axis shows values from 0 to 0. This visualization has the following annotations: Revenue; Profit; Order Size; New Customers; Satisfaction