Edit chart
Loading graph
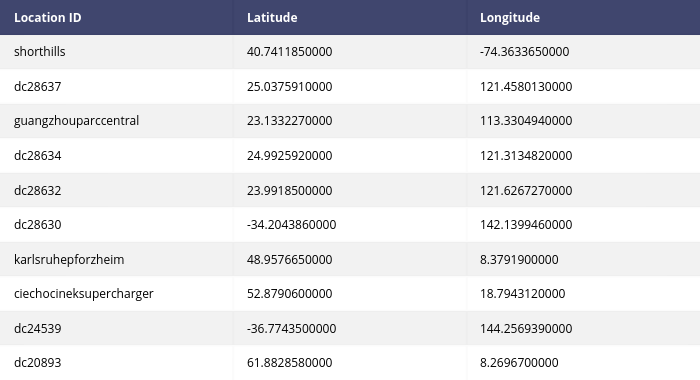
Adamkulidjian's interactive graph and data is a heatmap. The x-axis shows values from 0 to 0. The y-axis shows values from 0 to 0. This visualization has the following annotations: Location ID; Latitude; Longitude; shorthills; 40.7411850000; -74.3633650000; dc28637; 25.0375910000; 121.4580130000; guangzhouparccentral; 23.1332270000; 113.3304940000; dc28634; 24.9925920000; 121.3134820000; dc28632; 23.9918500000; 121.6267270000; dc28630; -34.2043860000; 142.1399460000; karlsruhepforzheim; 48.9576650000; 8.3791900000; ciechocineksupercharger; 52.8790600000; 18.7943120000; dc24539; -36.7743500000; 144.2569390000; dc20893; 61.8828580000; 8.2696700000