Edit chart
Loading graph
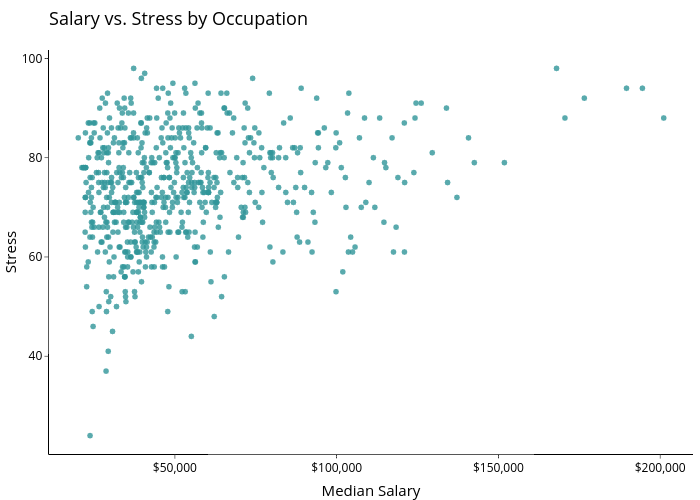
4pillarfreedom's interactive graph and data of "Salary vs. Stress by Occupation" is a scatter chart; with Median Salary in the x-axis and Stress in the y-axis.. The x-axis shows values from 11086.4 to 210142.4. The y-axis shows values from 20.3 to 101.7.