Edit chart
Loading graph
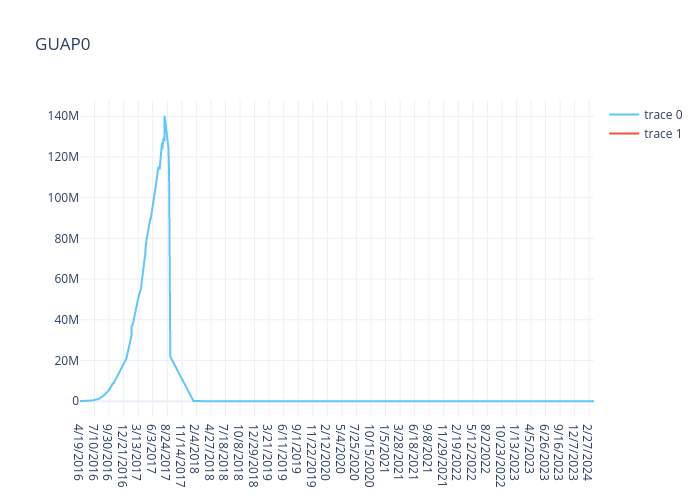
2e's interactive graph and data of "GUAP0" is a line chart. The x-axis shows values from 0 to 2897. The y-axis shows values from -7789447.333333333 to 147999499.33333334.