Edit chart
Loading graph
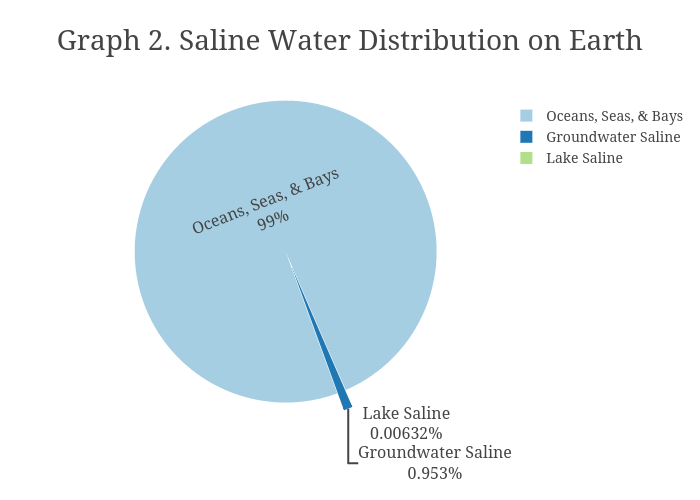
18daviest's interactive graph and data of "Graph 2. Saline Water Distribution on Earth " is a pie, showing Volume (km³). The x-axis shows values from 0 to 0. The y-axis shows values from 0 to 0.