Edit chart
Loading graph
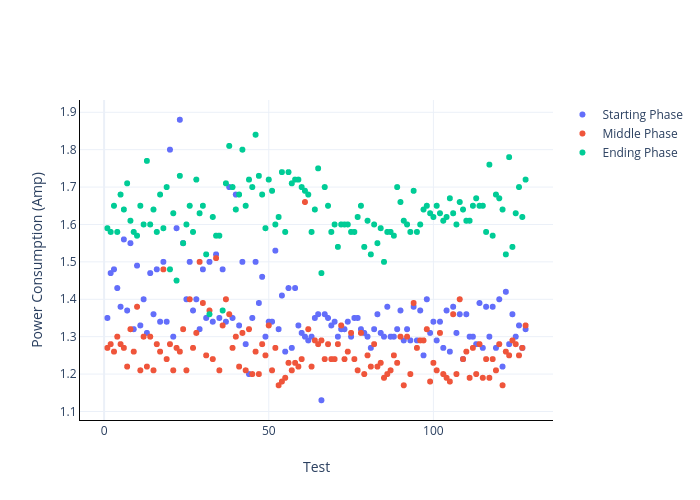
13eric's interactive graph and data of "Power Consumption (Amp) vs Test" is a scatter chart, showing Starting Phase, Middle Phase, Ending Phase; with Test in the x-axis and Power Consumption (Amp) in the y-axis.. The x-axis shows values from -6.938824904022702 to 135.9388249040227. The y-axis shows values from 1.0649775784753361 to 1.9450224215246636.