Edit chart
Loading graph
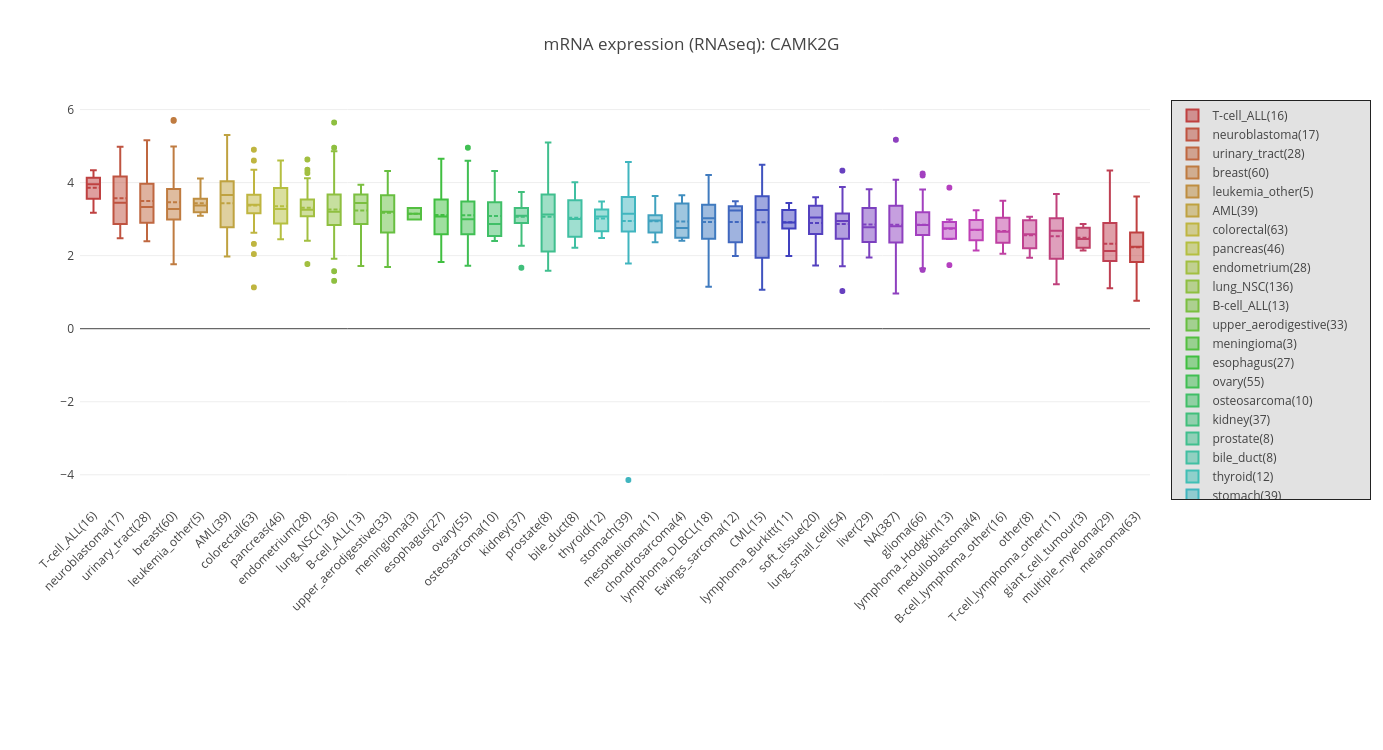
11518176's interactive graph and data of "mRNA expression (RNAseq): CAMK2G" is a box plot, showing T-cell_ALL(16), neuroblastoma(17), urinary_tract(28), breast(60), leukemia_other(5), AML(39), colorectal(63), pancreas(46), endometrium(28), lung_NSC(136), B-cell_ALL(13), upper_aerodigestive(33), meningioma(3), esophagus(27), ovary(55), osteosarcoma(10), kidney(37), prostate(8), bile_duct(8), thyroid(12), stomach(39), mesothelioma(11), chondrosarcoma(4), lymphoma_DLBCL(18), Ewings_sarcoma(12), CML(15), lymphoma_Burkitt(11), soft_tissue(20), lung_small_cell(54), liver(29), NA(387), glioma(66), lymphoma_Hodgkin(13), medulloblastoma(4), B-cell_lymphoma_other(16), other(8), T-cell_lymphoma_other(11), giant_cell_tumour(3), multiple_myeloma(29), melanoma(63). The x-axis shows values from -0.5 to 39.5. The y-axis shows values from -4.689995496862434 to 6.261972757663054.