Edit chart
Loading graph
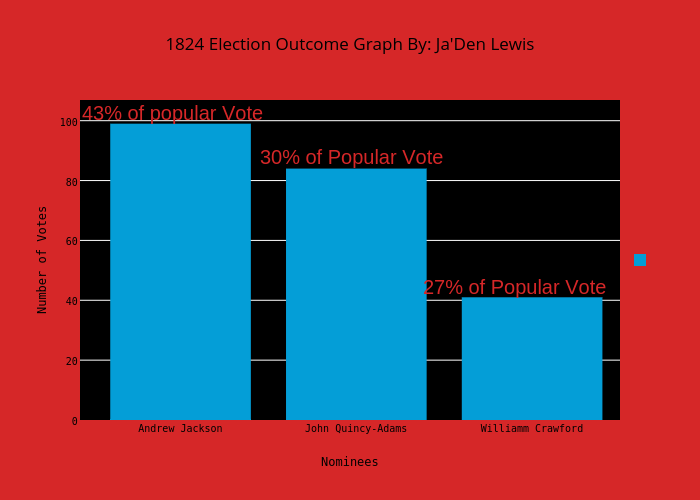
1138881's interactive graph and data of "1824 Election Outcome Graph By: Ja'Den Lewis" is a bar chart, showing ; with Nominees in the x-axis and Number of Votes in the y-axis.. The x-axis shows values from -0.5 to 2.5. The y-axis shows values from 0 to 105.78397212543554. This visualization has the following annotations: 27% of Popular Vote; 30% of Popular Vote; 43% of popular Vote