Jupyter Lab with FigureWidget in Python/v3
Using Plotly FigureWidgets with Jupyter Lab
Note: this page is part of the documentation for version 3 of Plotly.py, which is not the most recent version.
See our Version 4 Migration Guide for information about how to upgrade.
The version 4 version of this page is here.
See our Version 4 Migration Guide for information about how to upgrade.
The version 4 version of this page is here.
New to Plotly?
Plotly's Python library is free and open source! Get started by downloading the client and reading the primer.
You can set up Plotly to work in online or offline mode, or in jupyter notebooks.
We also have a quick-reference cheatsheet (new!) to help you get started!
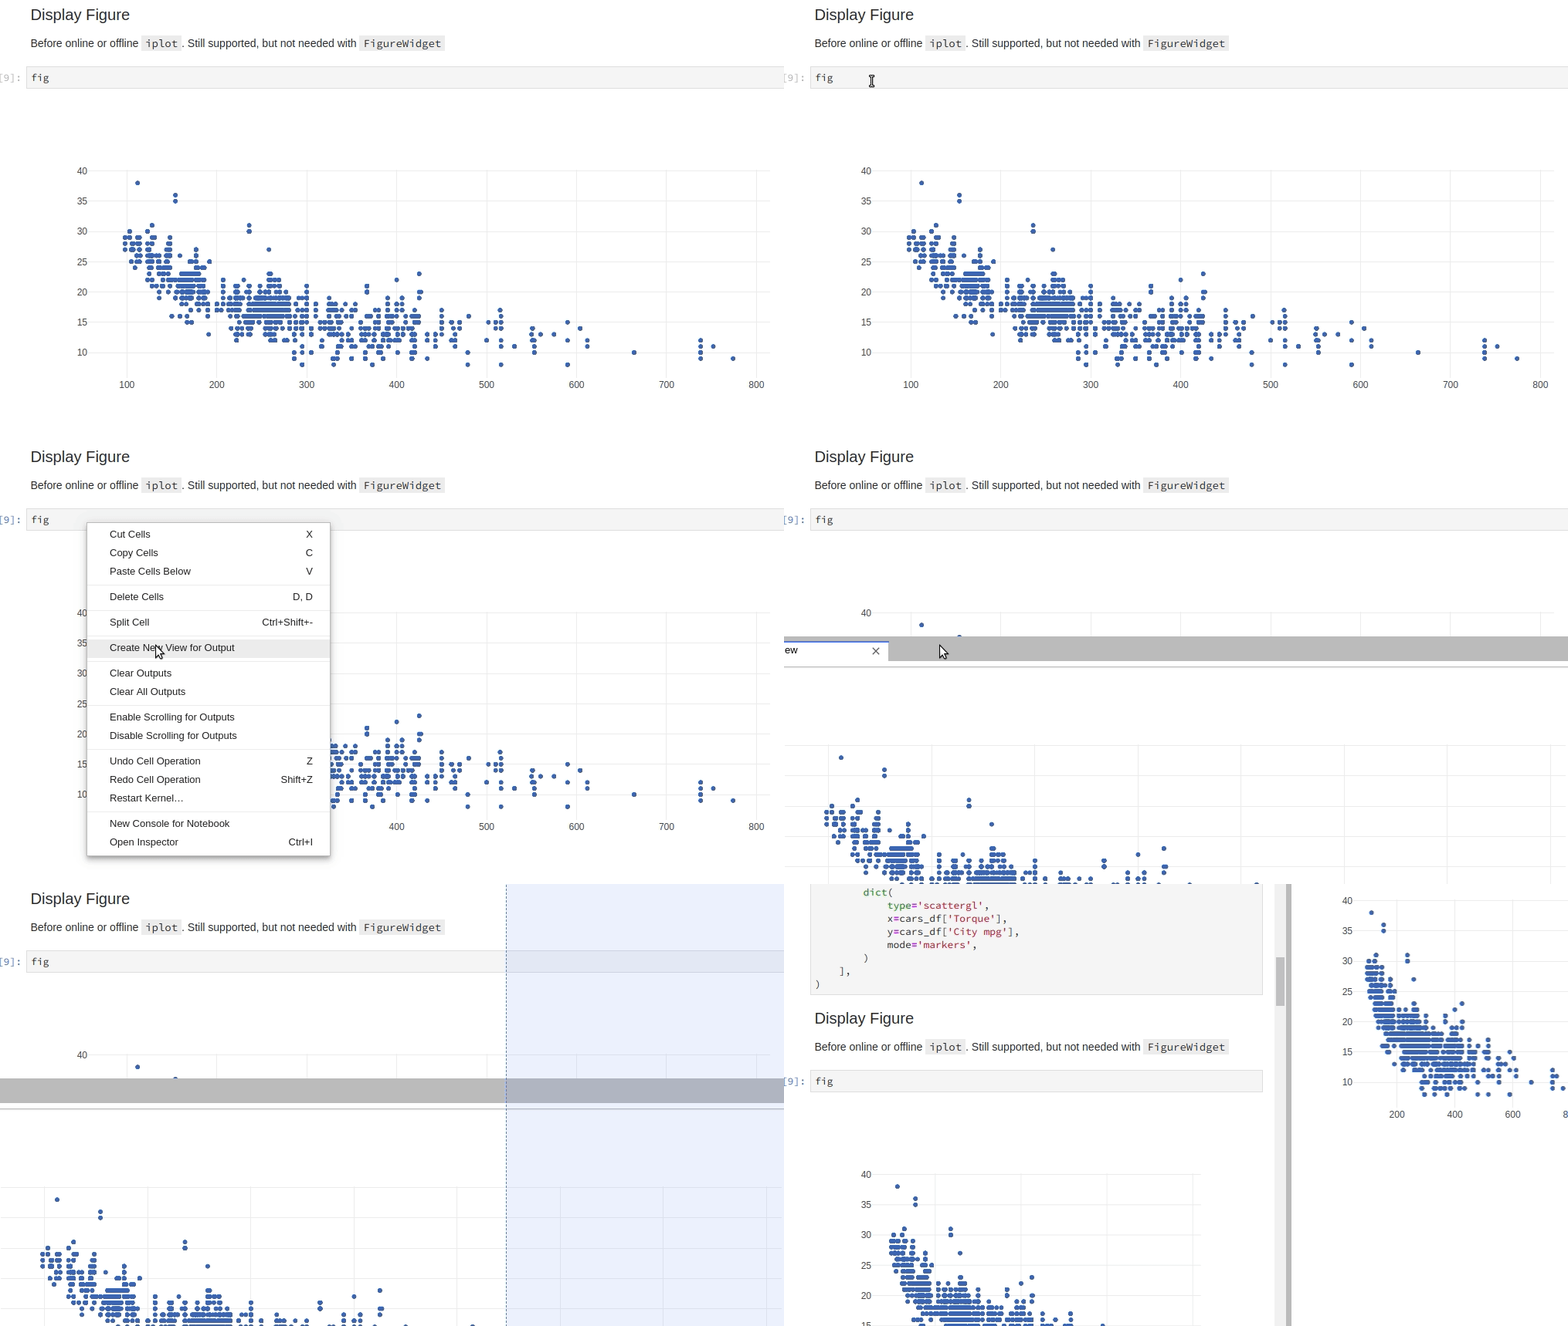
Create a New View for Output
Display a FigureWidget and then create a new window to display it in so that you can scroll through your code but still keep an eye on what you're doing.

View Live Updates
With the output view it is easy to take full advantage of FigureWidgets new impertive-style graph updates since you can see your code and your graph at the same time.

Reference
See these Jupyter notebooks for even more FigureWidget examples.


