MATLAB contour in MATLAB®
Learn how to make 7 contour charts in MATLAB, then publish them to the Web with Plotly.
Contours of a Function
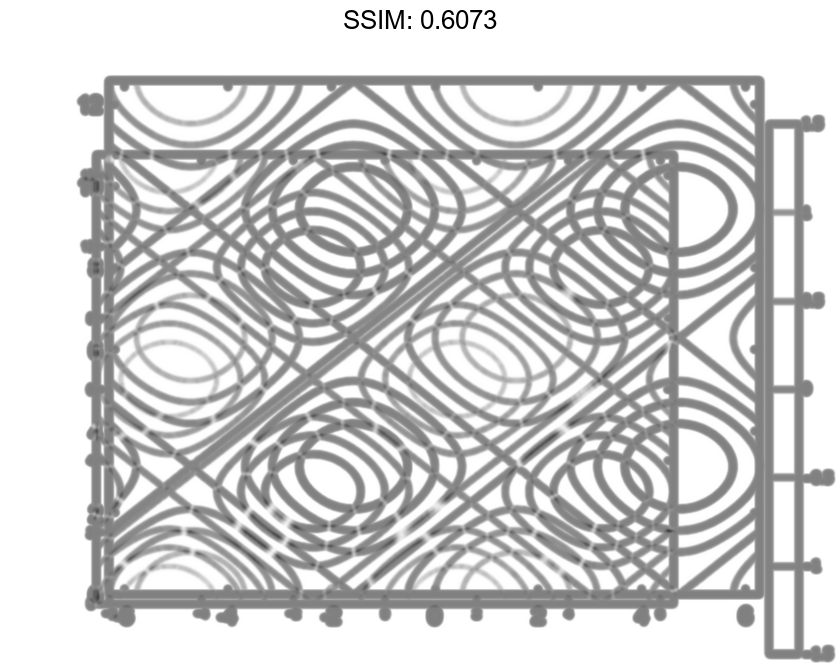
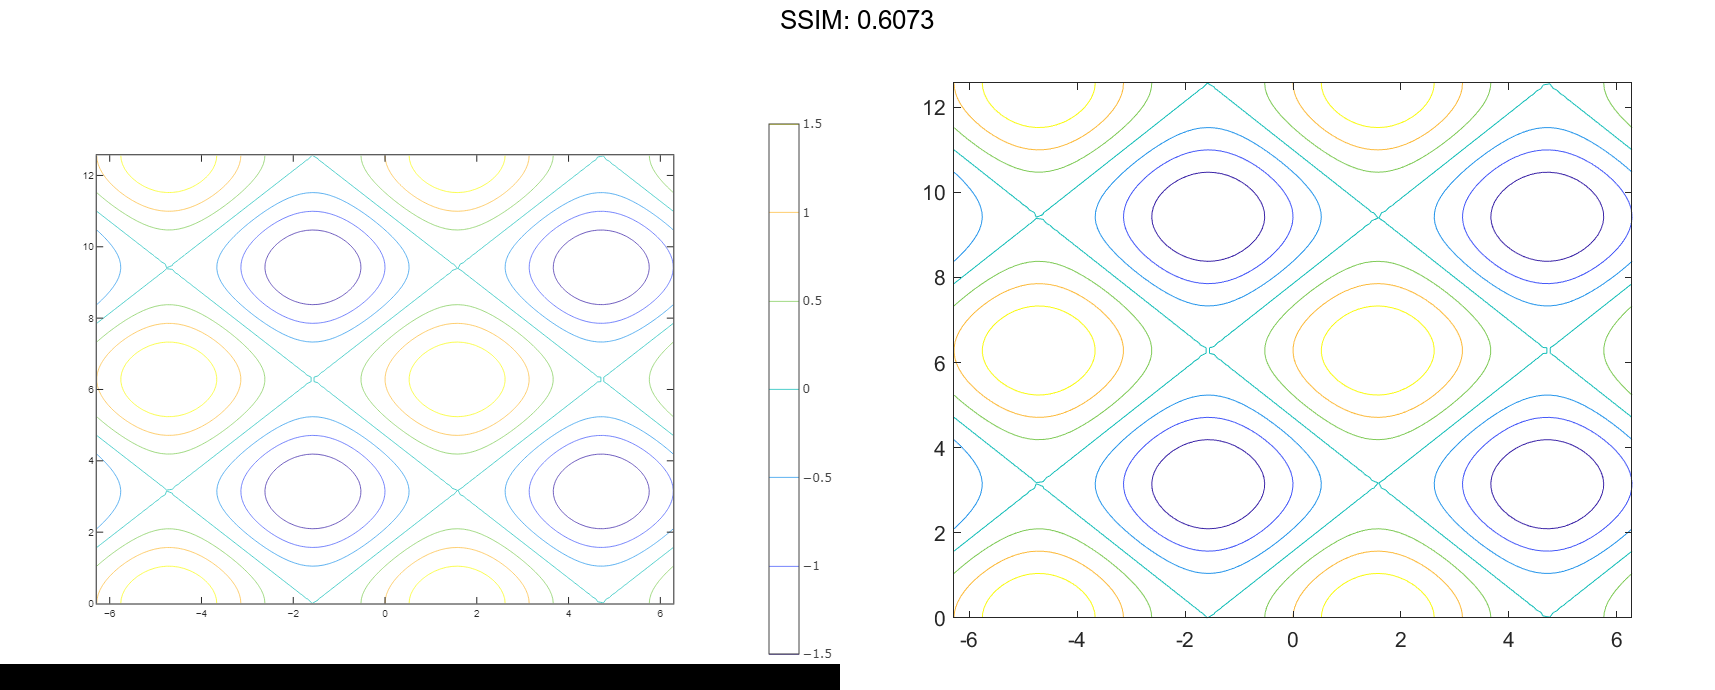
Create matrices X and Y, that define a grid in the x-y plane. Define matrix Z as the heights above that grid. Then plot the contours of Z.
x = linspace(-2*pi,2*pi);
y = linspace(0,4*pi);
[X,Y] = meshgrid(x,y);
Z = sin(X)+cos(Y);
contour(X,Y,Z)

fig2plotly()
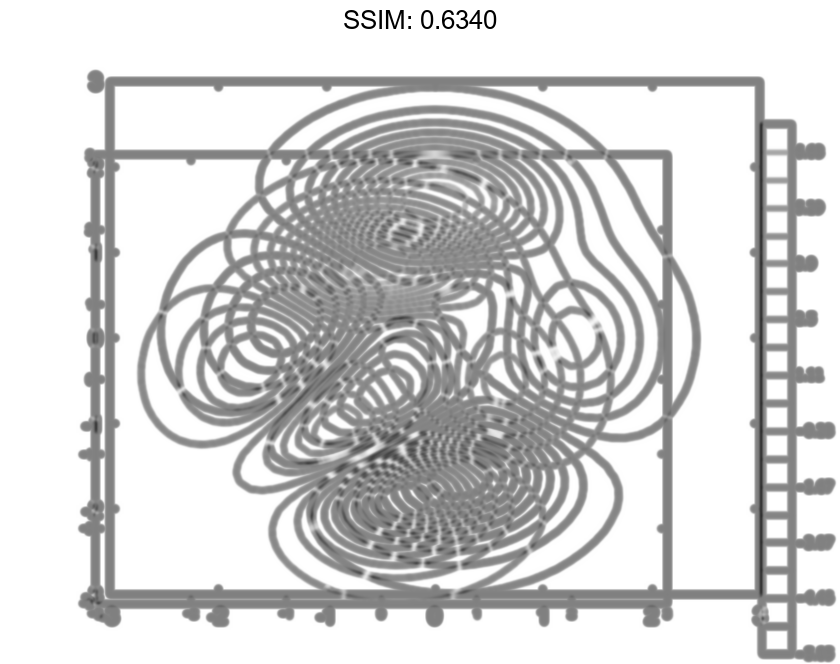
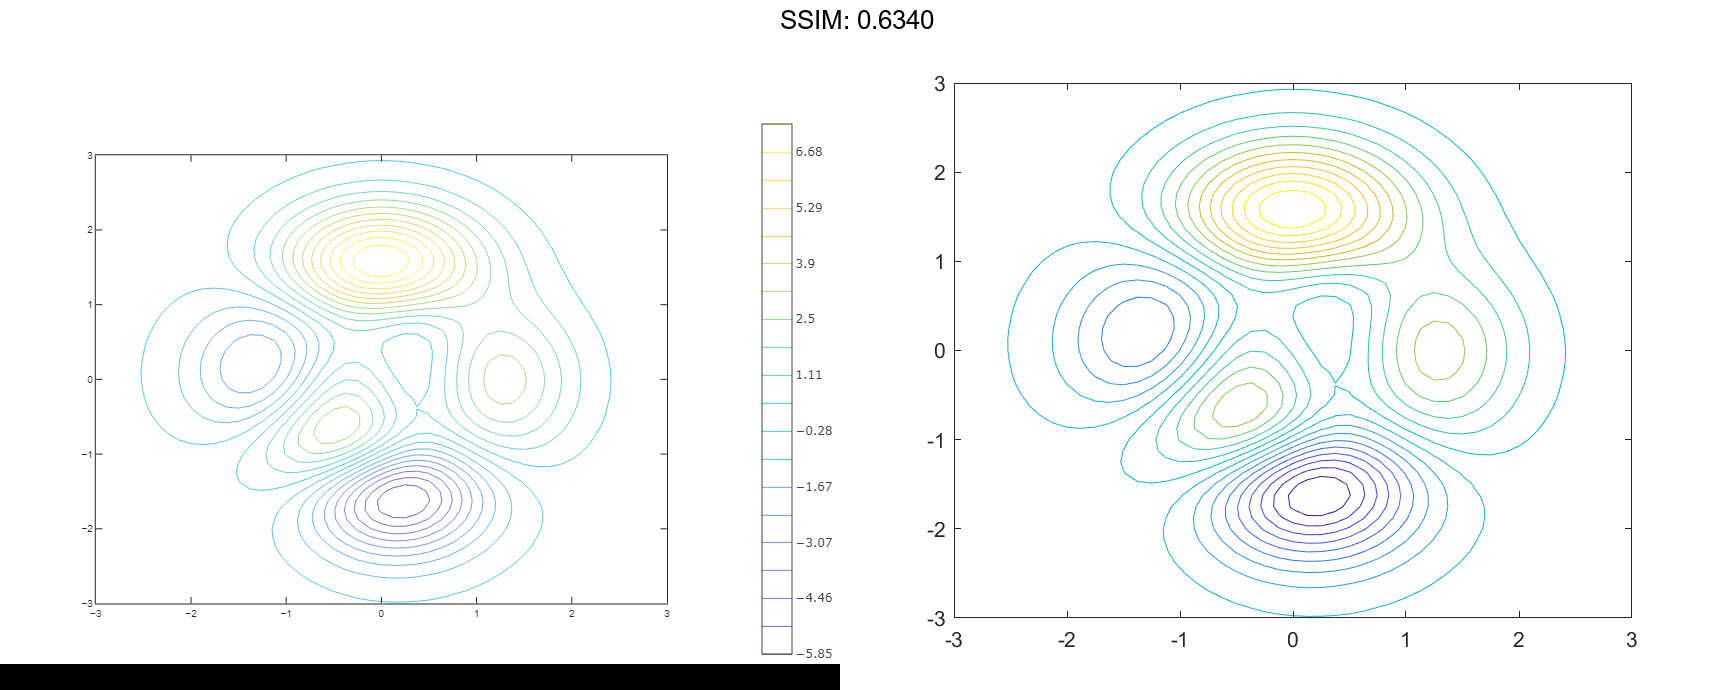
Contours at Twenty Levels
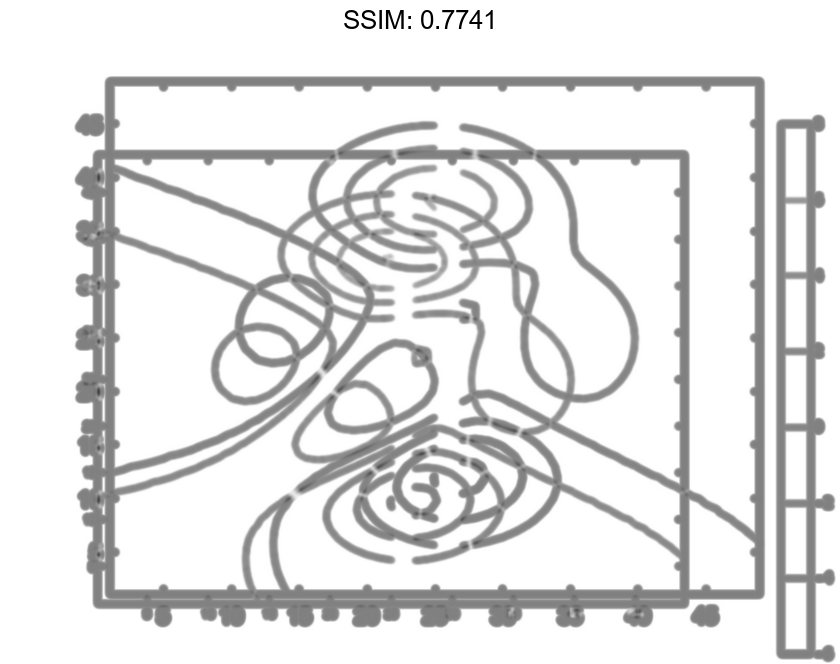
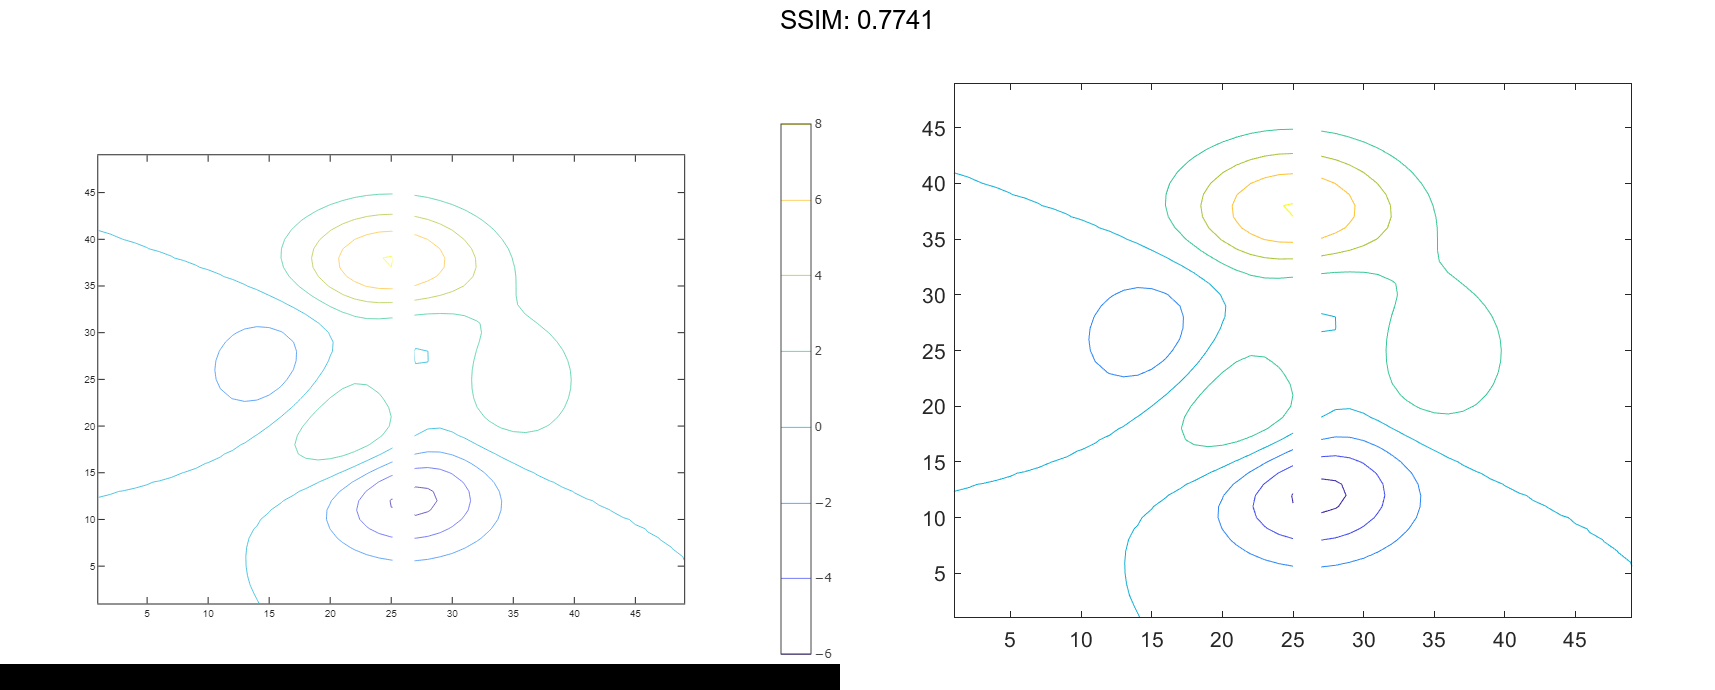
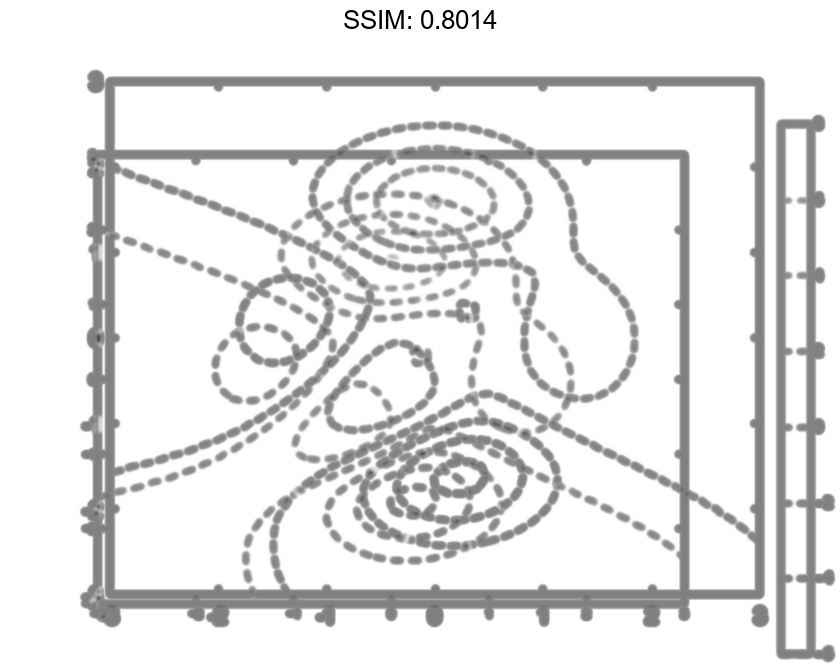
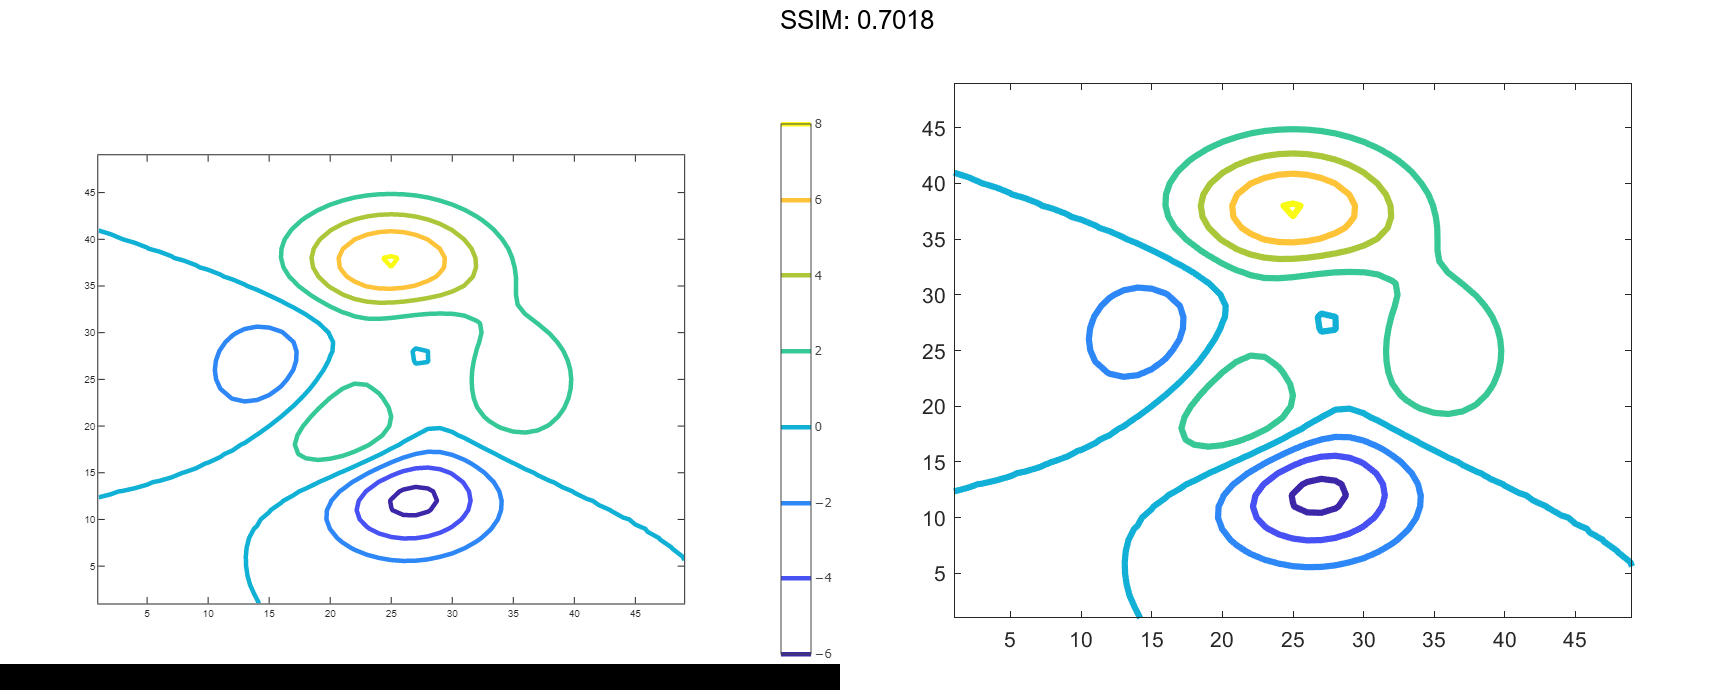
Define Z as a function of X and Y. In this case, call the peaks function to create X, Y, and Z. Then plot 20 contours of Z.
[X,Y,Z] = peaks;
contour(X,Y,Z,20)

fig2plotly()
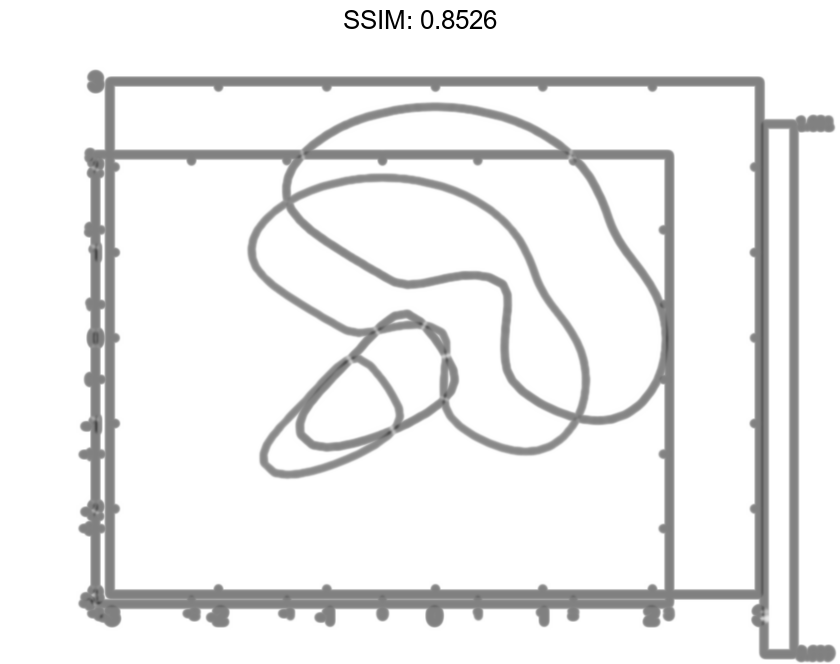
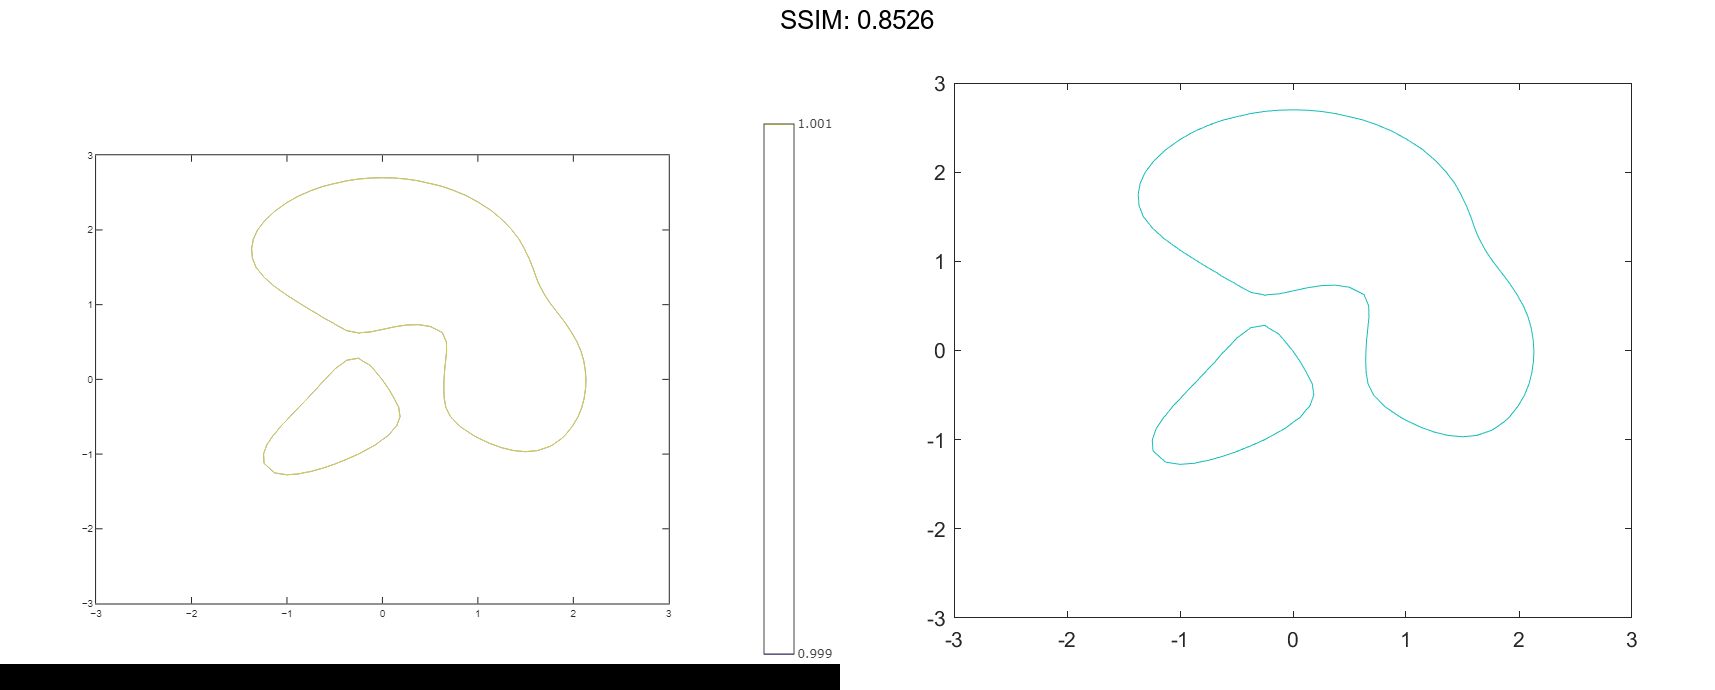
Contours at One Level
Display the contours of the peaks function at Z = 1.
[X,Y,Z] = peaks;
v = [1,1];
contour(X,Y,Z,v)

fig2plotly()
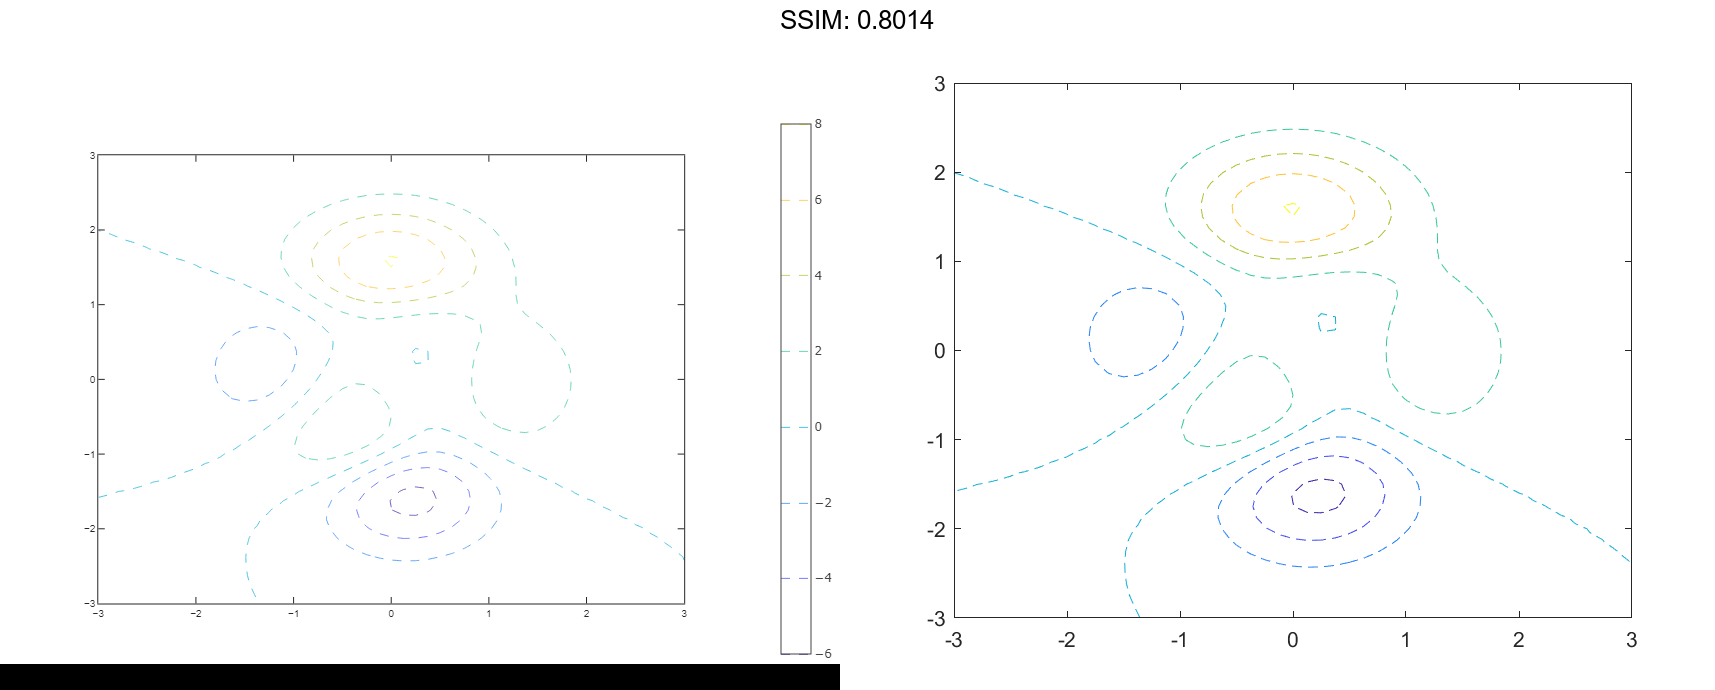
Dashed Contour Lines
Create a contour plot of the peaks function, and specify the dashed line style.
[X,Y,Z] = peaks;
contour(X,Y,Z,'--')

fig2plotly()
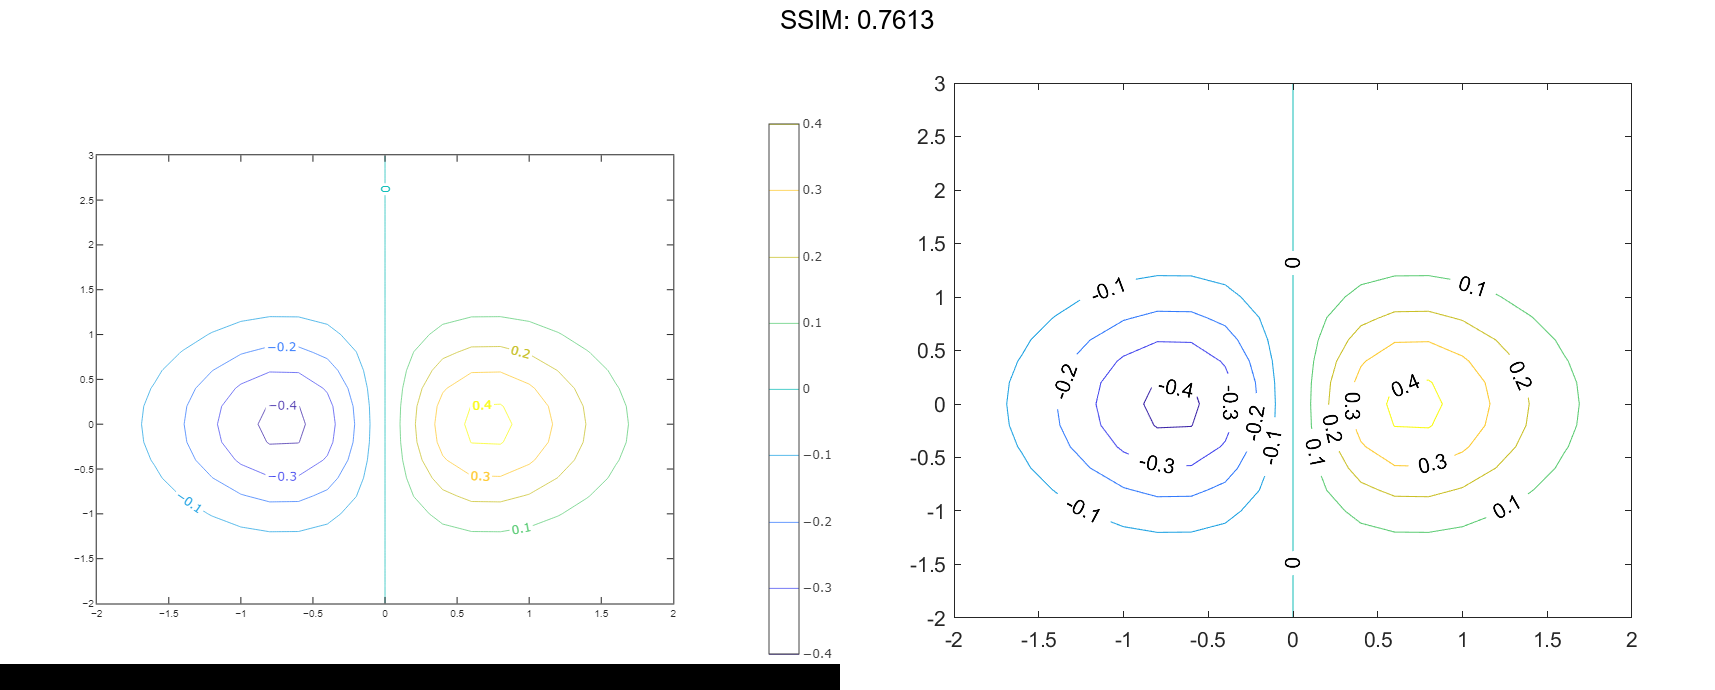
Contours with Labels
Define Z as a function of two variables, X and Y. Then create a contour plot of that function, and display the labels by setting the ShowText property to 'on'.
x = -2:0.2:2;
y = -2:0.2:3;
[X,Y] = meshgrid(x,y);
Z = X.*exp(-X.^2-Y.^2);
contour(X,Y,Z,'ShowText','on')

fig2plotly()
Custom Line Width
Create a contour plot of the peaks function. Make the contour lines thicker by setting the LineWidth property to 3.
Z = peaks;
[M,c] = contour(Z);
c.LineWidth = 3;

fig2plotly()
Contours Over Discontinuous Surface
Insert NaN values wherever there are discontinuities on a surface. The contour function does not draw contour lines in those regions.
Define matrix Z as a sampling of the peaks function. Replace all values in column 26 with NaN values. Then plot the contours of the modified Z matrix.
Z = peaks;
Z(:,26) = NaN;
contour(Z)

fig2plotly()