GGPLOT - geom_violin
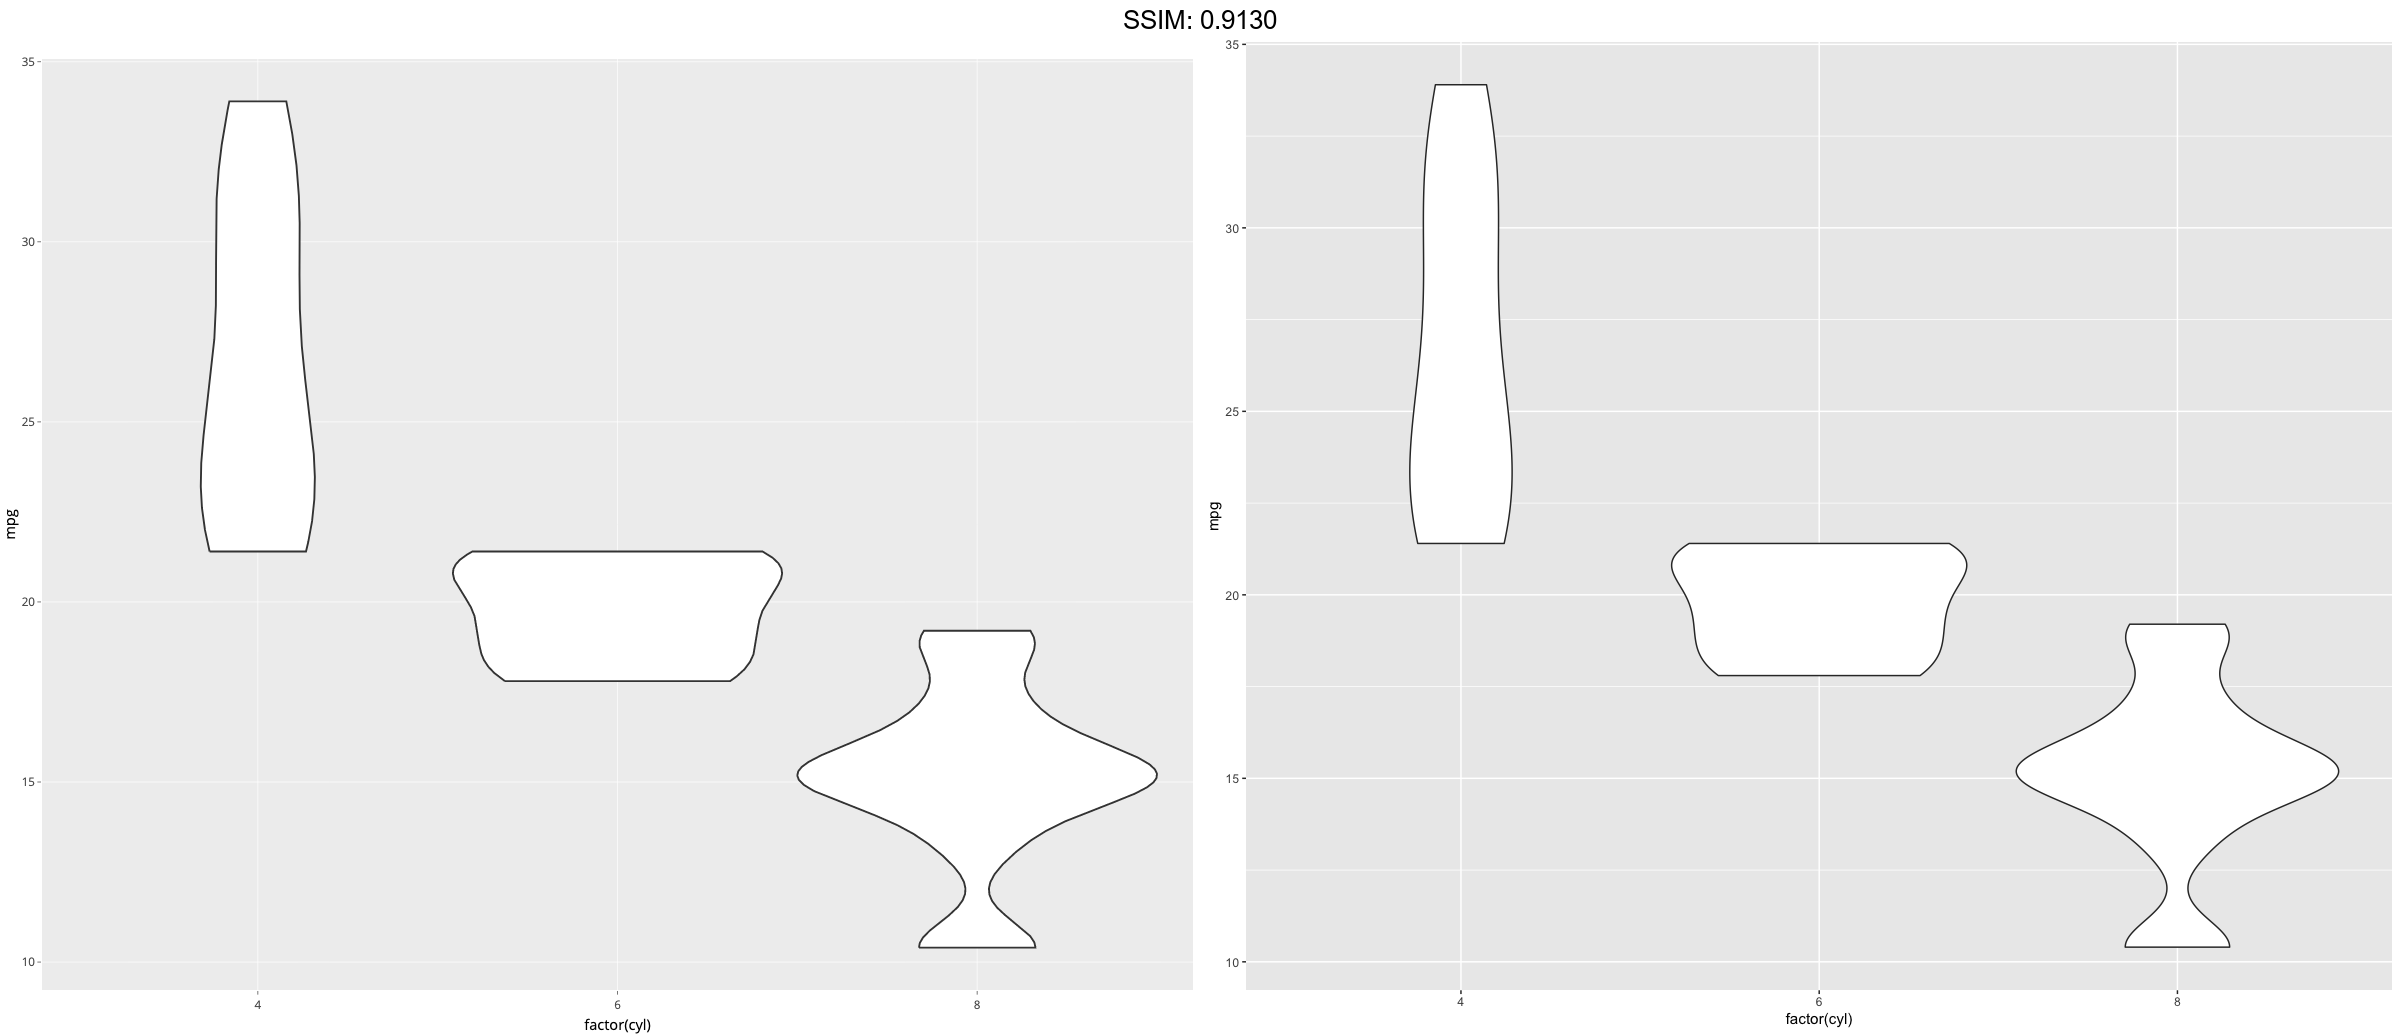
Creates compact display of a continuous distribution and then convert them with ggplotly.
p <- ggplot(mtcars, aes(factor(cyl), mpg))
p <- p + geom_violin()
plotly::ggplotly(p)


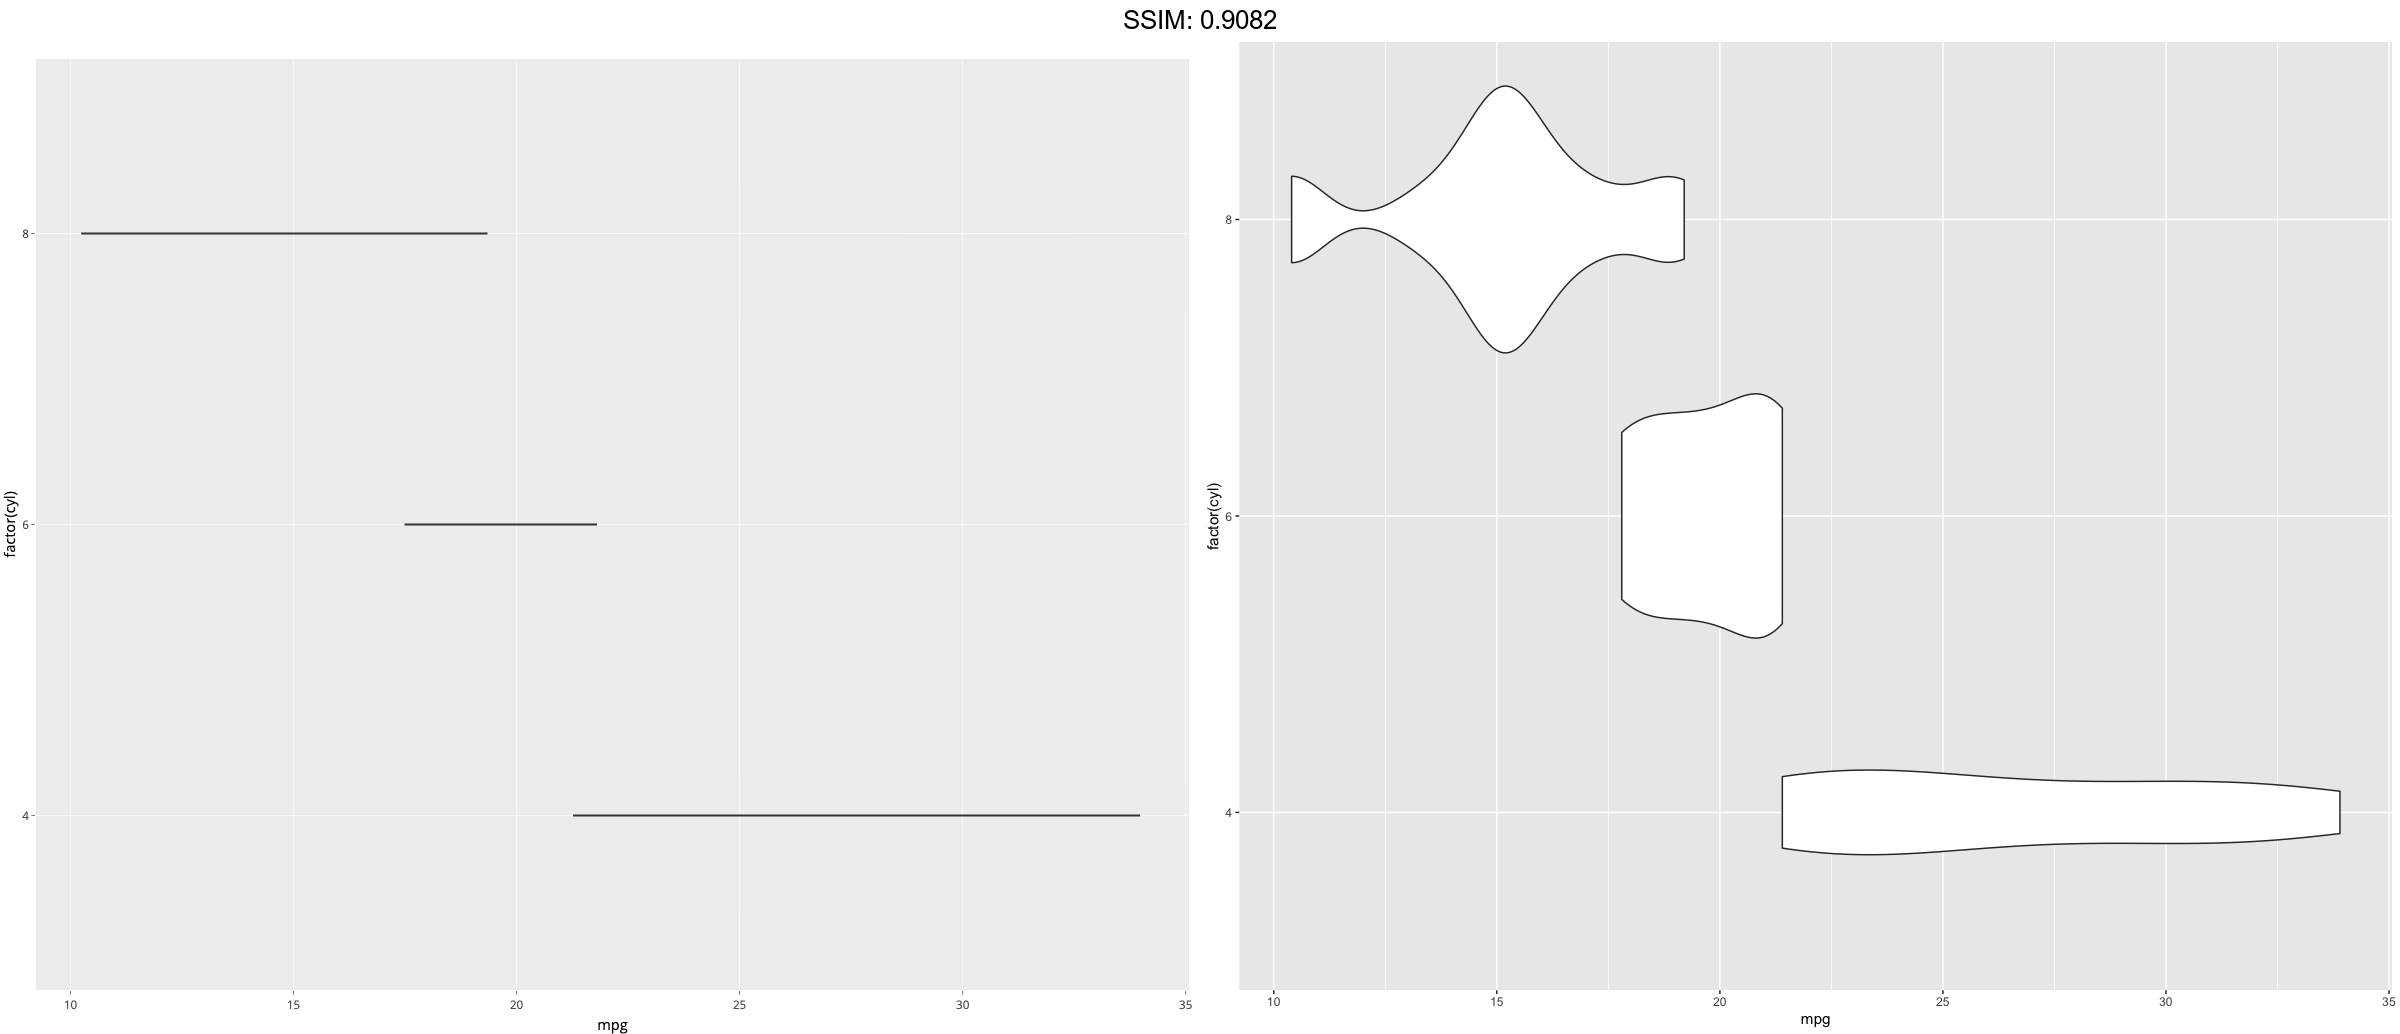
p <-
 ggplot(mtcars, aes(mpg, factor(cyl))) +
  geom_violin()
plotly::ggplotly(p)


p <- ggplot(mtcars, aes(factor(cyl), mpg))
p <- p + geom_violin() + geom_jitter(height = 0, width = 0.1)
plotly::ggplotly(p)


p <- ggplot(mtcars, aes(factor(cyl), mpg))
p <- p + geom_violin(scale = "count")
plotly::ggplotly(p)

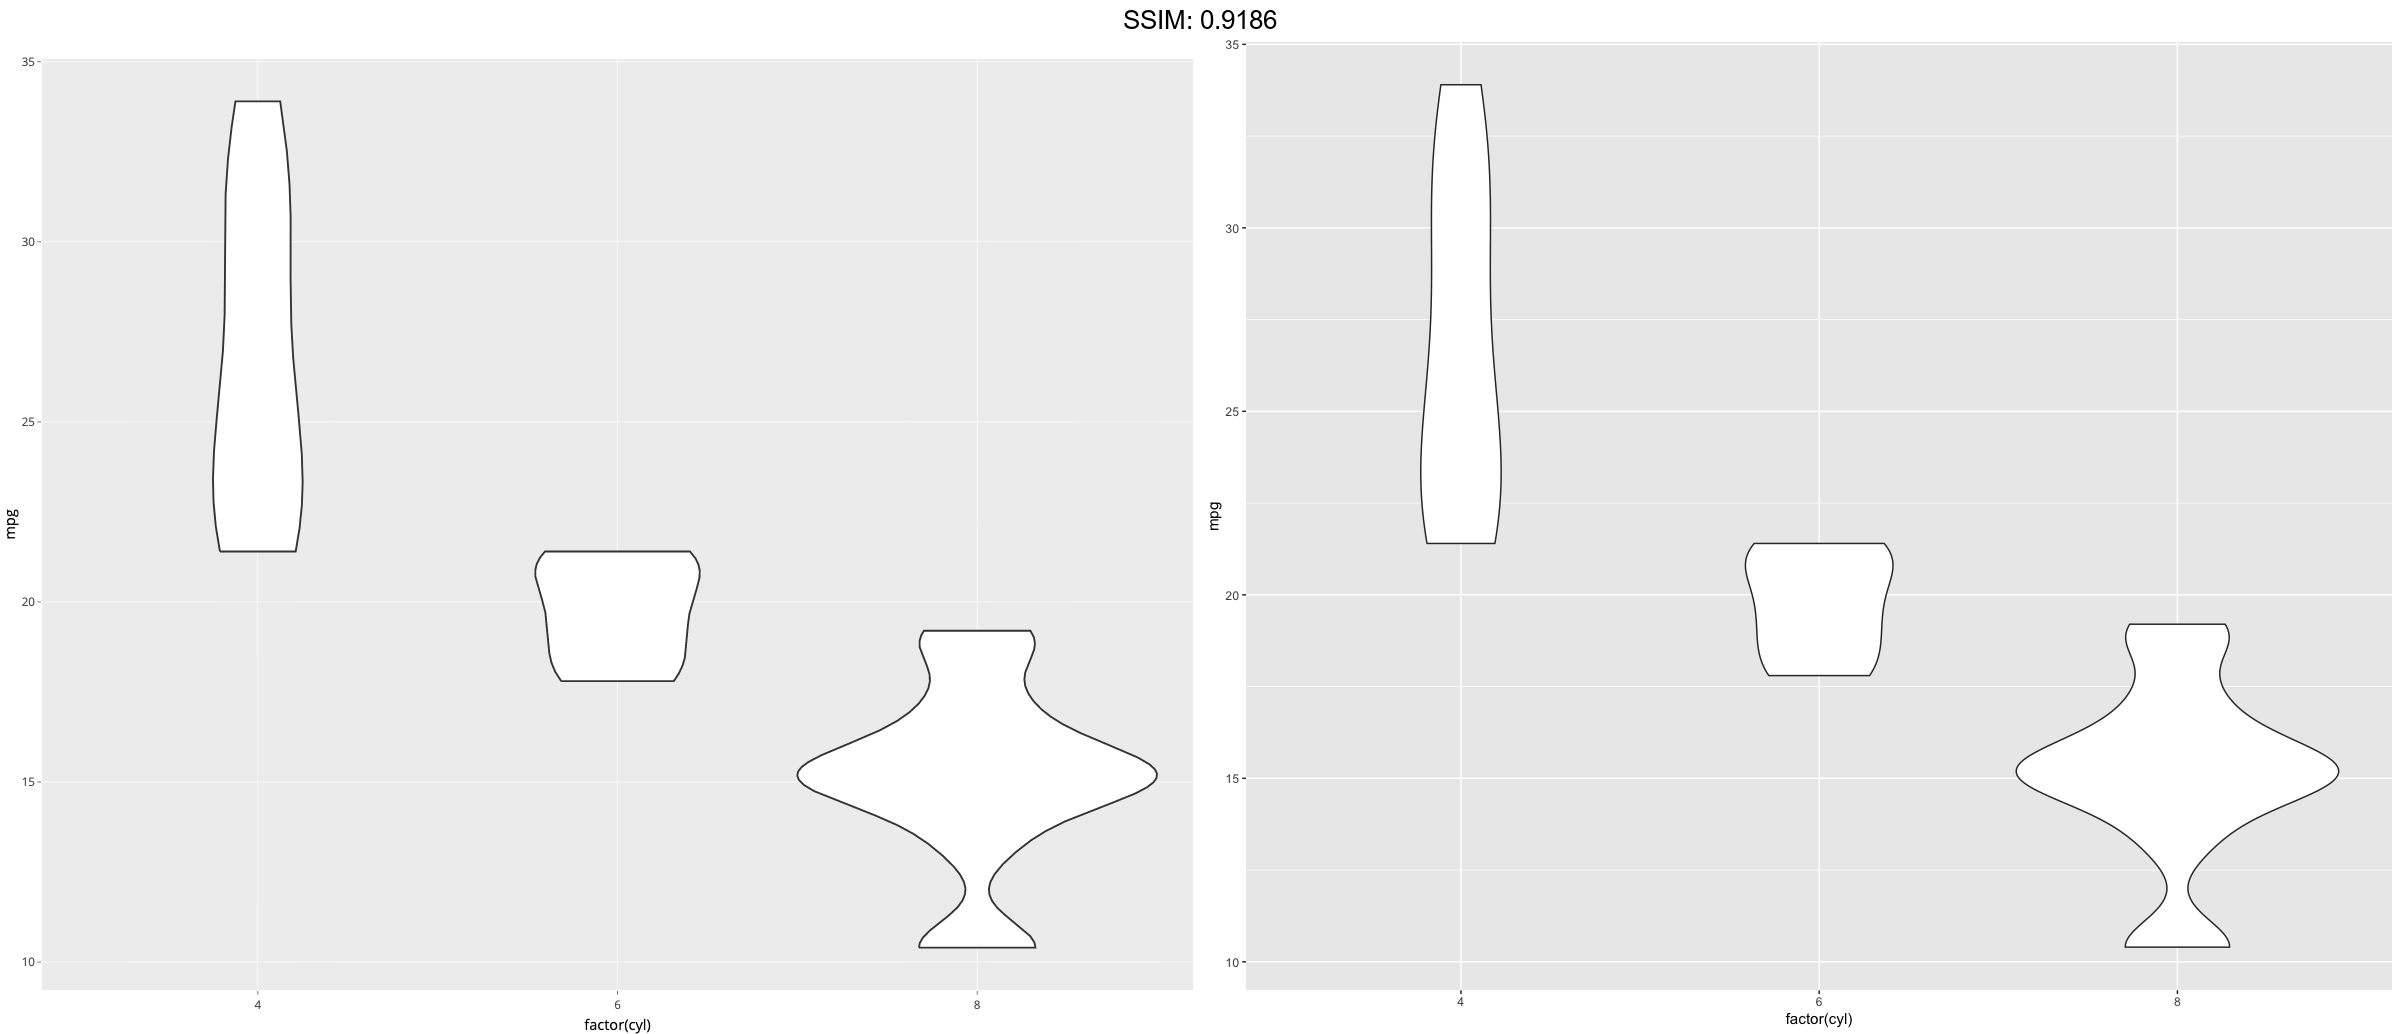

p <- ggplot(mtcars, aes(factor(cyl), mpg))
p <- p + geom_violin(scale = "width")
plotly::ggplotly(p)

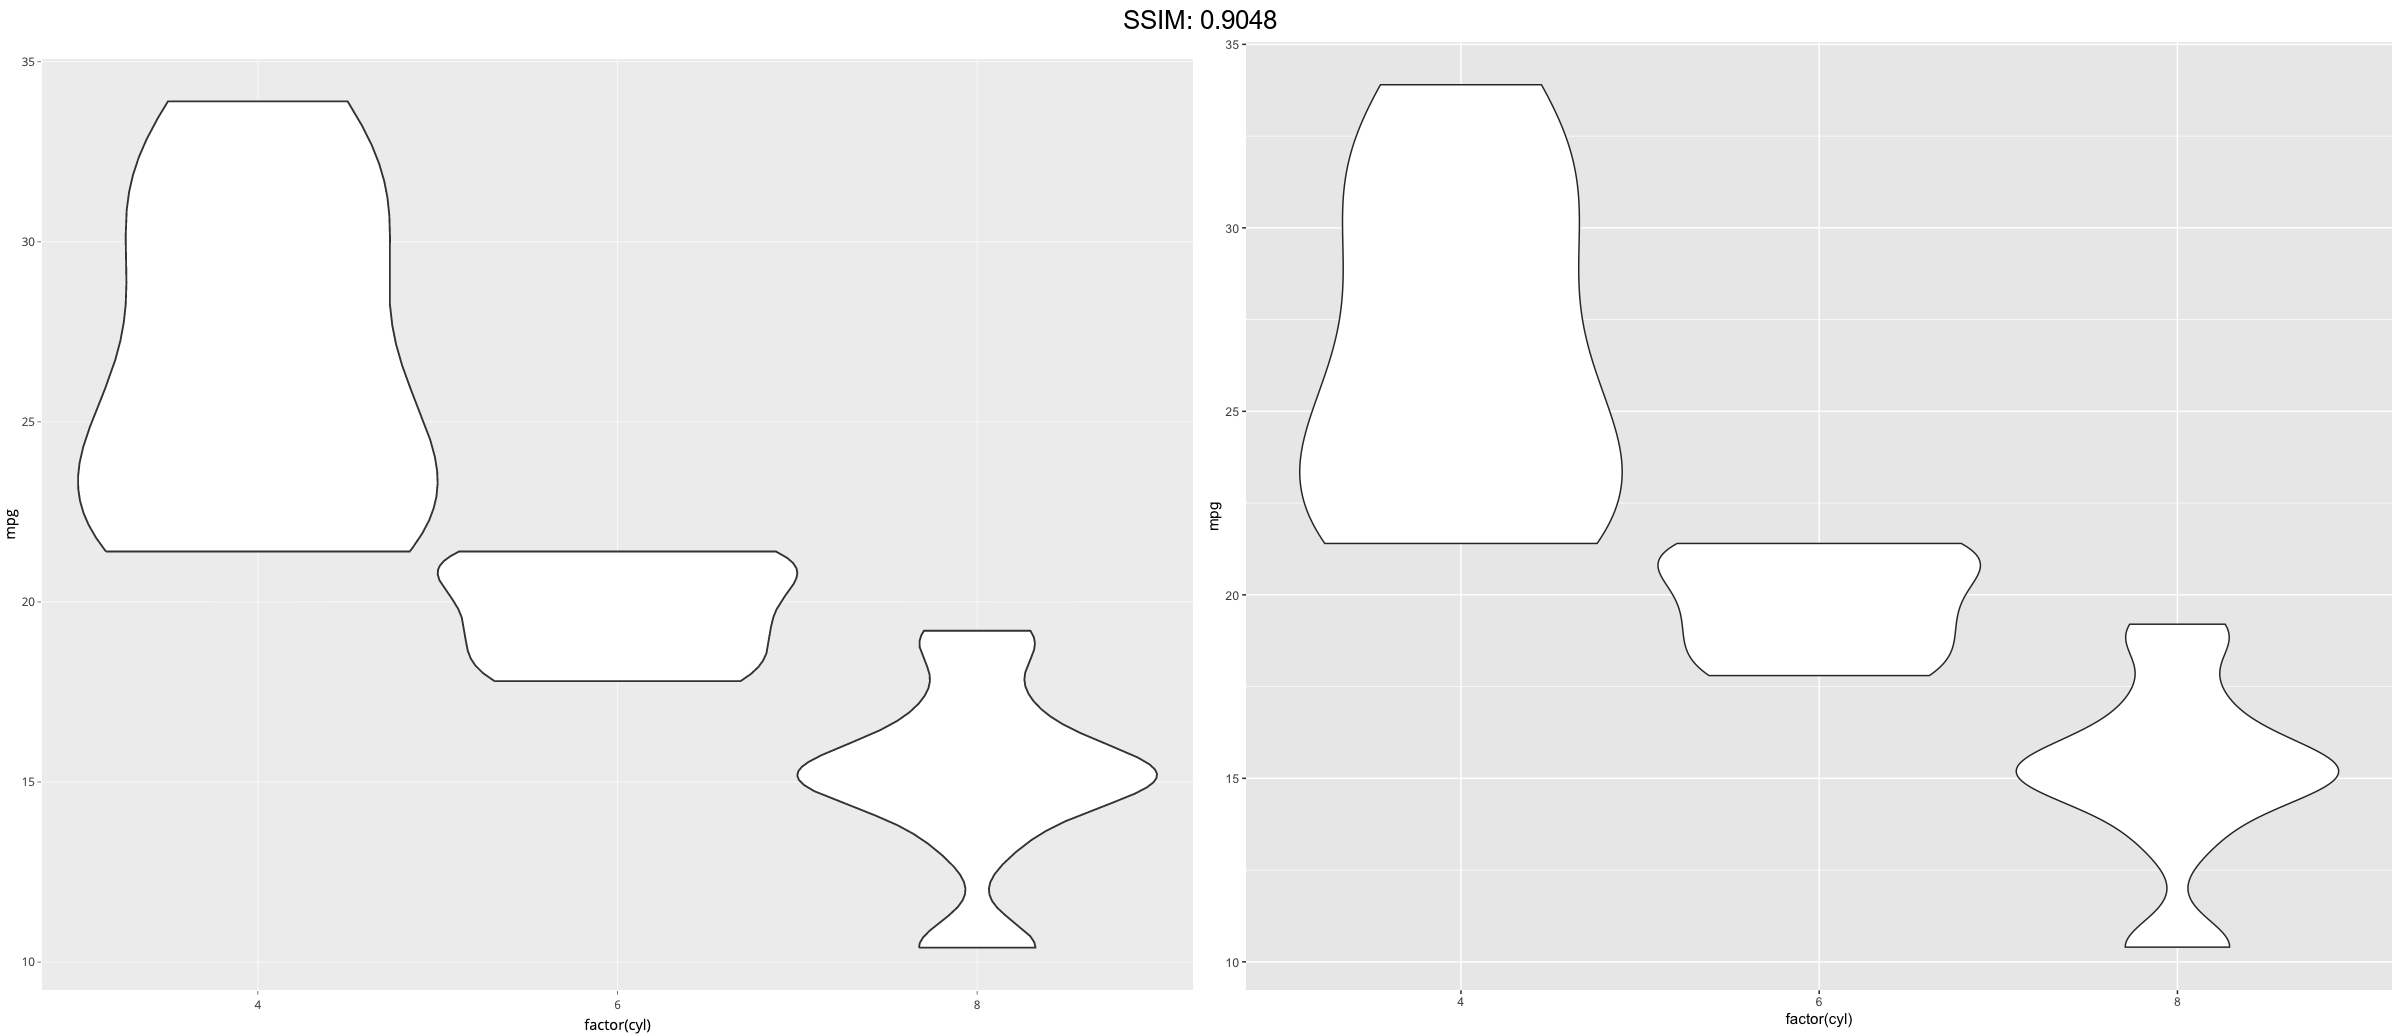

p <- ggplot(mtcars, aes(factor(cyl), mpg))
p <- p + geom_violin(trim = FALSE)
plotly::ggplotly(p)


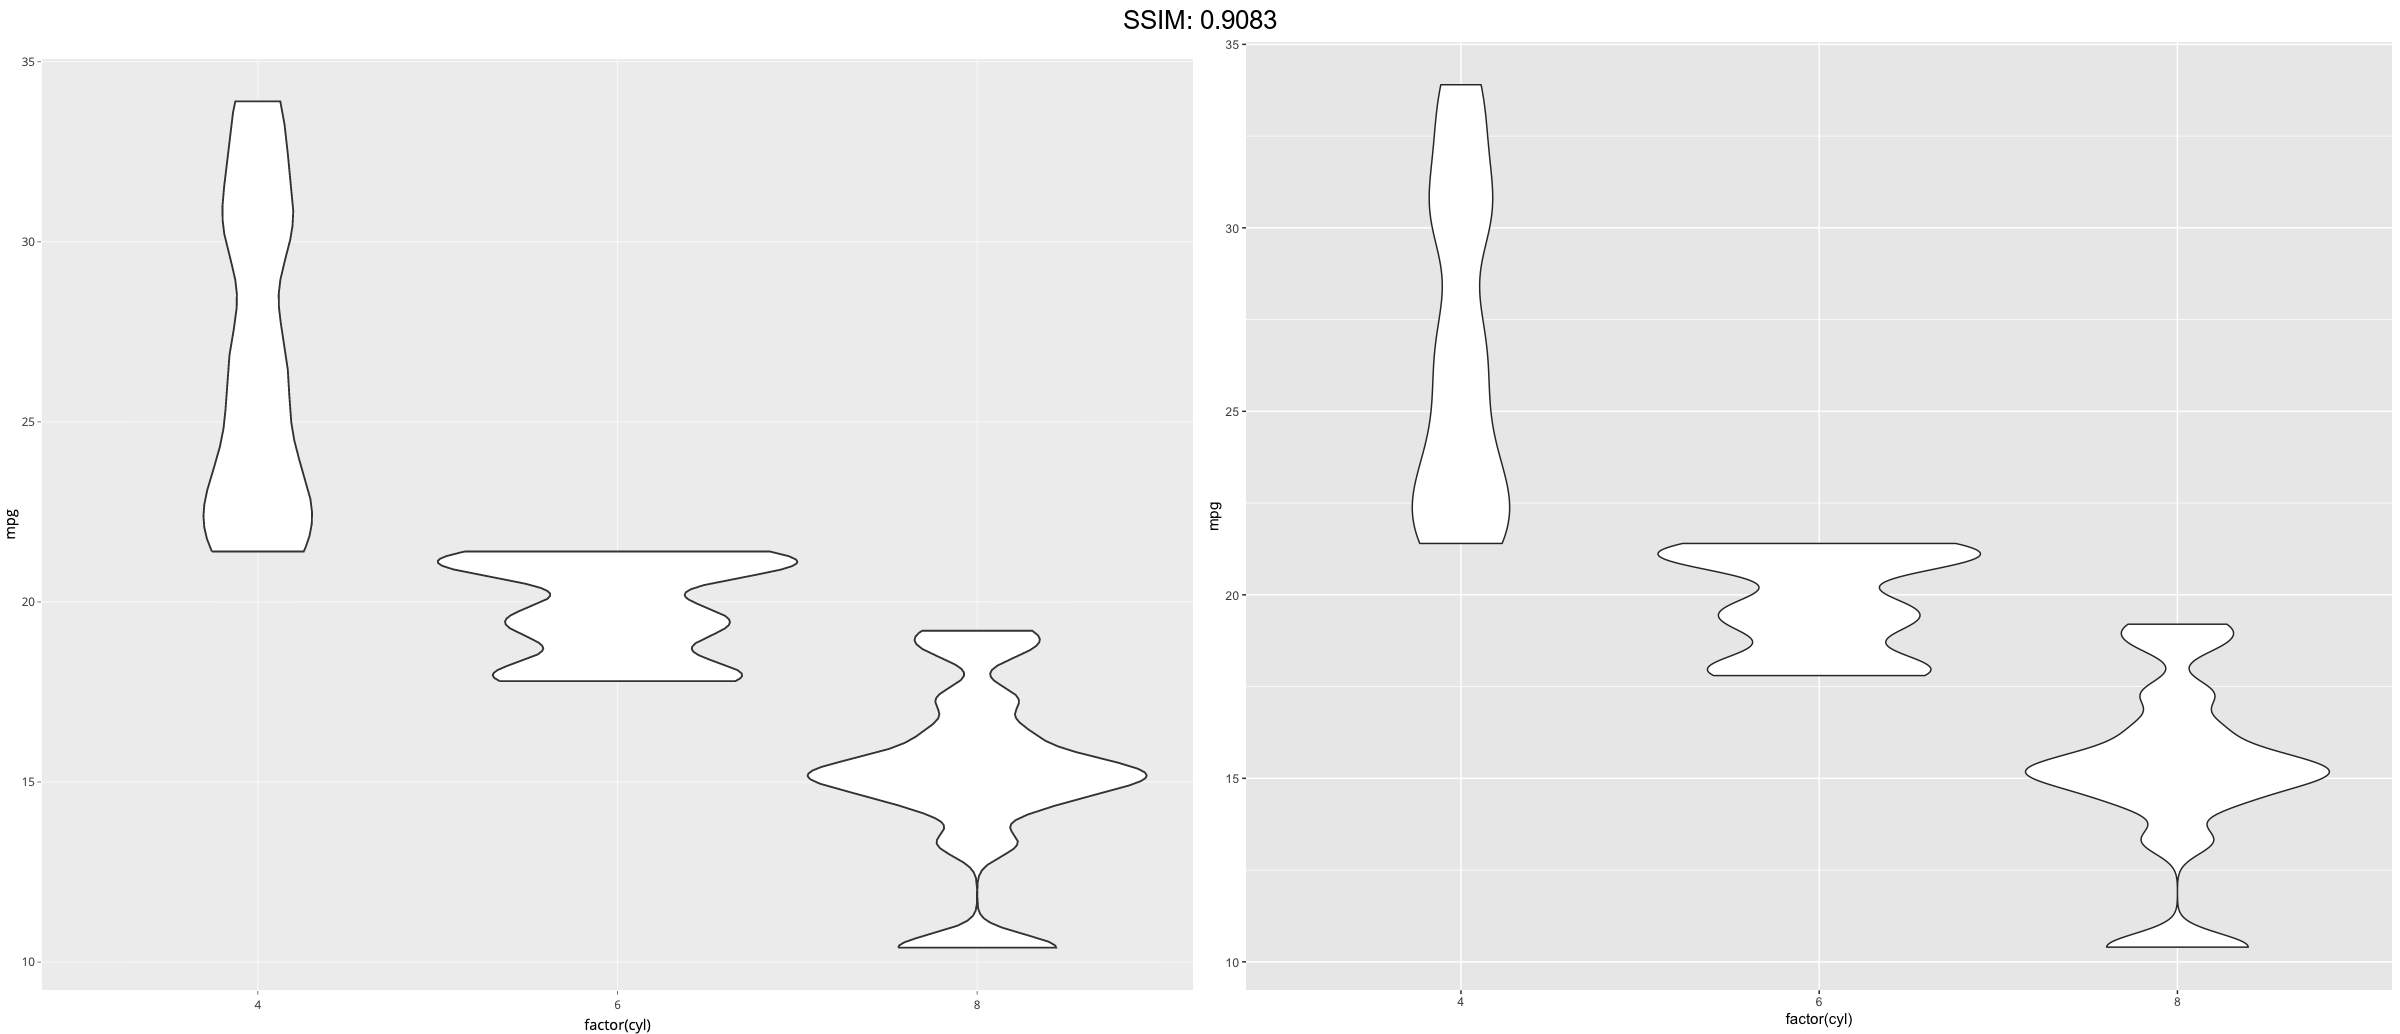
p <- ggplot(mtcars, aes(factor(cyl), mpg))
p <- p + geom_violin(adjust = .5)
plotly::ggplotly(p)


p <- ggplot(mtcars, aes(factor(cyl), mpg))
p <- p + geom_violin(aes(fill = cyl))
plotly::ggplotly(p)


p <- ggplot(mtcars, aes(factor(cyl), mpg))
p <- p + geom_violin(aes(fill = factor(cyl)))
plotly::ggplotly(p)


p <- ggplot(mtcars, aes(factor(cyl), mpg))
p <- p + geom_violin(aes(fill = factor(vs)))
plotly::ggplotly(p)
## Warning: Groups with fewer than two data points have been dropped.


p <- ggplot(mtcars, aes(factor(cyl), mpg))
p <- p + geom_violin(aes(fill = factor(am)))
plotly::ggplotly(p)


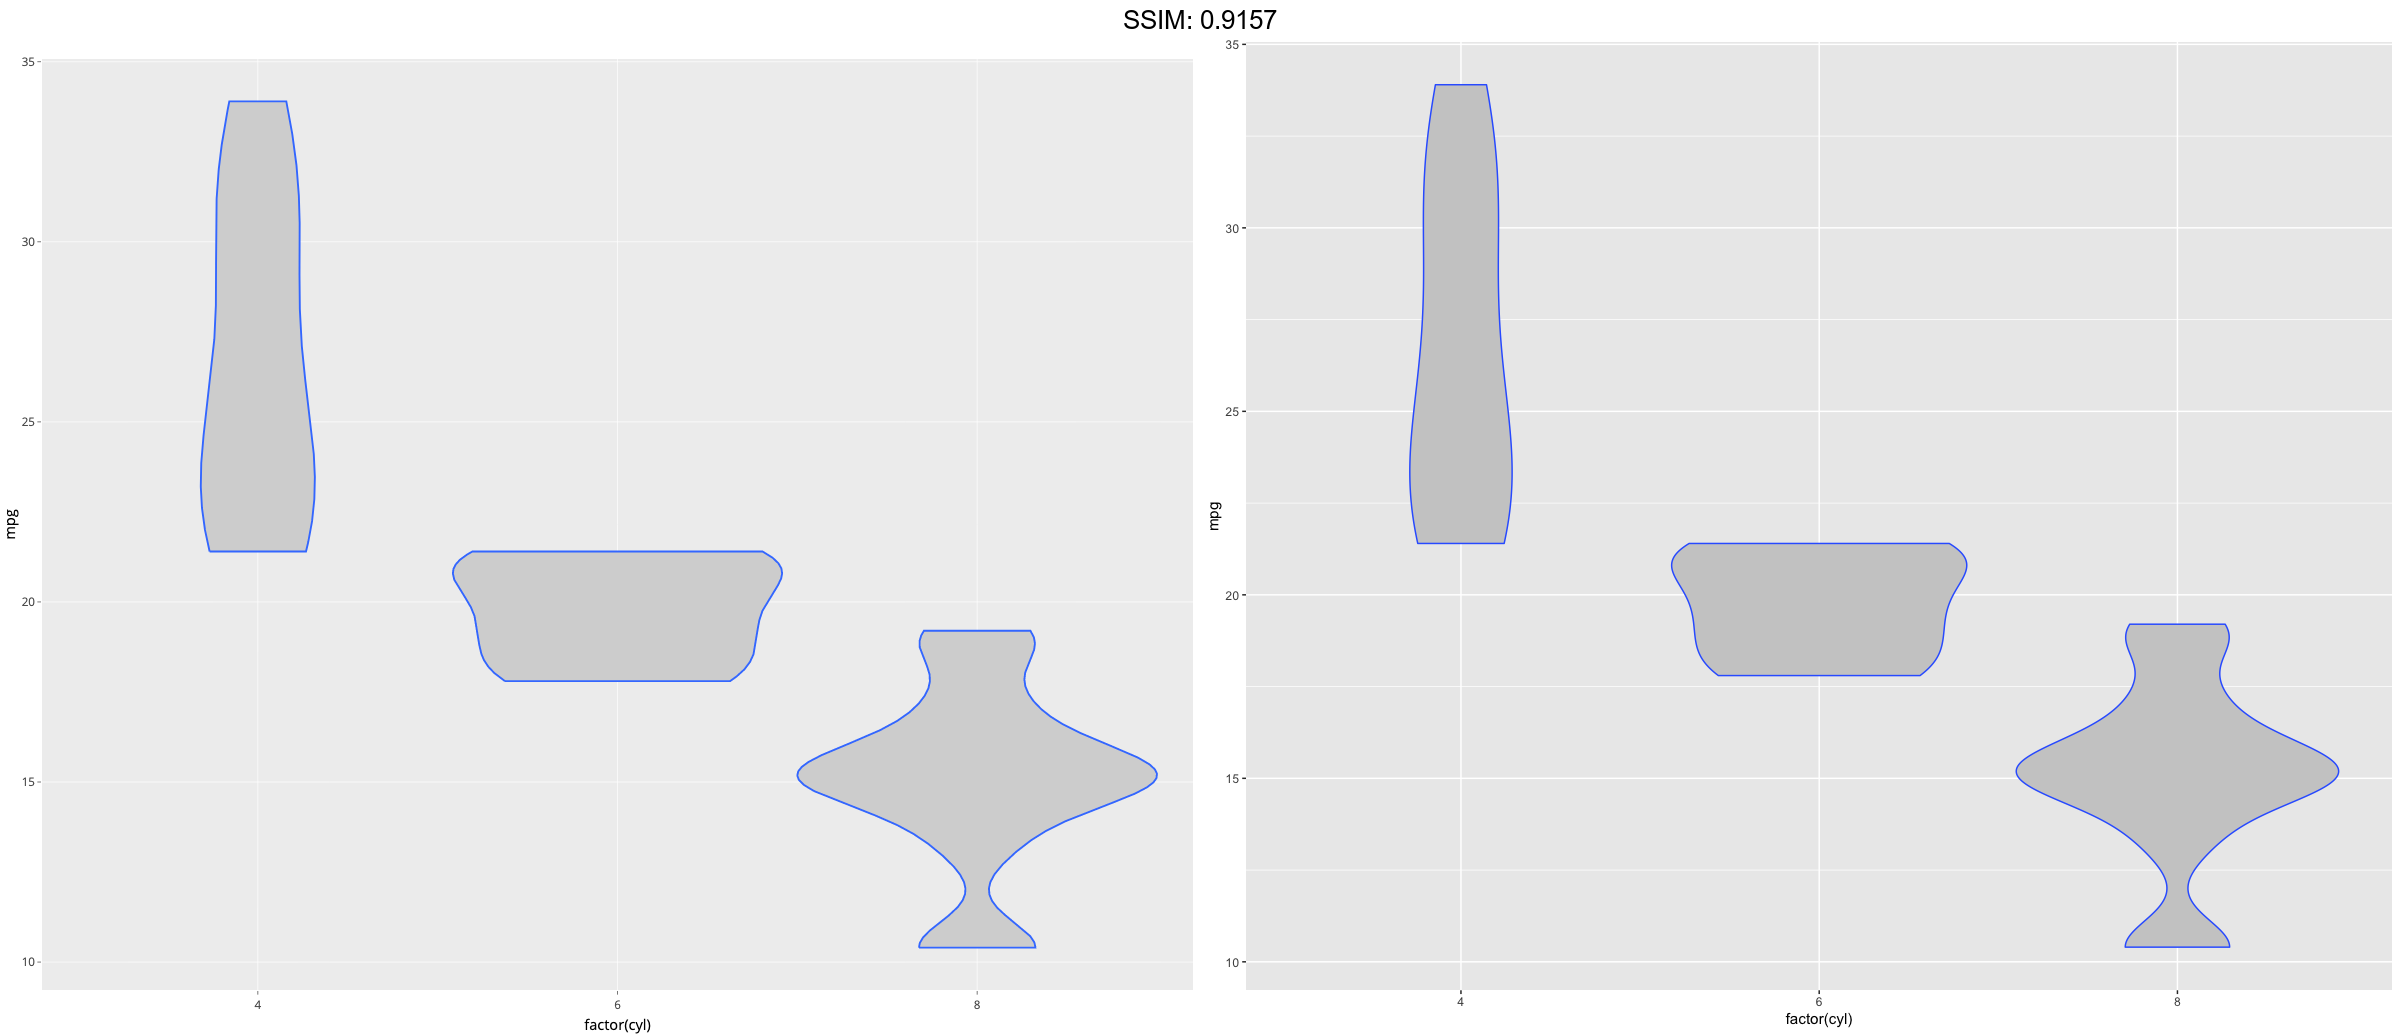
p <- ggplot(mtcars, aes(factor(cyl), mpg))
p <- p + geom_violin(fill = "grey80", colour = "#3366FF")
plotly::ggplotly(p)


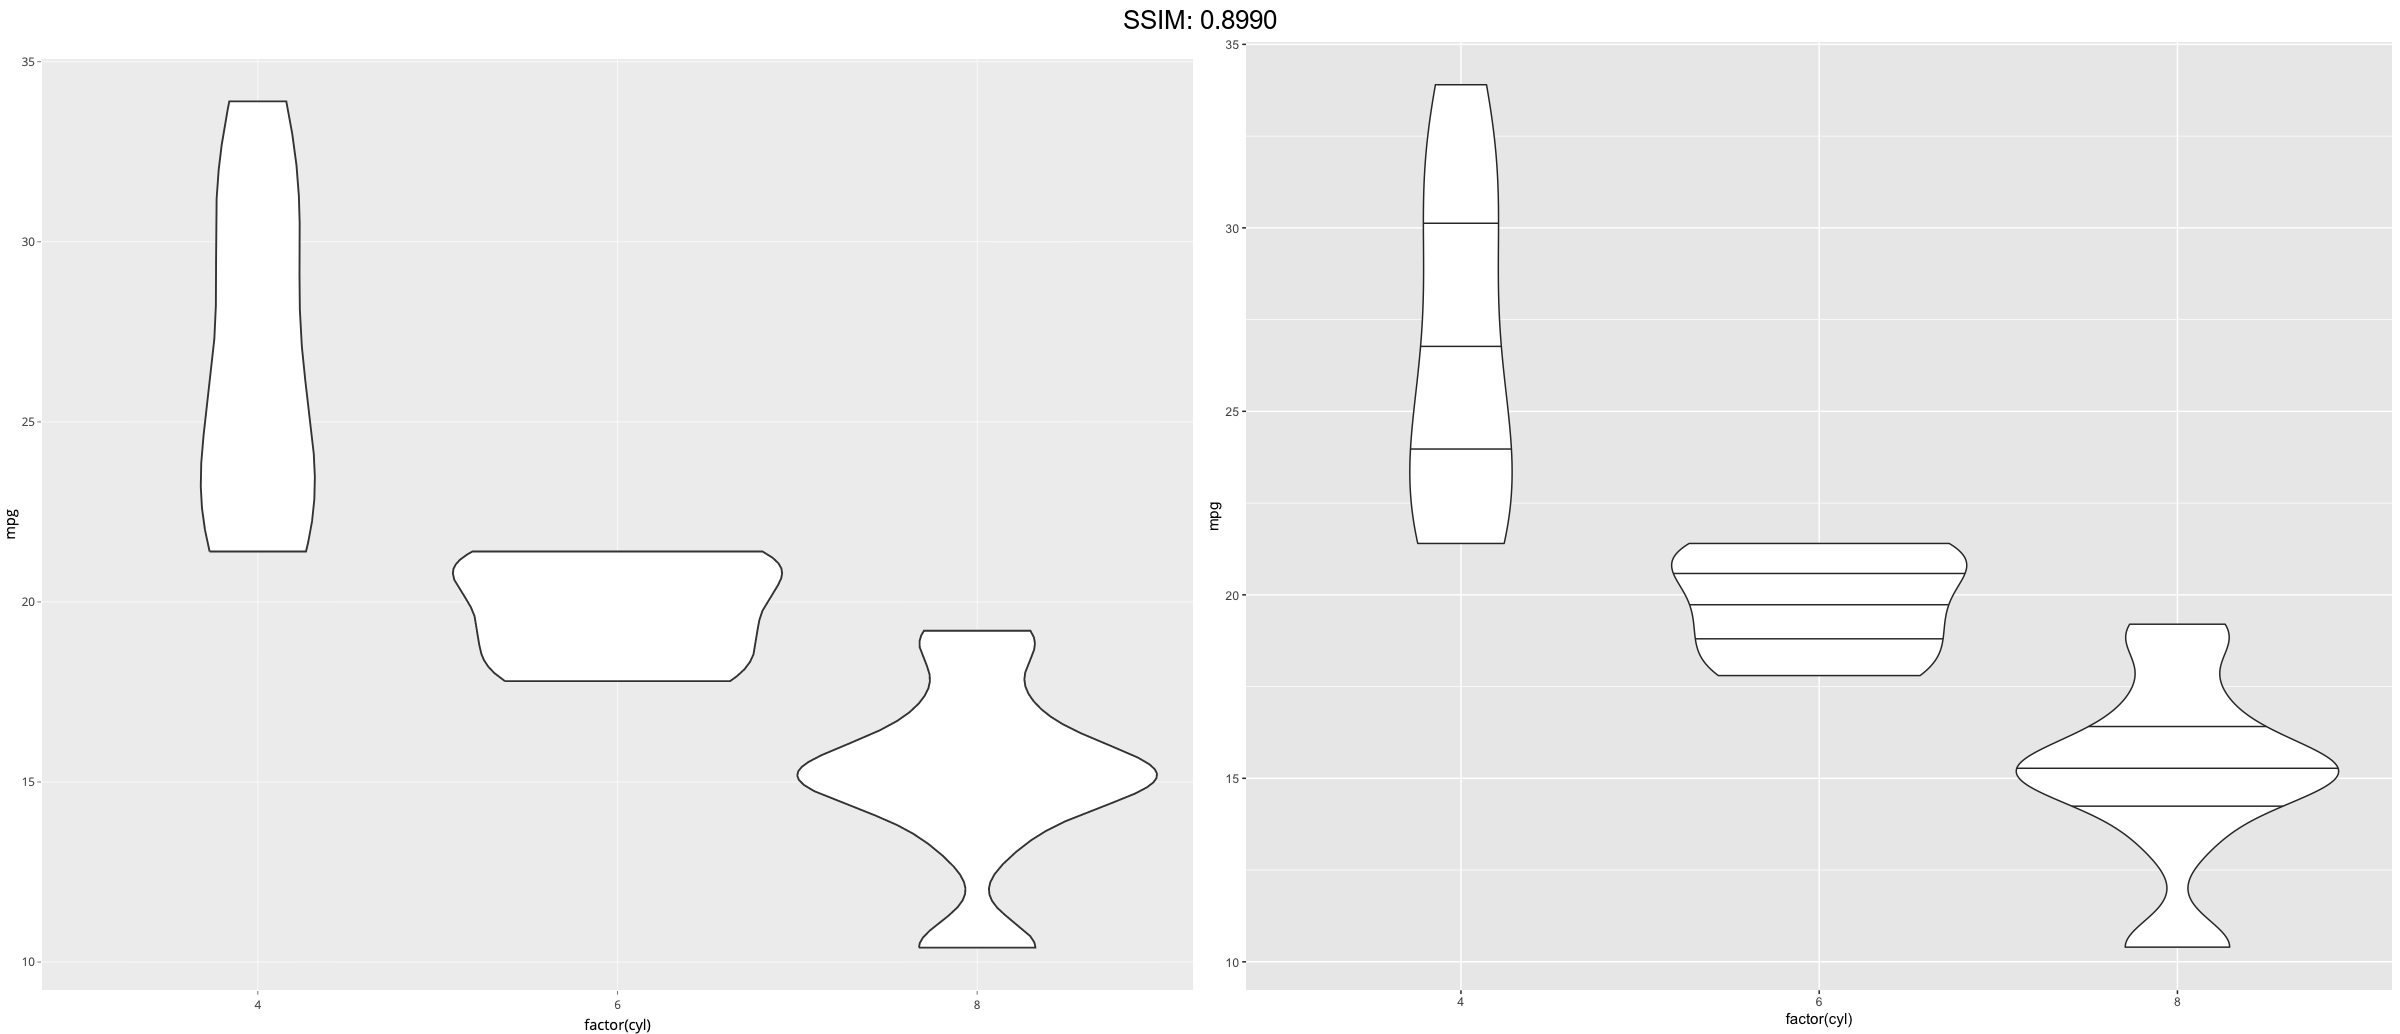
p <- ggplot(mtcars, aes(factor(cyl), mpg))
p <- p + geom_violin(draw_quantiles = c(0.25, 0.5, 0.75))
plotly::ggplotly(p)


p <-
 if (require("ggplot2movies")) {
# Scale transformations occur before the density statistics are computed.
# Coordinate transformations occur afterwards.  Observe the effect on the
# number of outliers.
m <- ggplot(movies, aes(y = votes, x = rating, group = cut_width(rating, 0.5)))
m + geom_violin()
m +
  geom_violin() +
  scale_y_log10()
m +
  geom_violin() +
  coord_trans(y = "log10")
m +
  geom_violin() +
  scale_y_log10() + coord_trans(y = "log10")

# Violin plots with continuous x:
# Use the group aesthetic to group observations in violins
ggplot(movies, aes(year, budget)) +
  geom_violin()
ggplot(movies, aes(year, budget)) +
  geom_violin(aes(group = cut_width(year, 10)), scale = "width")
}
plotly::ggplotly(p)


