GGPLOT - geom_text
Labeling plots and then convert them with ggplotly
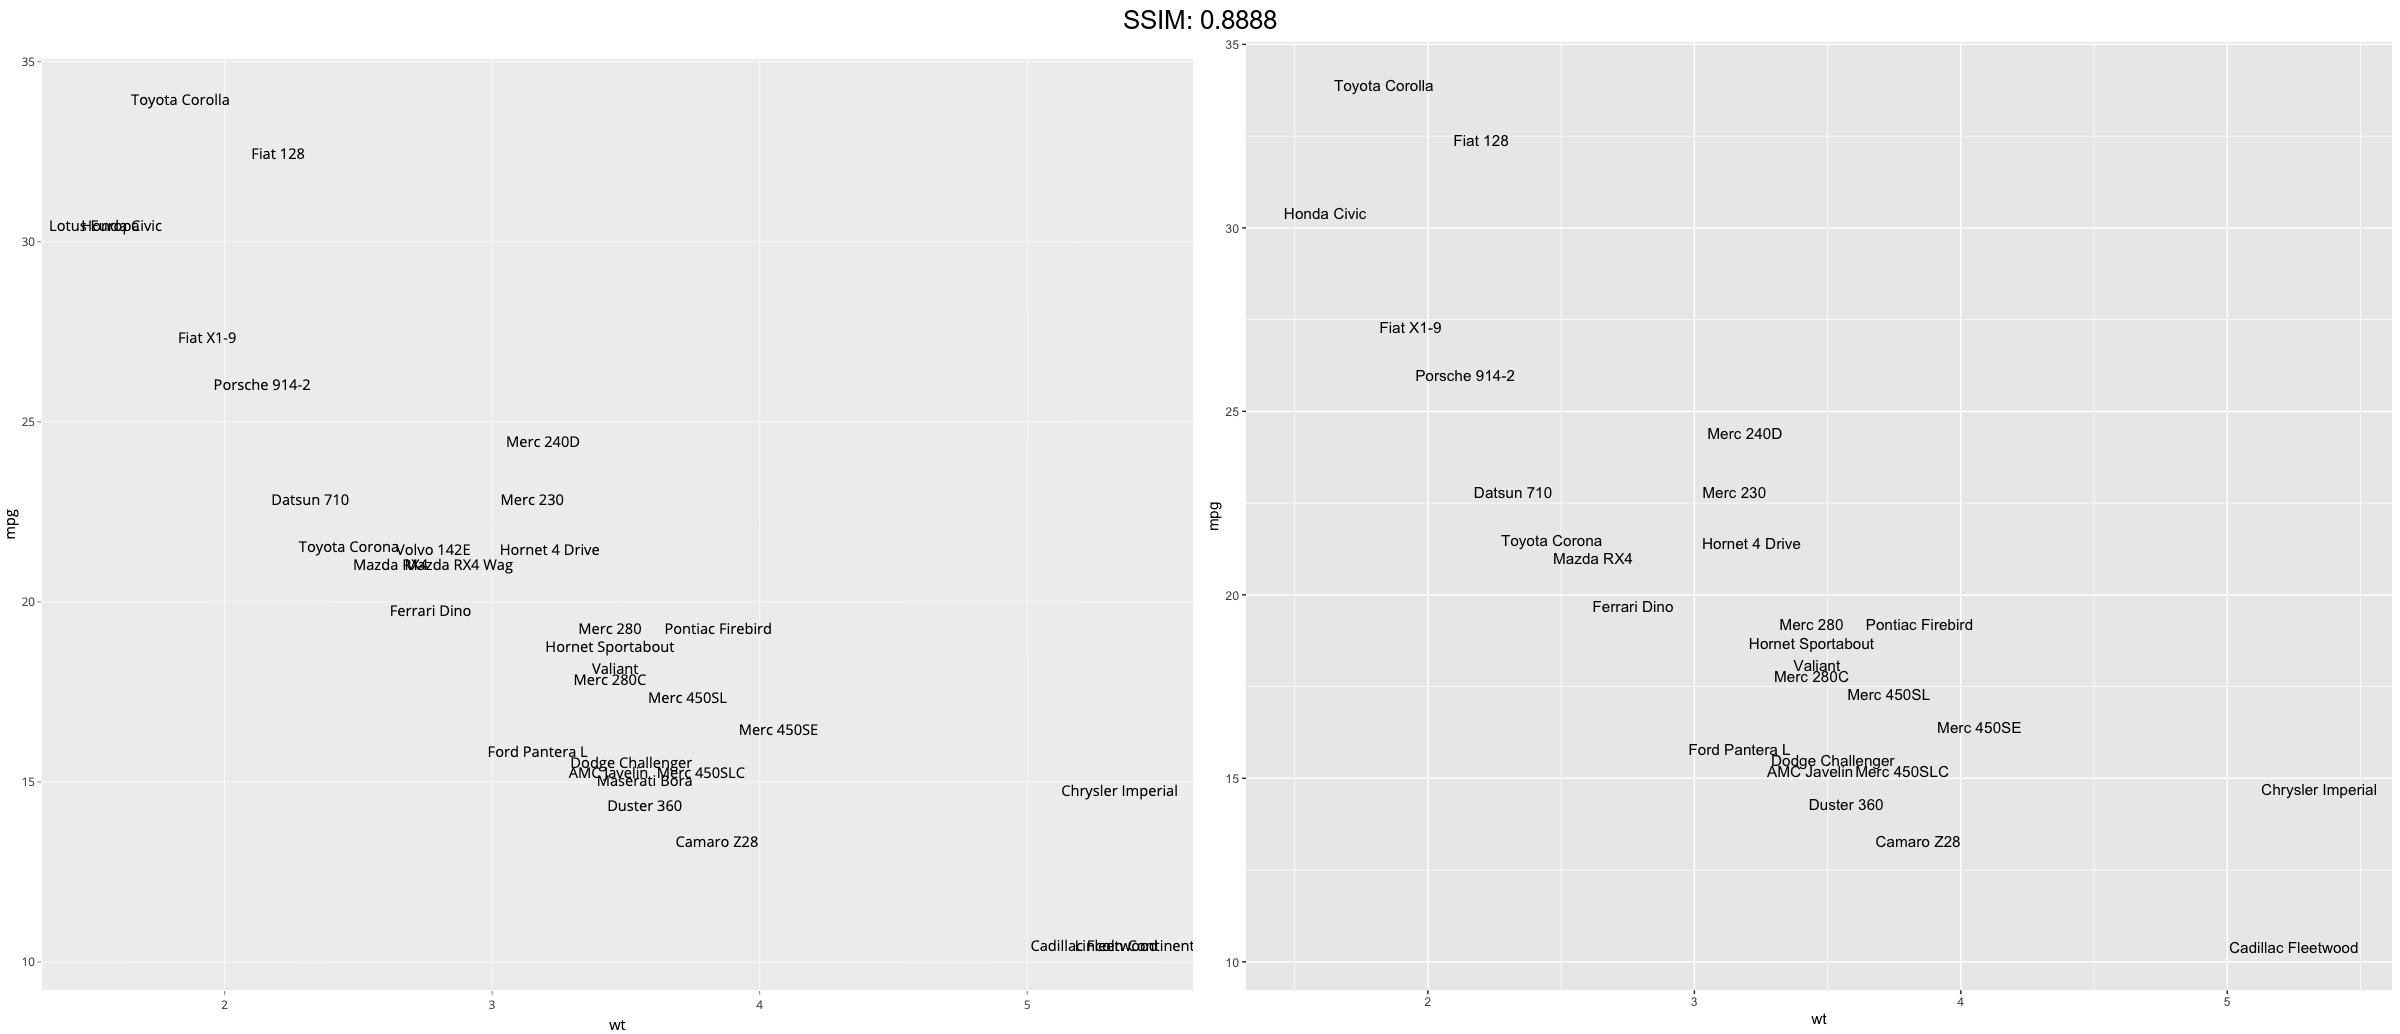
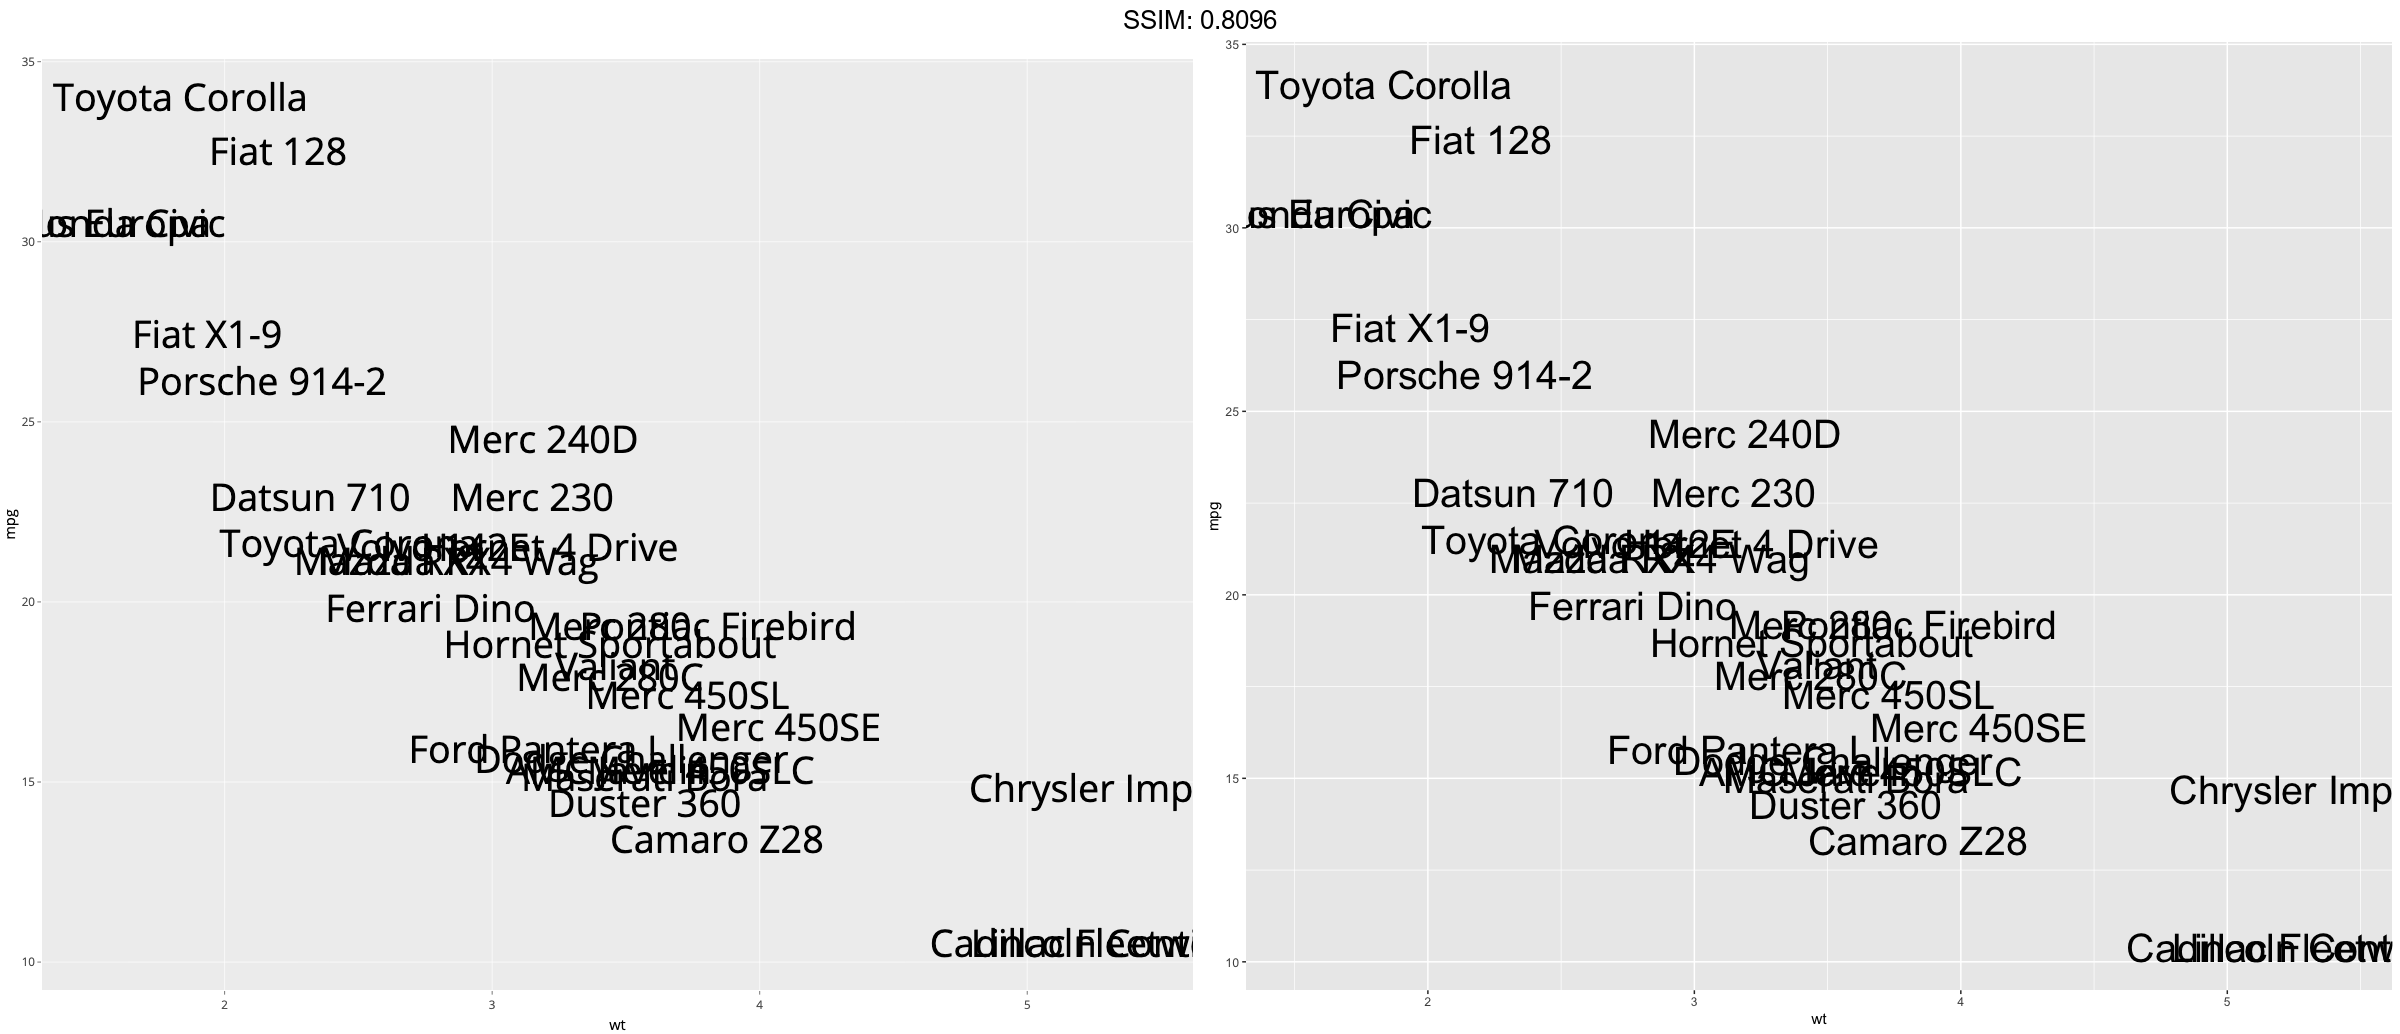
p <- ggplot(mtcars, aes(wt, mpg, label = rownames(mtcars)))
p <- p + geom_text()
plotly::ggplotly(p)


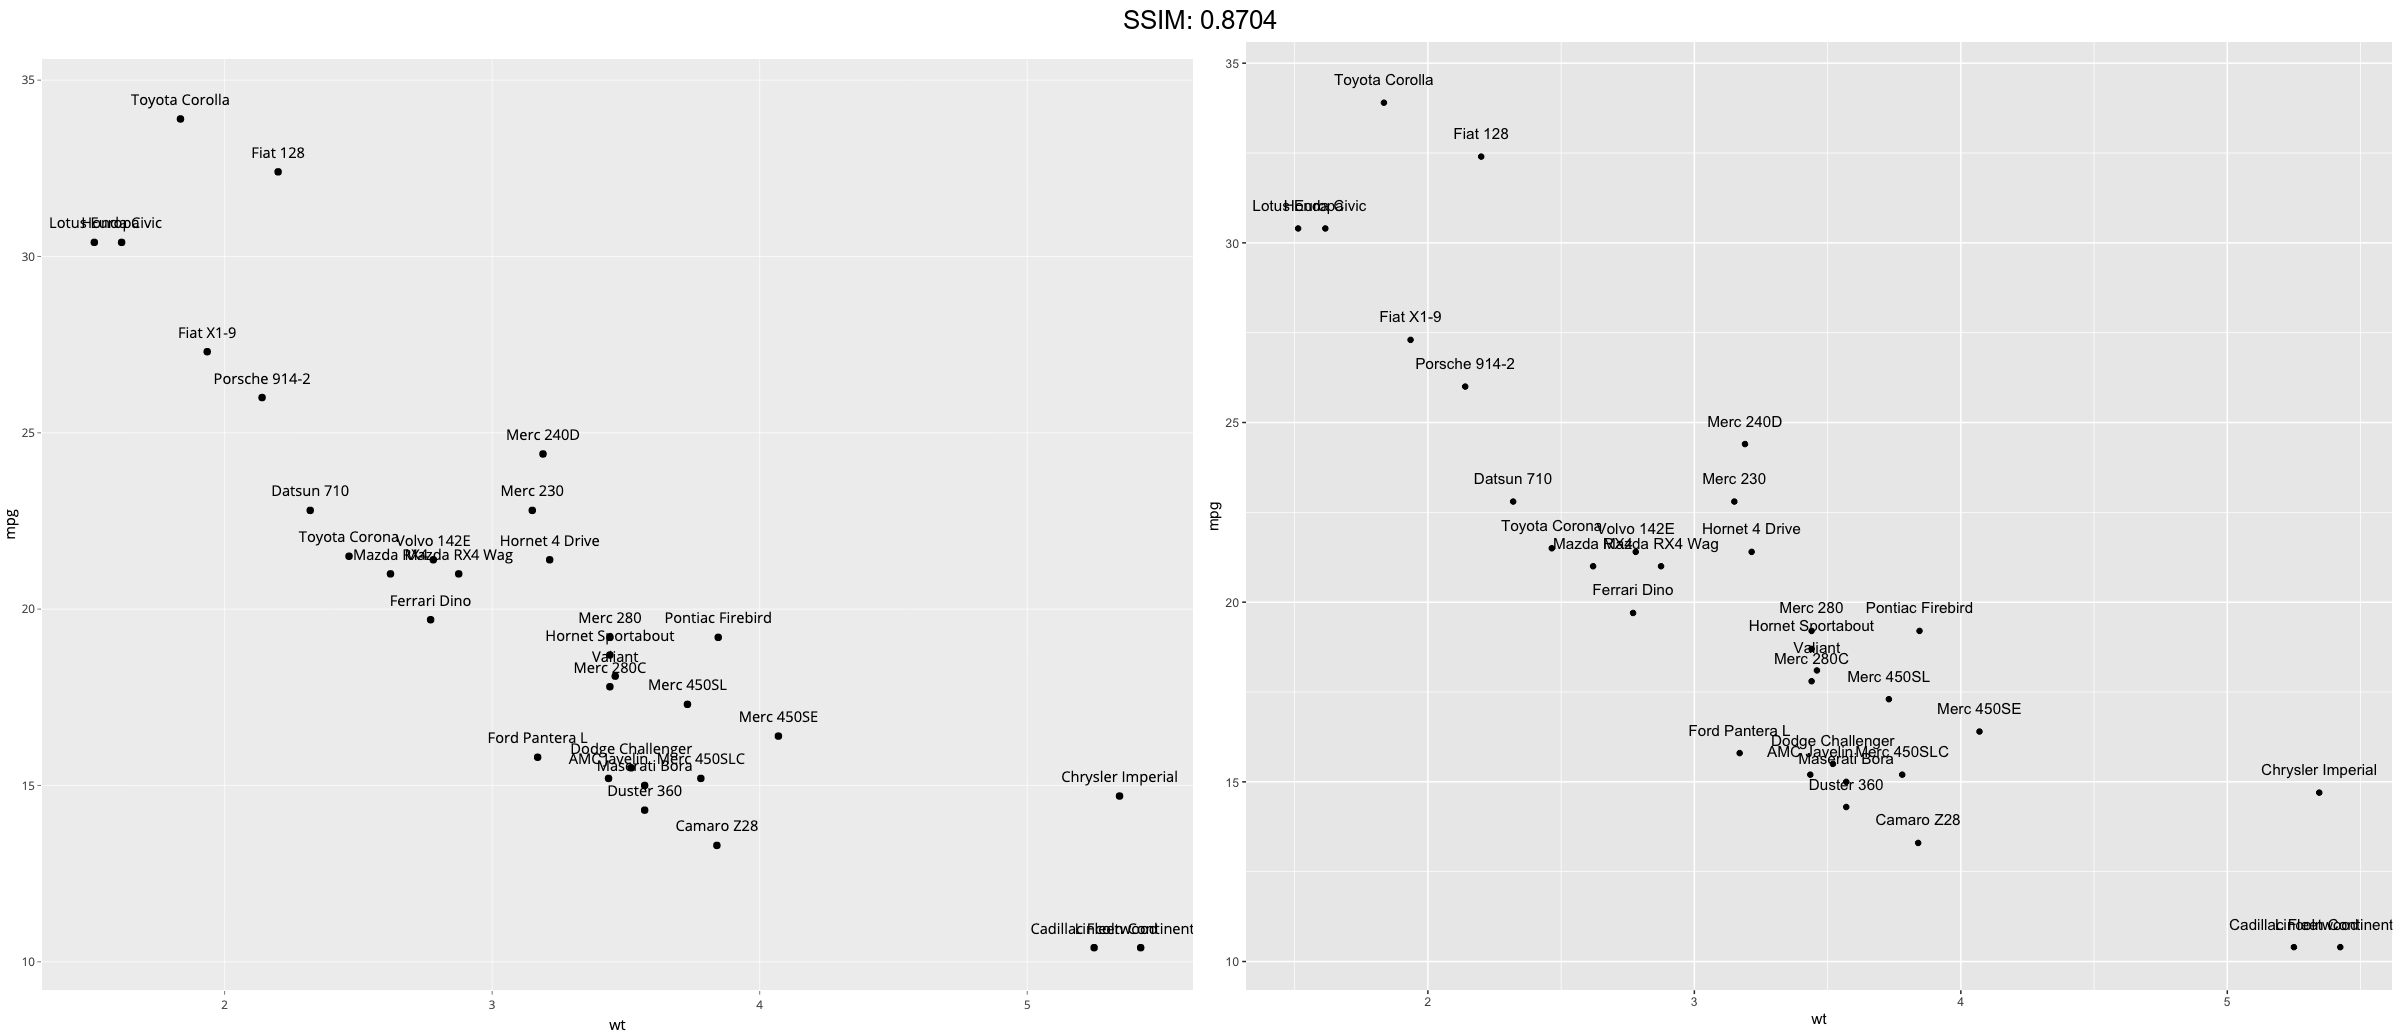
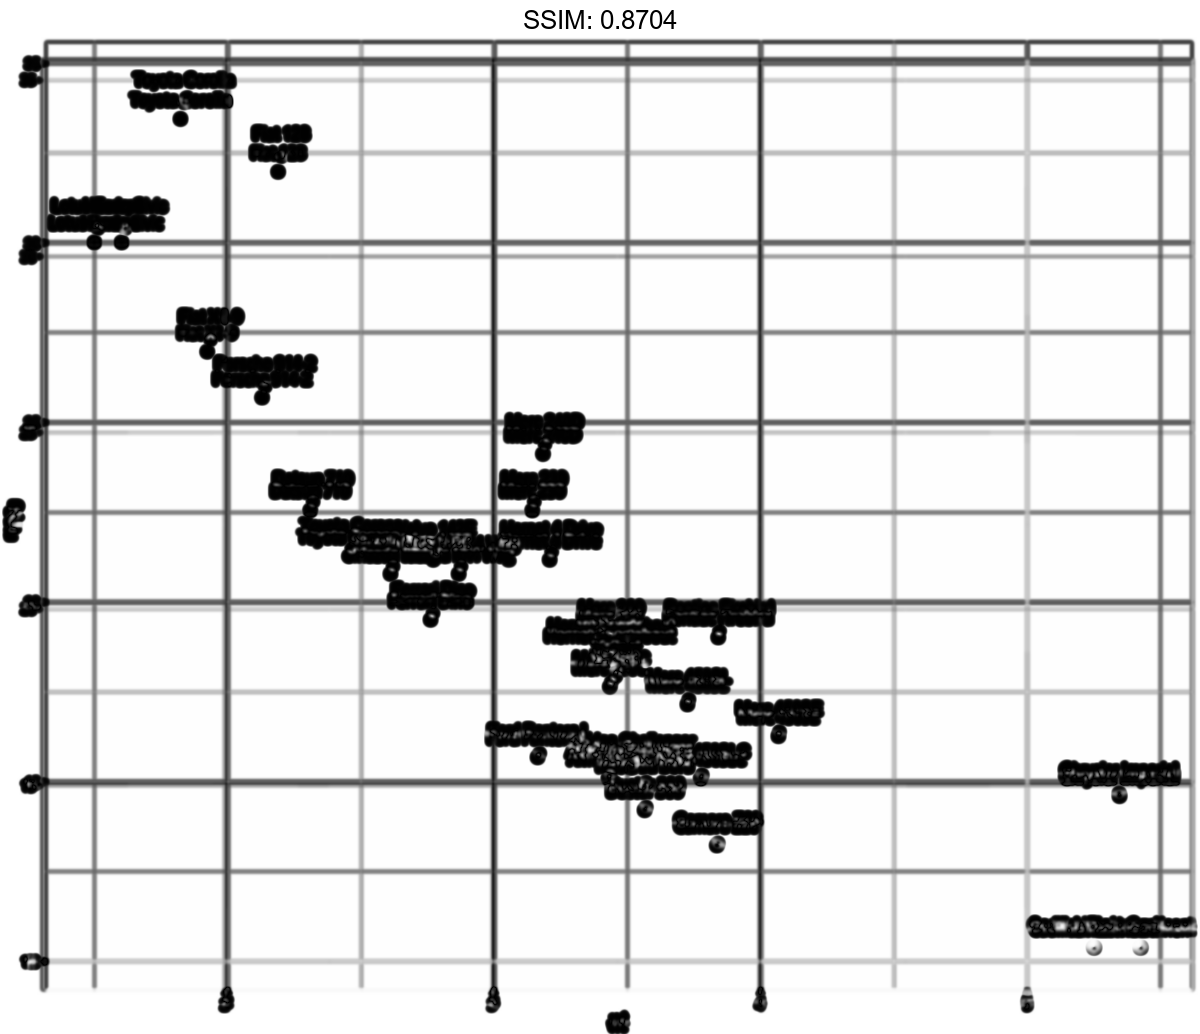
p <- ggplot(mtcars, aes(wt, mpg, label = rownames(mtcars)))
p <- p + geom_text(check_overlap = TRUE)
plotly::ggplotly(p)
p <- ggplot(mtcars, aes(wt, mpg, label = rownames(mtcars)))
p <- p + geom_label()
plotly::ggplotly(p)
## Warning in geom2trace.default(dots[[1L]][[1L]], dots[[2L]][[1L]], dots[[3L]][[1L]]): geom_GeomLabel() has yet to be implemented in plotly.
##   If you'd like to see this geom implemented,
##   Please open an issue with your example code at
##   https://github.com/ropensci/plotly/issues


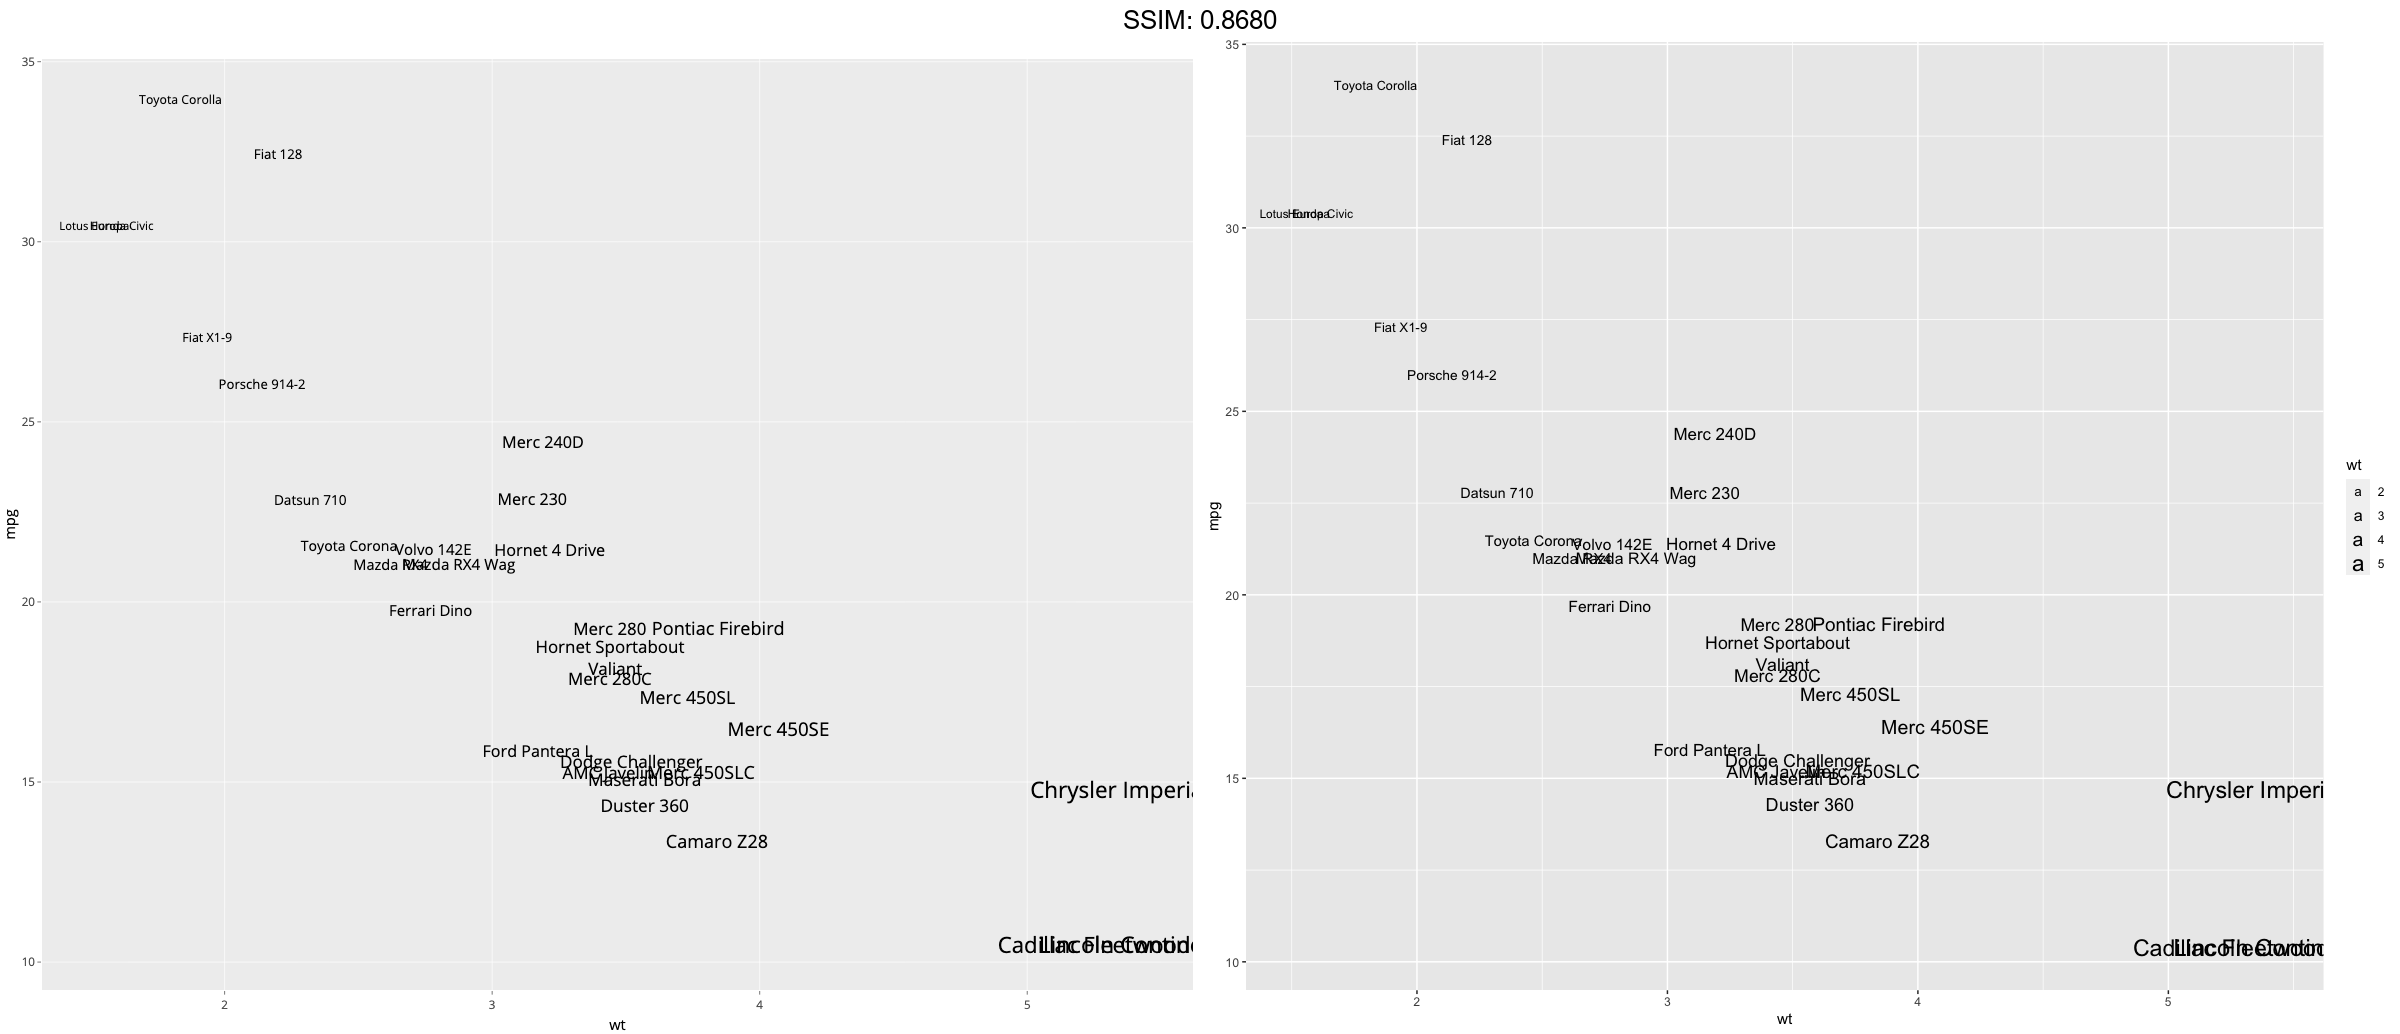
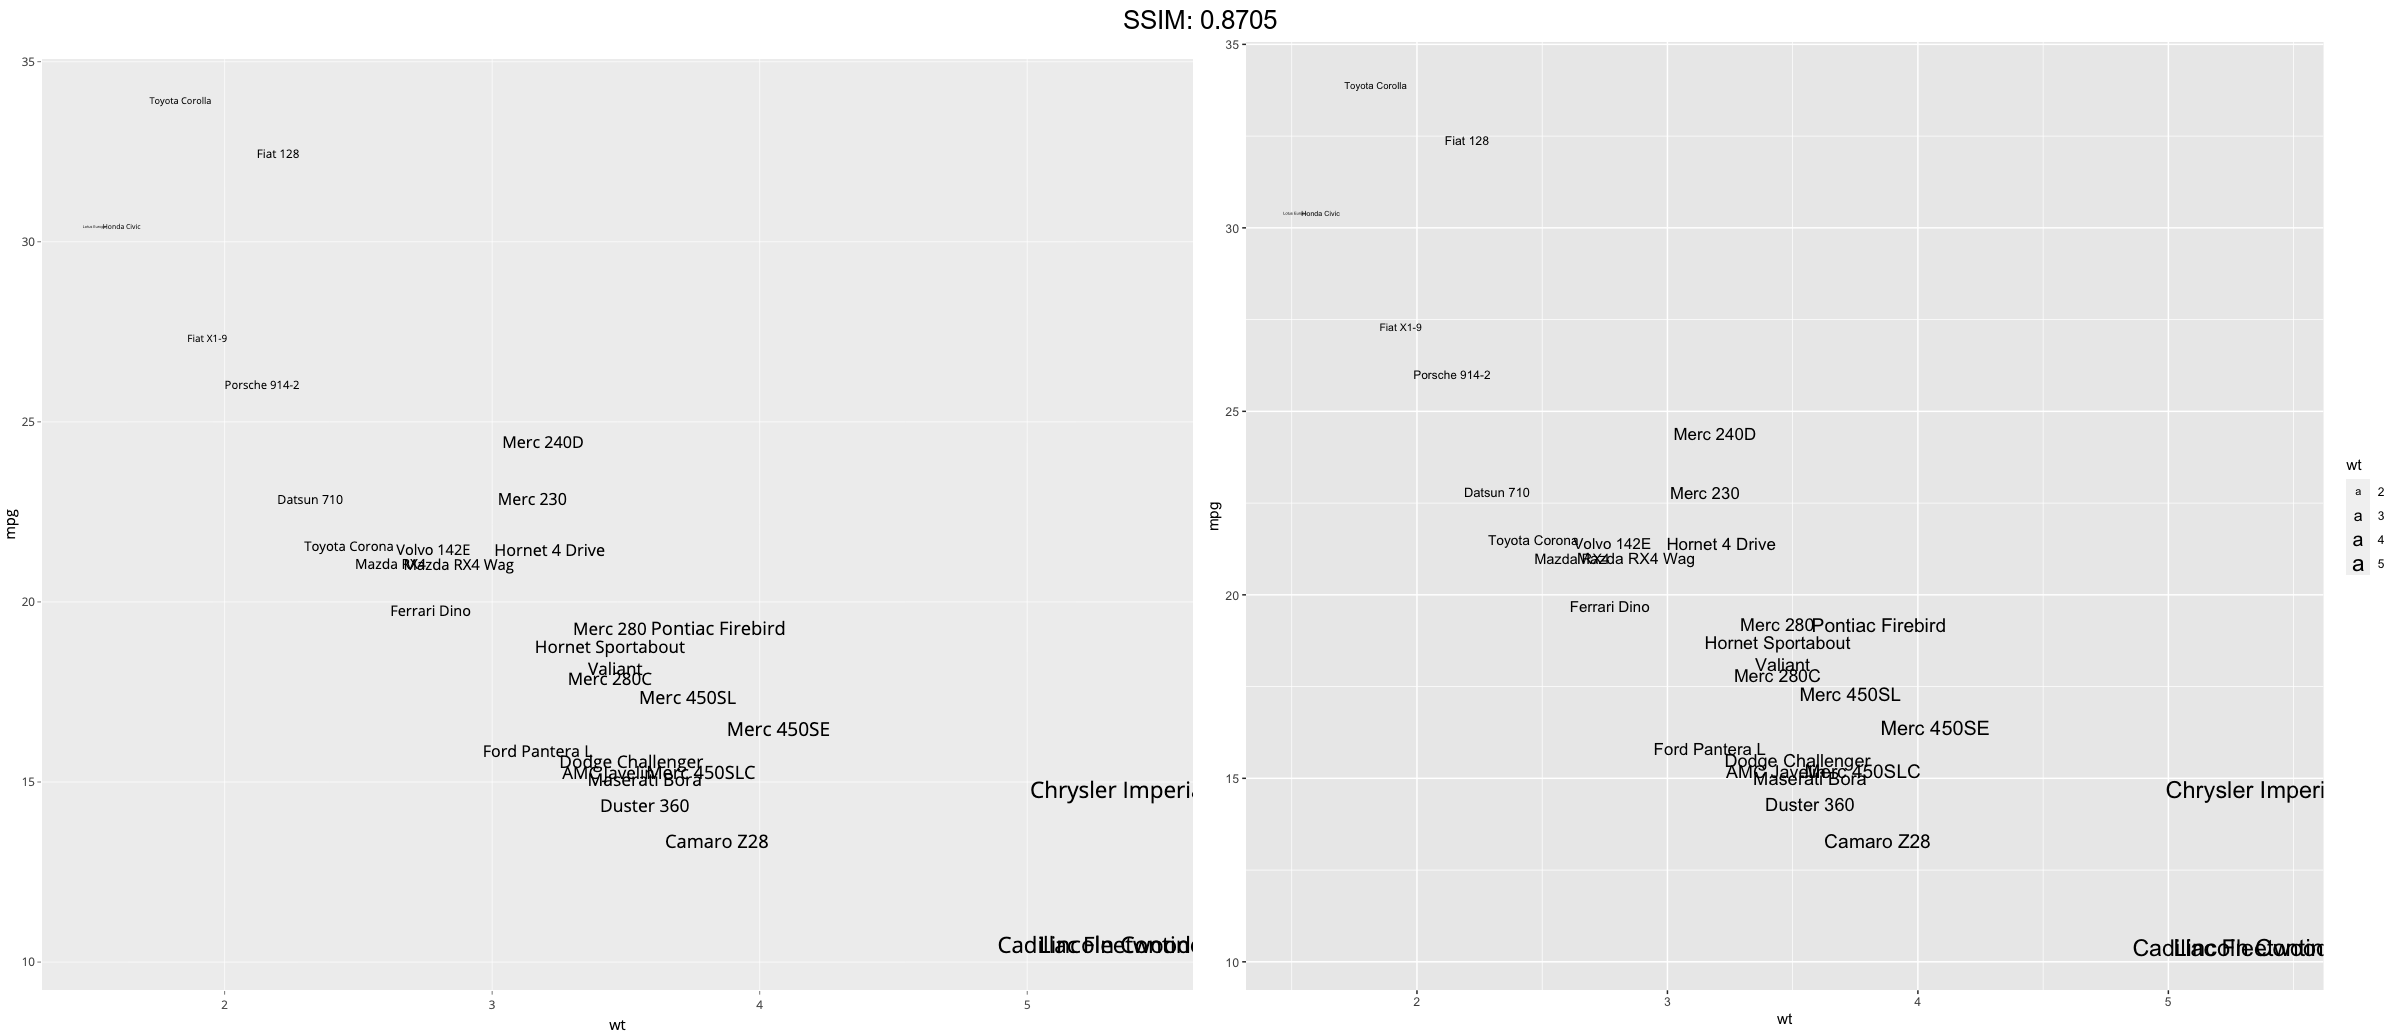
p <- ggplot(mtcars, aes(wt, mpg, label = rownames(mtcars)))
p <- p + geom_text(size = 10)
plotly::ggplotly(p)
p <- ggplot(mtcars, aes(wt, mpg, label = rownames(mtcars)))
p <-
 p +
  geom_point() +
  geom_text(hjust = 0, nudge_x = 0.05)
plotly::ggplotly(p)

p <- ggplot(mtcars, aes(wt, mpg, label = rownames(mtcars)))
p <-
 p +
  geom_point() +
  geom_text(vjust = 0, nudge_y = 0.5)
plotly::ggplotly(p)
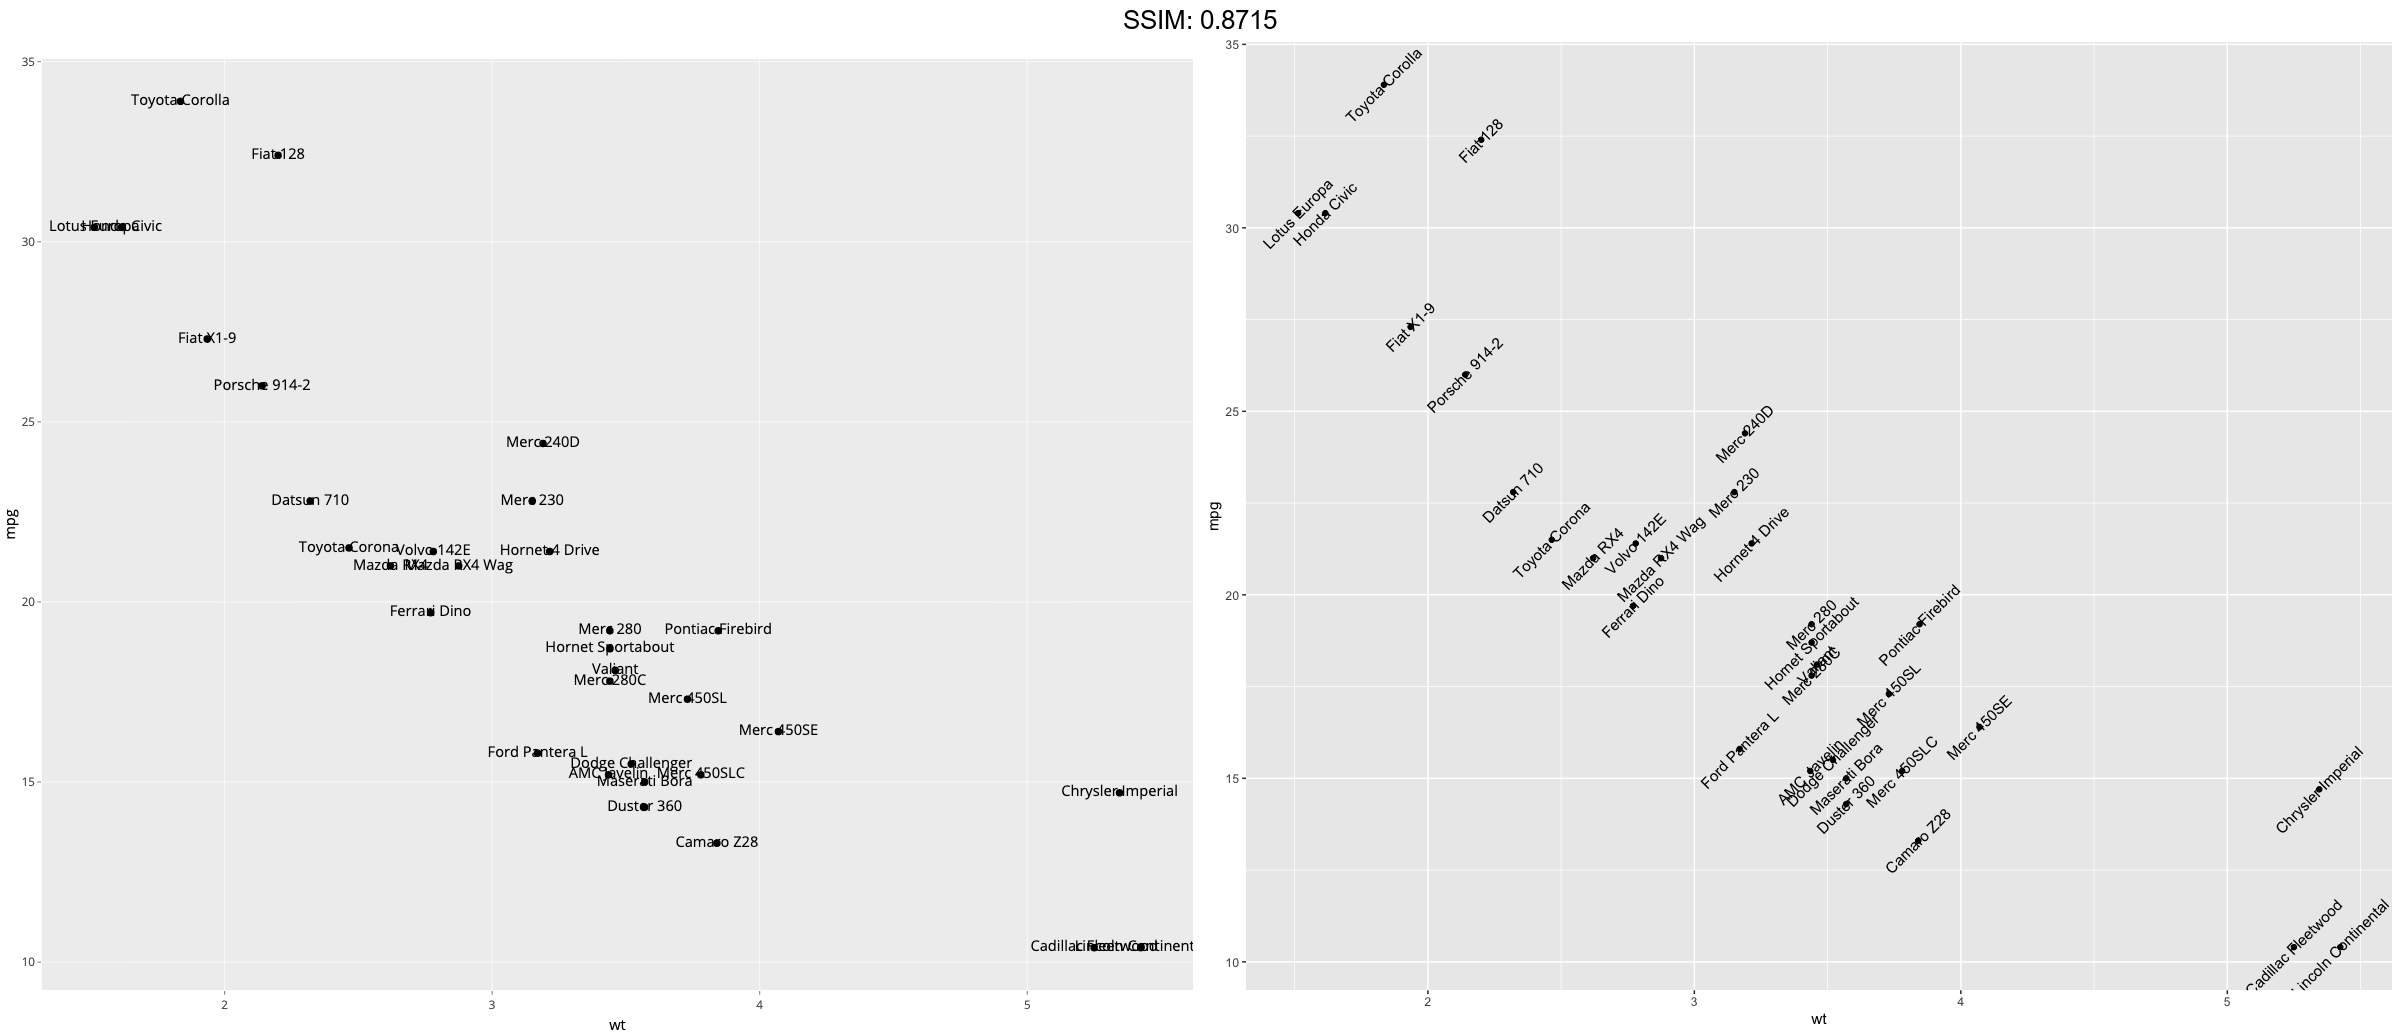
p <- ggplot(mtcars, aes(wt, mpg, label = rownames(mtcars)))
p <-
 p +
  geom_point() +
  geom_text(angle = 45)
plotly::ggplotly(p)
p <- ggplot(mtcars, aes(wt, mpg, label = rownames(mtcars)))
p <-
 if (FALSE) {
# Doesn't work on all systems
p +
  geom_text(family = "Times New Roman")
}
plotly::ggplotly(p)
## Error in UseMethod("api_create"): no applicable method for 'api_create' applied to an object of class "shiny.tag"
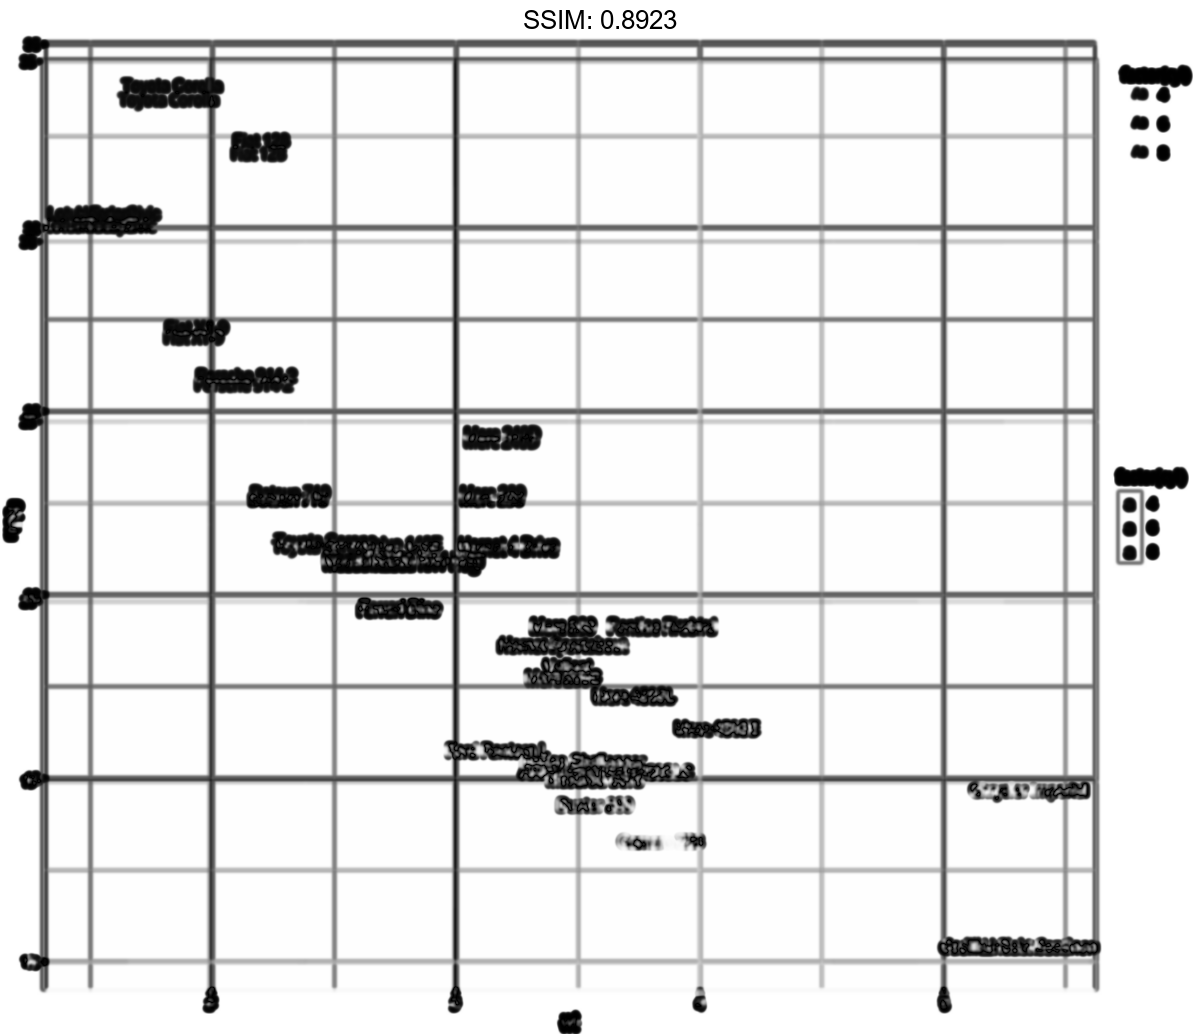
p <- ggplot(mtcars, aes(wt, mpg, label = rownames(mtcars)))
p <- p + geom_text(aes(colour = factor(cyl)))
plotly::ggplotly(p)

p <- ggplot(mtcars, aes(wt, mpg, label = rownames(mtcars)))
p <-
 p + geom_text(aes(colour = factor(cyl))) +
  scale_colour_discrete(l = 40)
plotly::ggplotly(p)
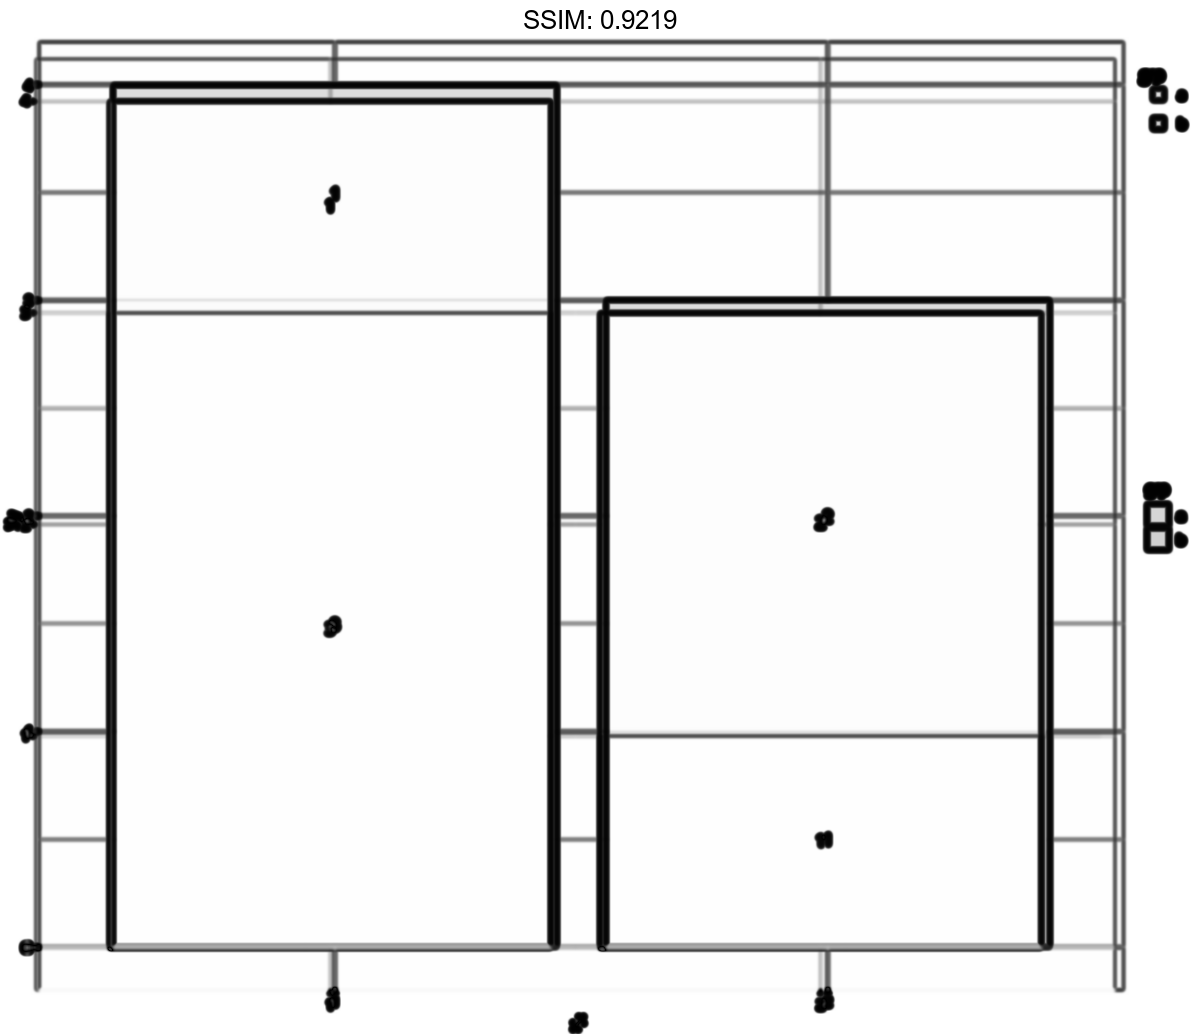
p <- ggplot(mtcars, aes(wt, mpg, label = rownames(mtcars)))
p <- p + geom_label(aes(fill = factor(cyl)), colour = "white", fontface = "bold")
plotly::ggplotly(p)
## Warning in geom2trace.default(dots[[1L]][[3L]], dots[[2L]][[1L]], dots[[3L]][[1L]]): geom_GeomLabel() has yet to be implemented in plotly.
##   If you'd like to see this geom implemented,
##   Please open an issue with your example code at
##   https://github.com/ropensci/plotly/issues

## Warning in geom2trace.default(dots[[1L]][[3L]], dots[[2L]][[1L]], dots[[3L]][[1L]]): geom_GeomLabel() has yet to be implemented in plotly.
##   If you'd like to see this geom implemented,
##   Please open an issue with your example code at
##   https://github.com/ropensci/plotly/issues

## Warning in geom2trace.default(dots[[1L]][[3L]], dots[[2L]][[1L]], dots[[3L]][[1L]]): geom_GeomLabel() has yet to be implemented in plotly.
##   If you'd like to see this geom implemented,
##   Please open an issue with your example code at
##   https://github.com/ropensci/plotly/issues


p <- ggplot(mtcars, aes(wt, mpg, label = rownames(mtcars)))
p <- p + geom_text(aes(size = wt))
plotly::ggplotly(p)
p <- ggplot(mtcars, aes(wt, mpg, label = rownames(mtcars)))
p <-
 p +
  geom_text(aes(size = wt)) +
  scale_radius(range = c(3,6))
plotly::ggplotly(p)


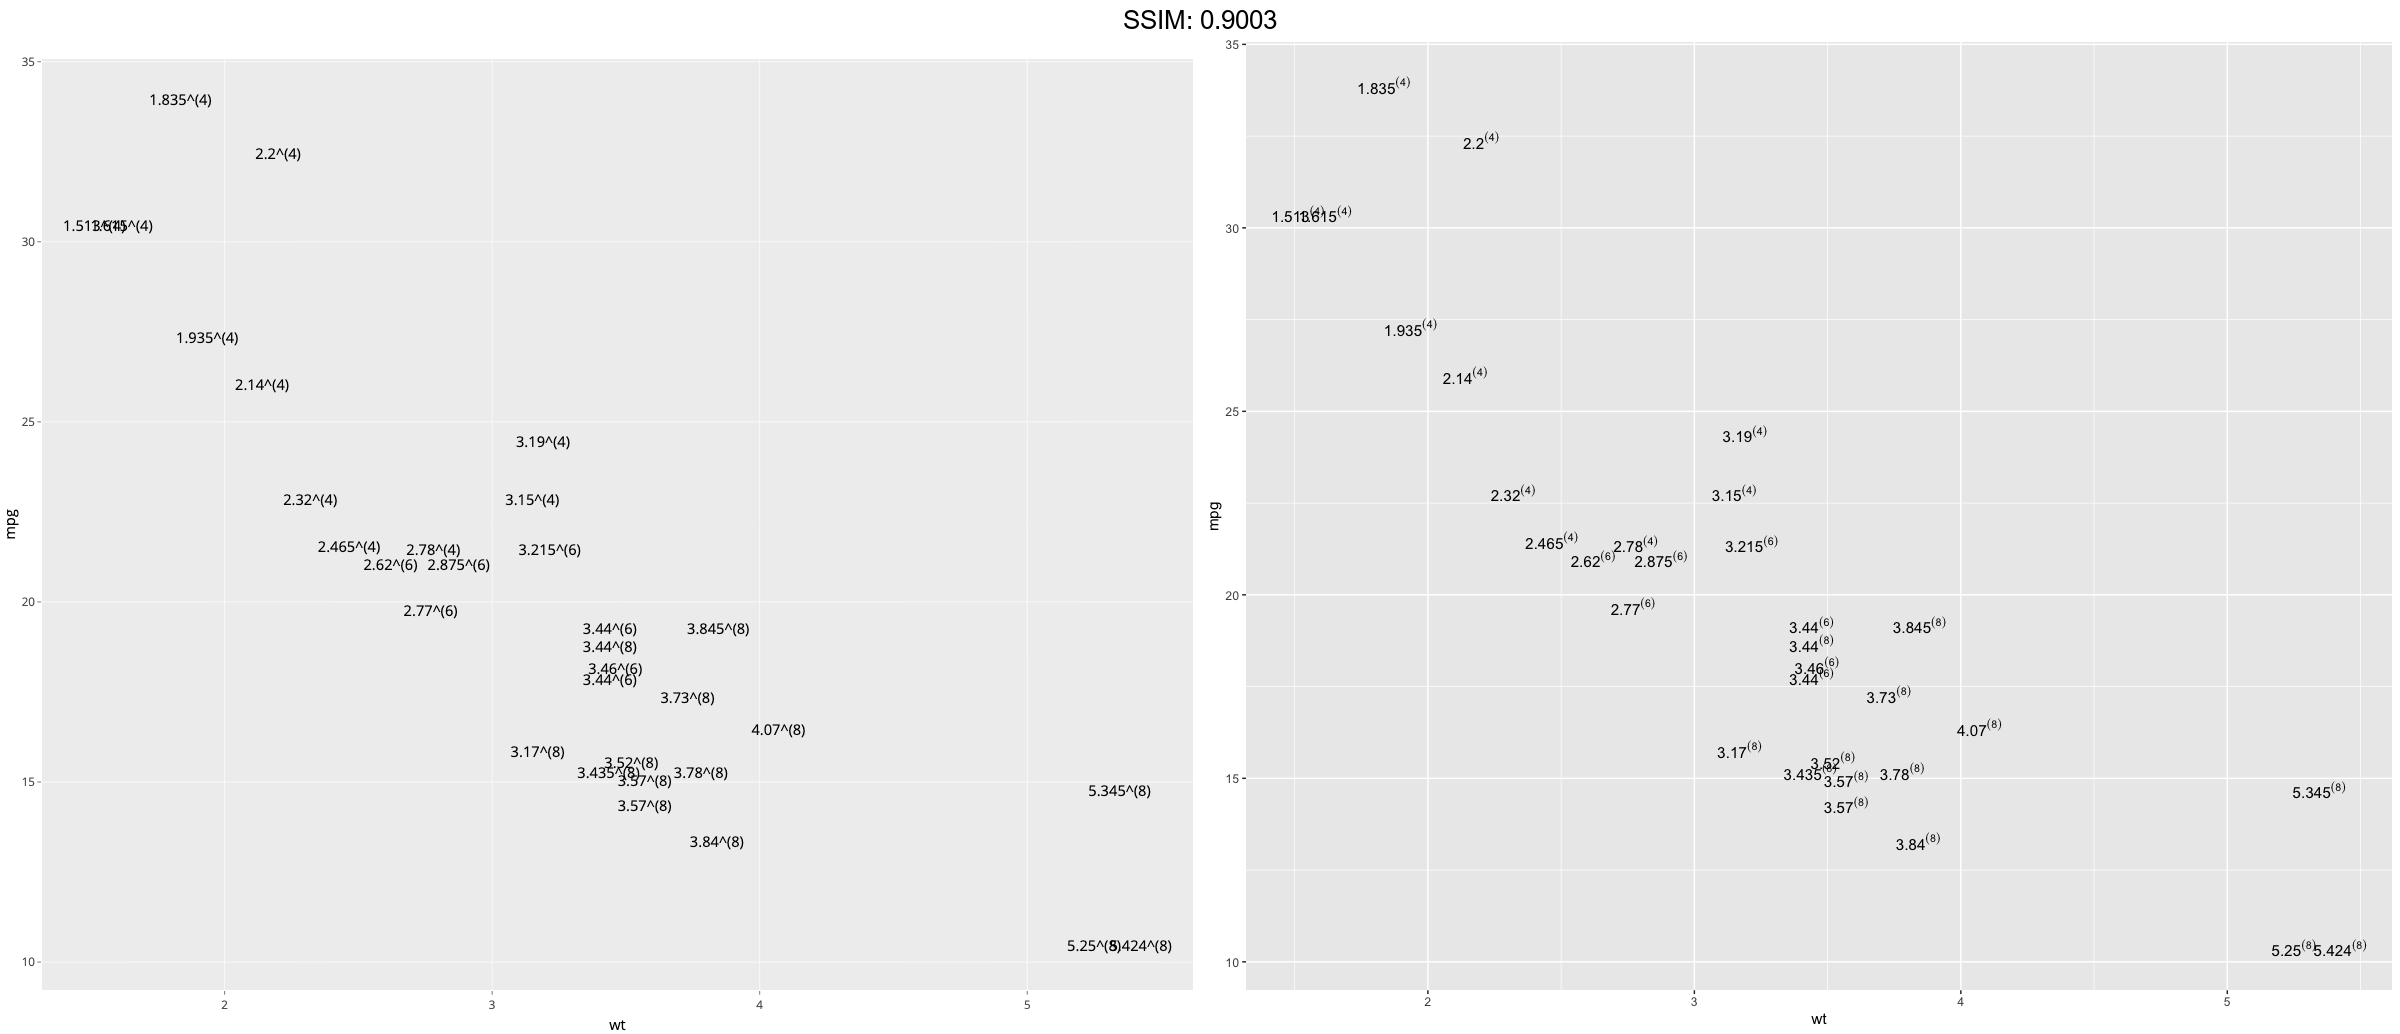
p <- ggplot(mtcars, aes(wt, mpg, label = rownames(mtcars)))
p <-
 p +
  geom_text(
    aes(label = paste(wt, "^(", cyl, ")", sep = "")),
    parse = TRUE
  )
plotly::ggplotly(p)
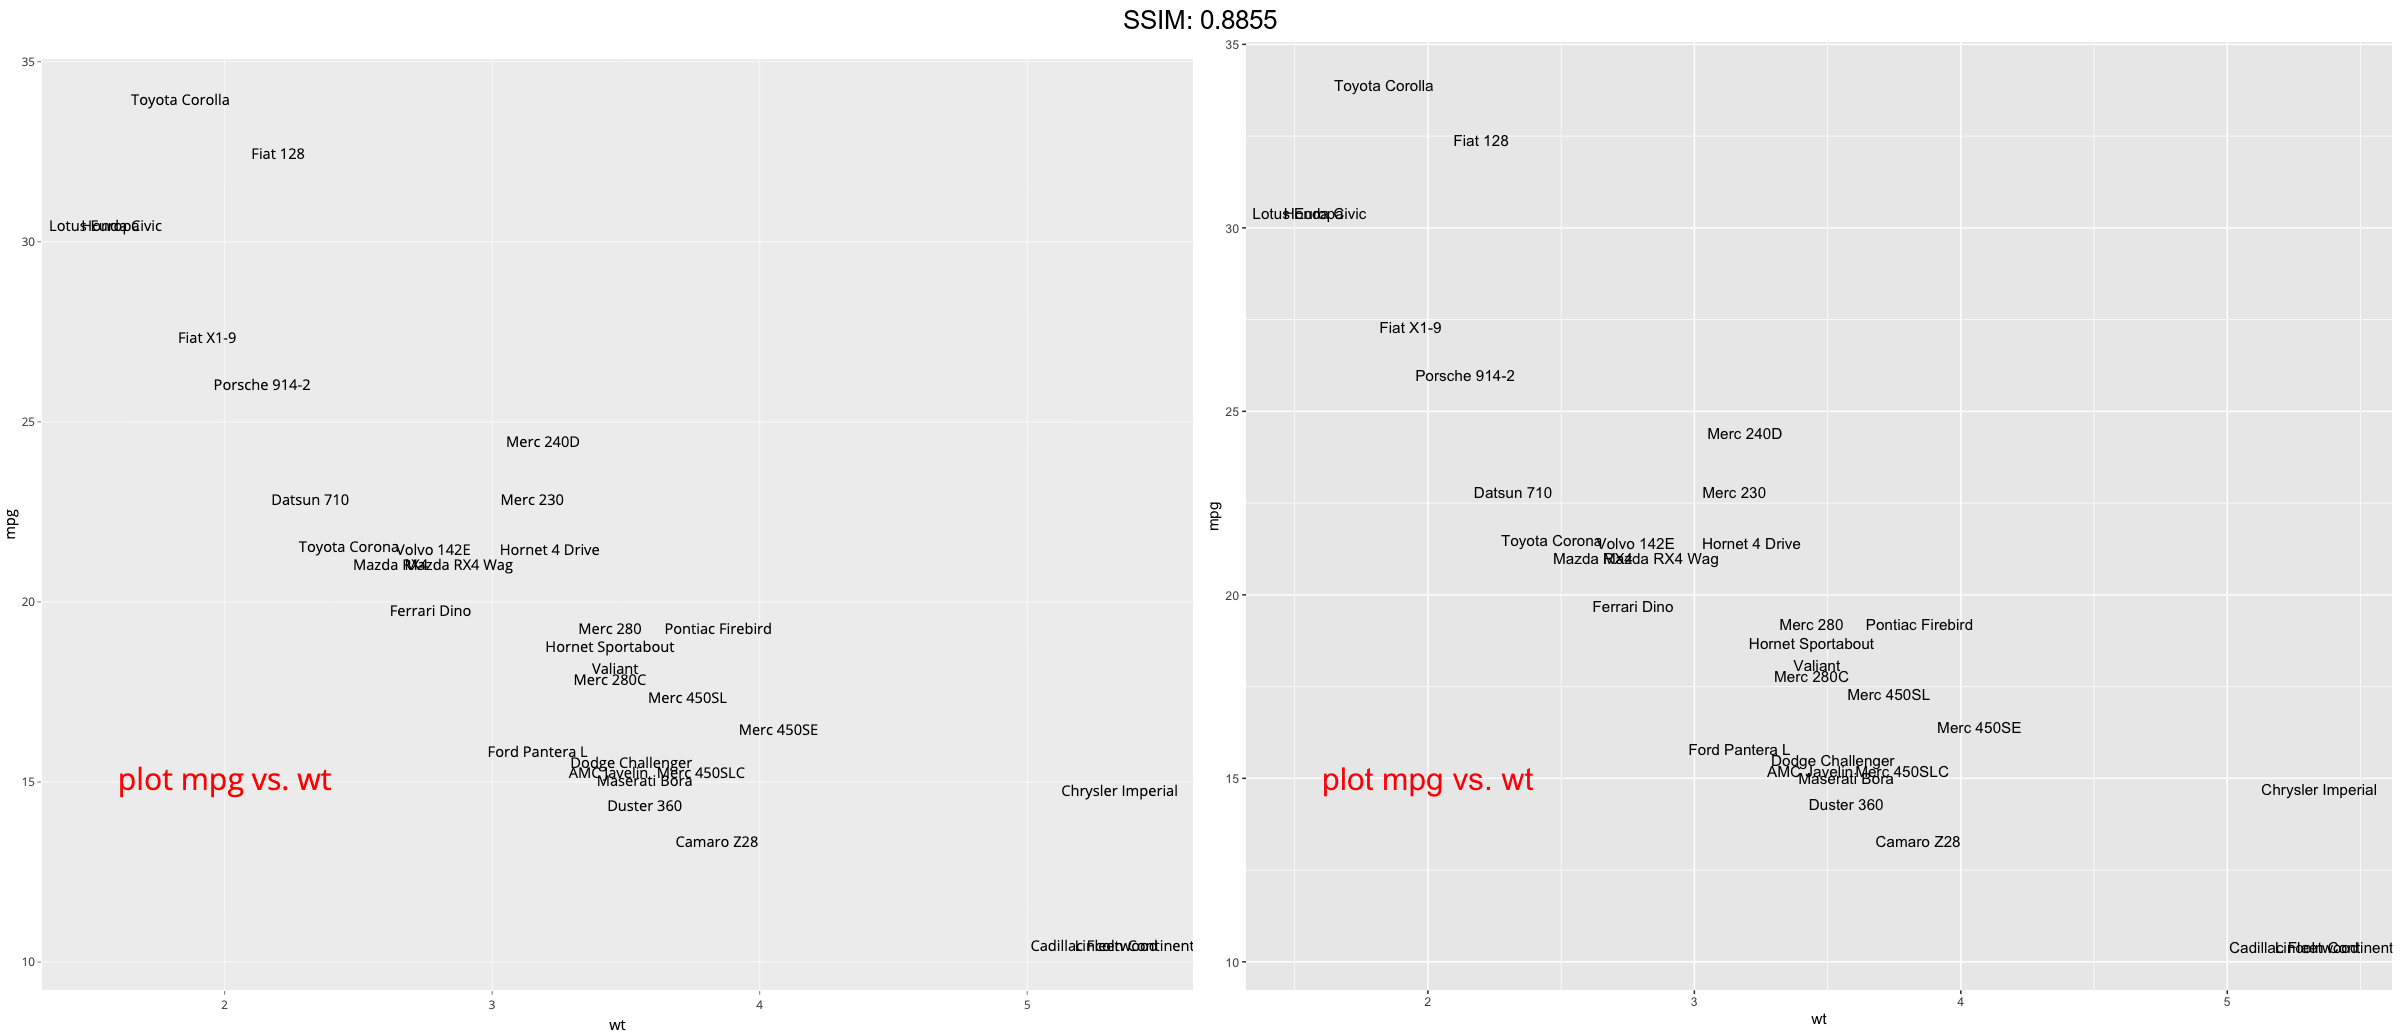
p <- ggplot(mtcars, aes(wt, mpg, label = rownames(mtcars)))
p <-
 p +
  geom_text() +
  annotate(
    "text", label = "plot mpg vs. wt",
    x = 2, y = 15, size = 8, colour = "red"
  )
plotly::ggplotly(p)
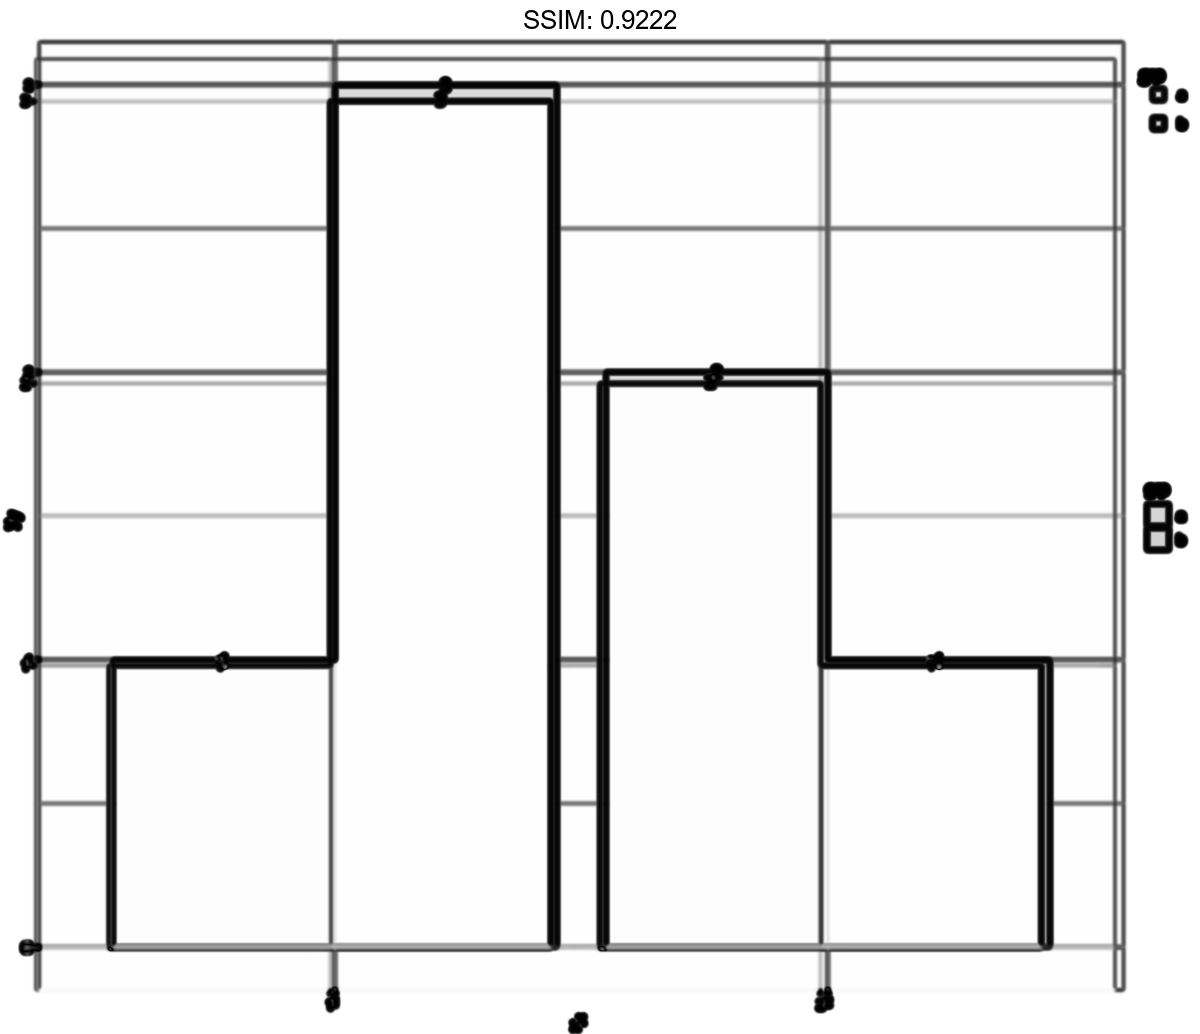
df <- data.frame(
  x = factor(c(1, 1, 2, 2)),
  y = c(1, 3, 2, 1),
  grp = c("a", "b", "a", "b")
)
p <-
 ggplot(data = df, aes(x, y, group = grp)) +
  geom_col(aes(fill = grp), position = "dodge") +
  geom_text(aes(label = y), position = "dodge")
plotly::ggplotly(p)
## Warning: Width not defined. Set with `position_dodge(width = ?)`


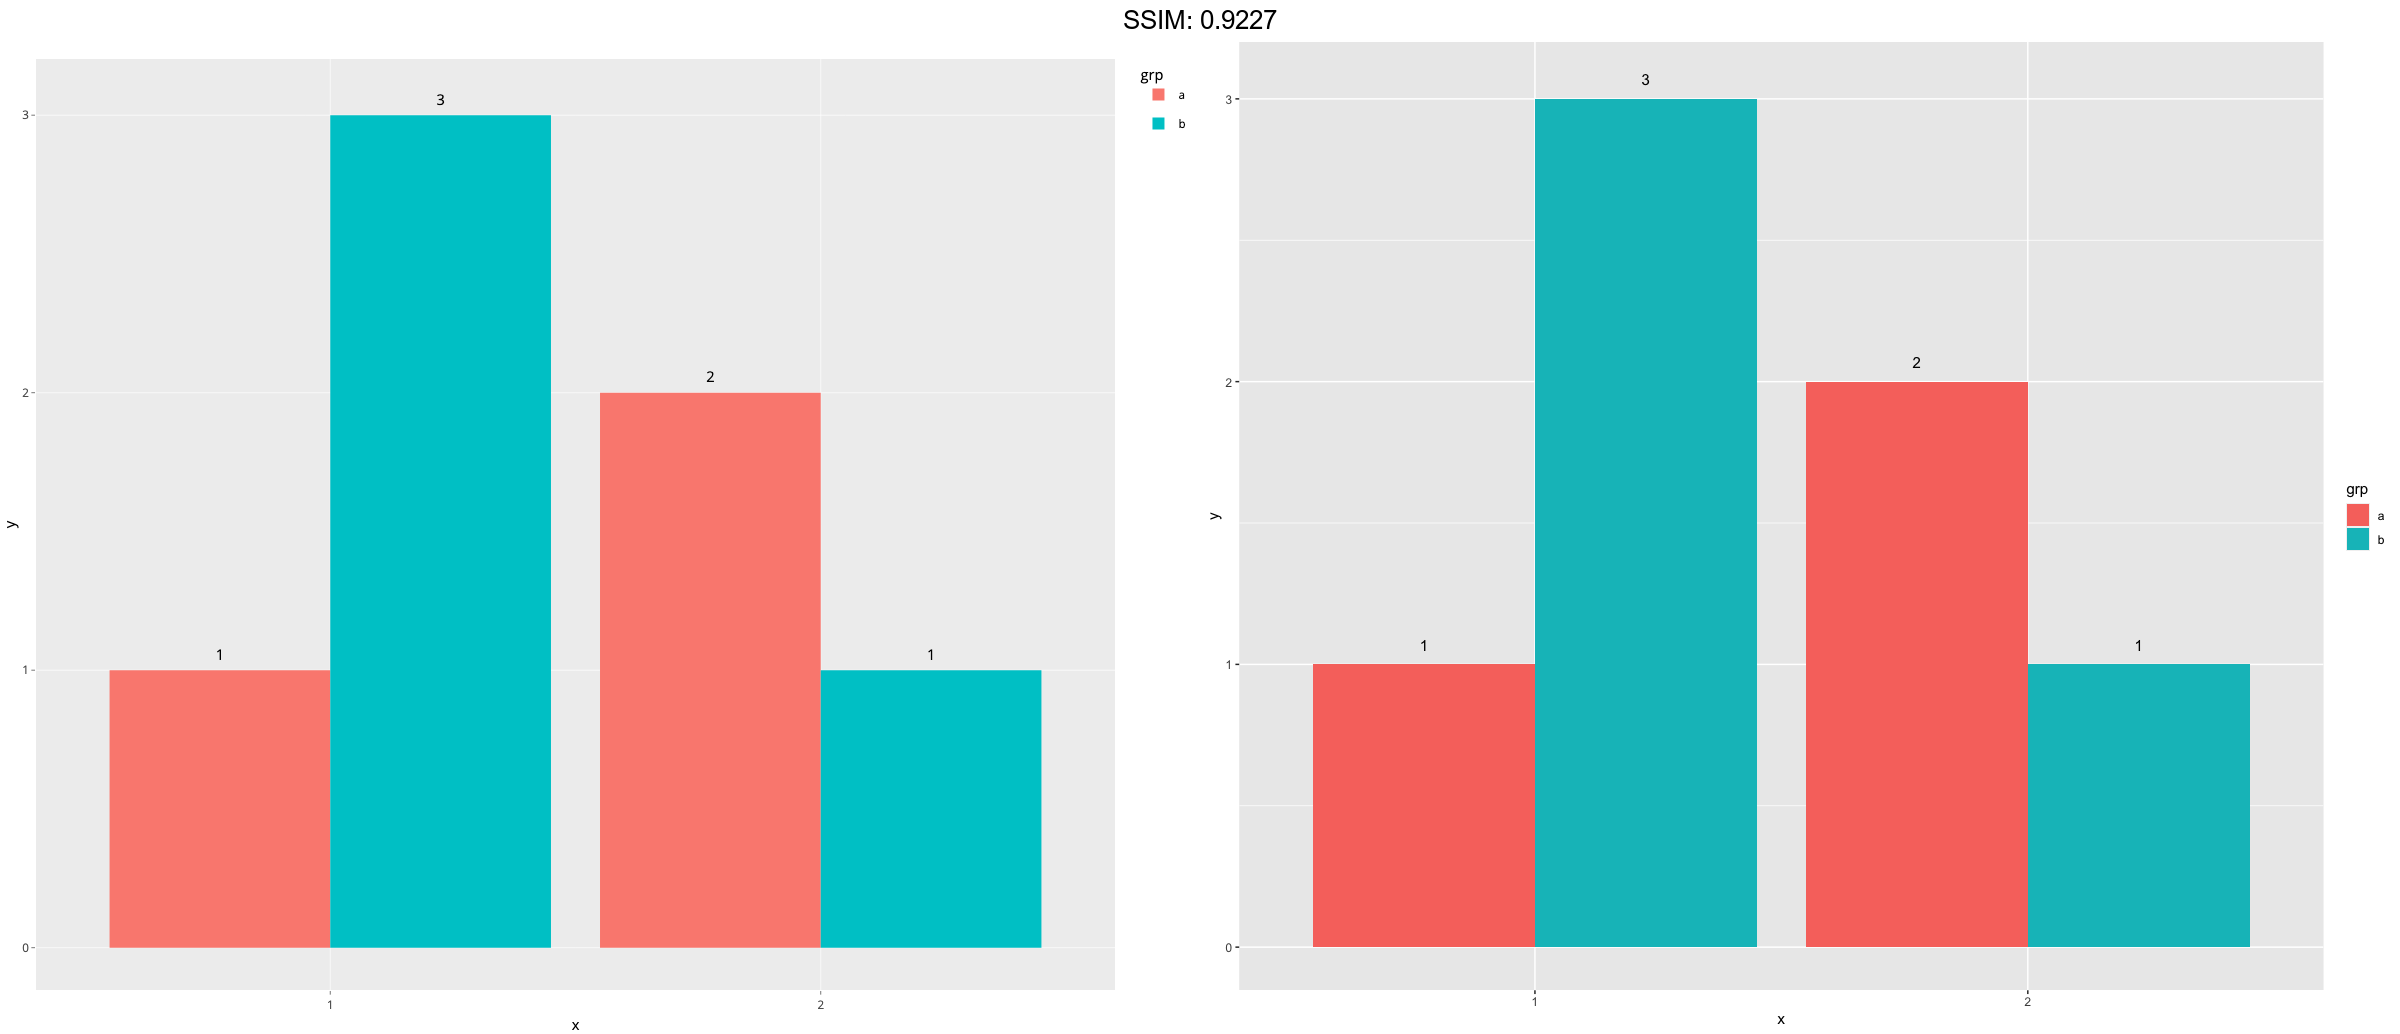
df <- data.frame(
  x = factor(c(1, 1, 2, 2)),
  y = c(1, 3, 2, 1),
  grp = c("a", "b", "a", "b")
)
p <-
 ggplot(data = df, aes(x, y, group = grp)) +
  geom_col(aes(fill = grp), position = "dodge") +
  geom_text(aes(label = y), position = position_dodge(0.9))
plotly::ggplotly(p)

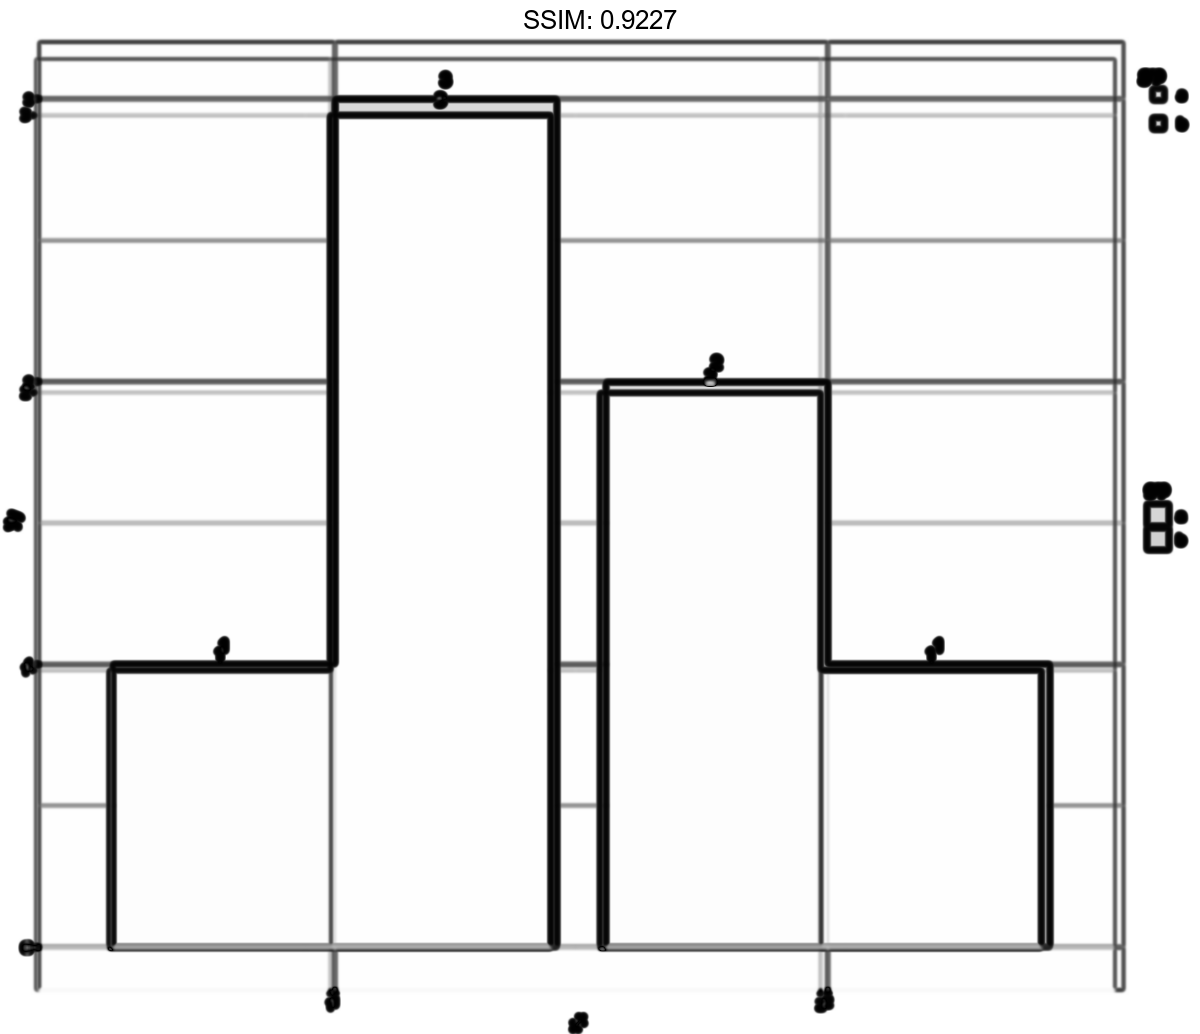
df <- data.frame(
  x = factor(c(1, 1, 2, 2)),
  y = c(1, 3, 2, 1),
  grp = c("a", "b", "a", "b")
)
p <-
 ggplot(data = df, aes(x, y, group = grp)) +
  geom_col(aes(fill = grp), position = "dodge") +
  geom_text(
    aes(label = y, y = y + 0.05),
    position = position_dodge(0.9),
    vjust = 0
  )
plotly::ggplotly(p)
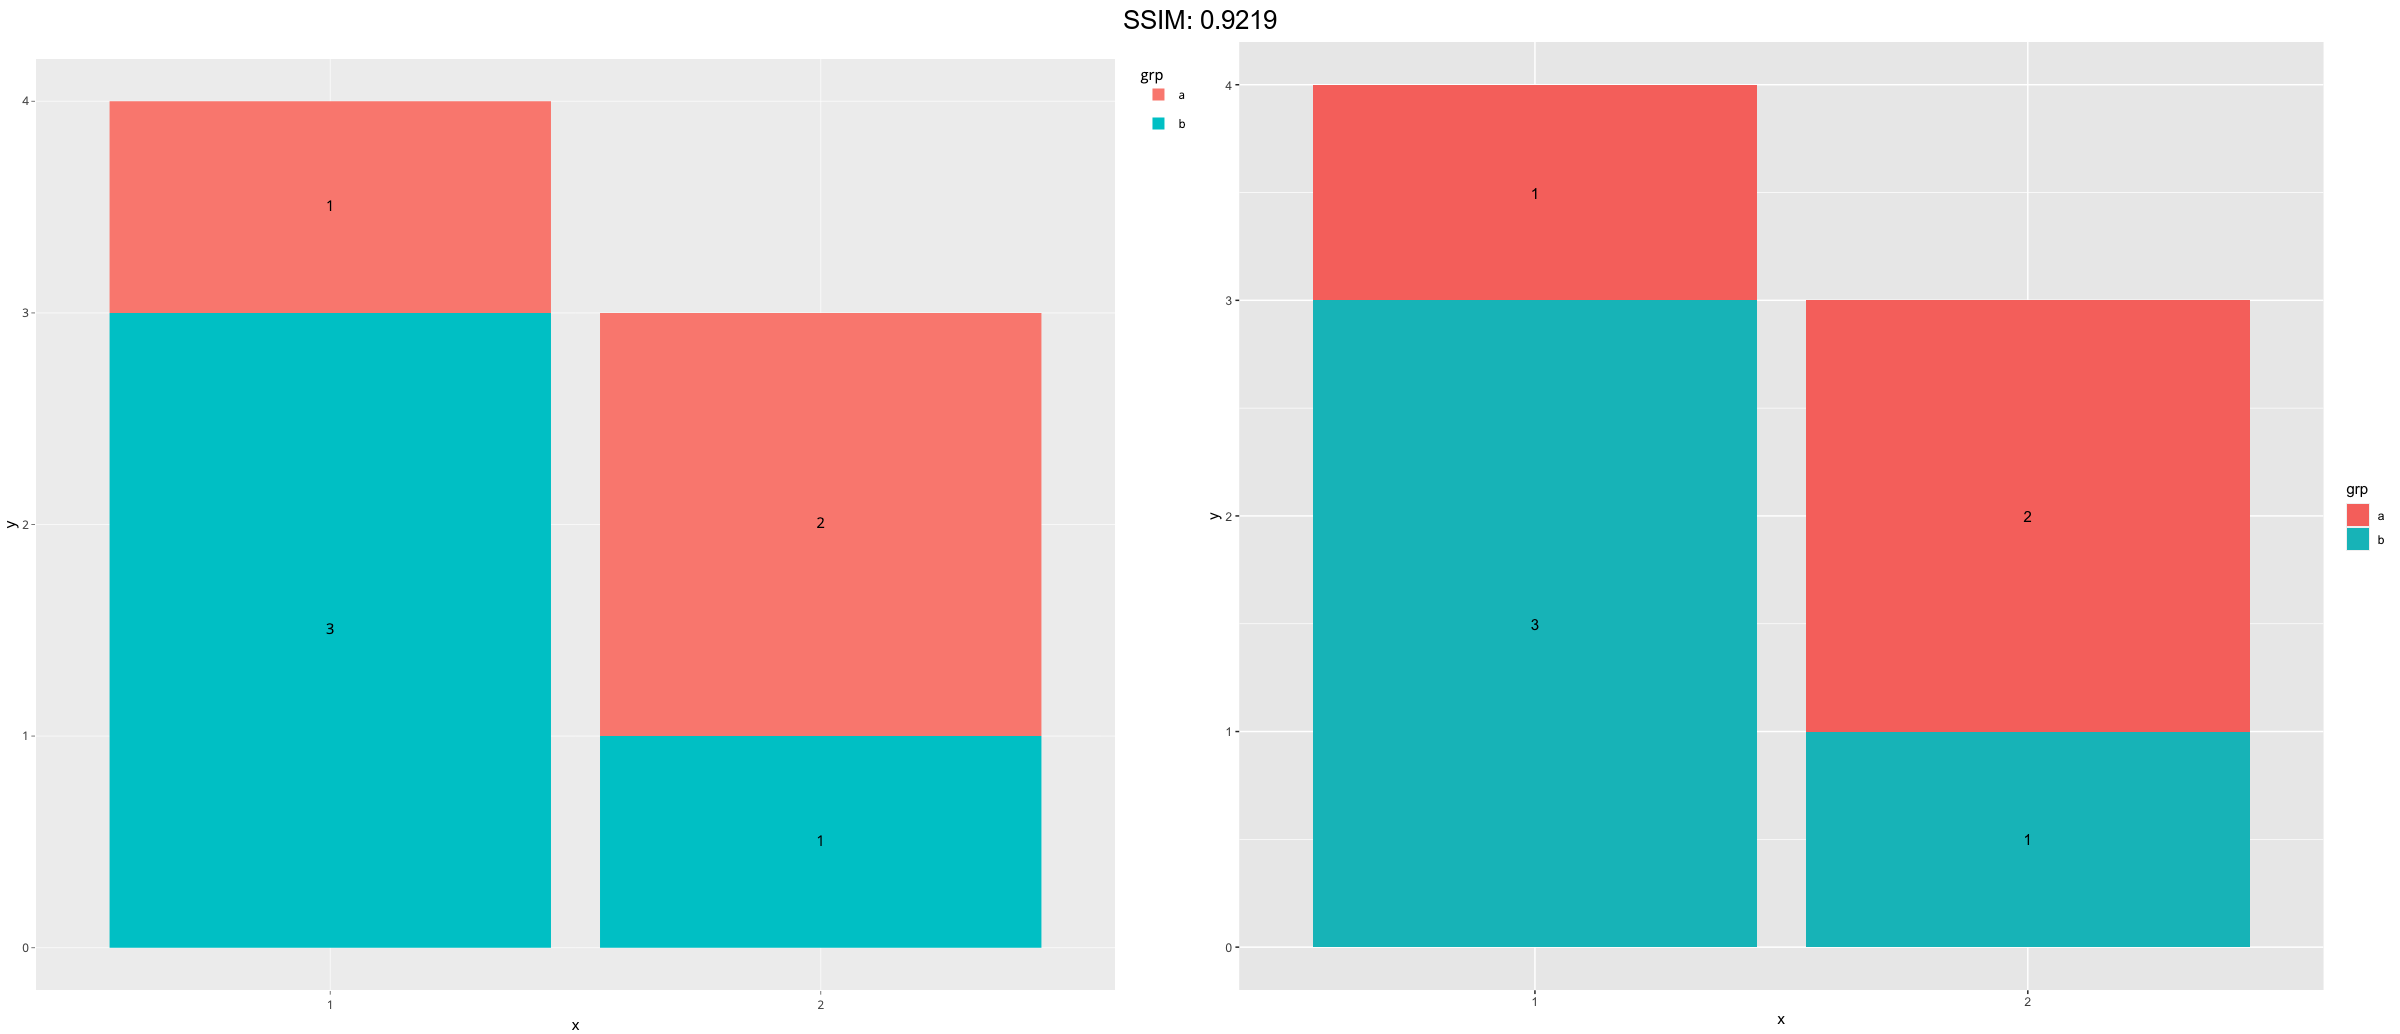
df <- data.frame(
  x = factor(c(1, 1, 2, 2)),
  y = c(1, 3, 2, 1),
  grp = c("a", "b", "a", "b")
)
p <-
 ggplot(data = df, aes(x, y, group = grp)) +
 geom_col(aes(fill = grp)) +
 geom_text(aes(label = y), position = position_stack(vjust = 0.5))
plotly::ggplotly(p)
df <- data.frame(
  x = c(1, 1, 2, 2, 1.5),
  y = c(1, 2, 1, 2, 1.5),
  text = c("bottom-left", "bottom-right", "top-left", "top-right", "center")
)
p <-
 ggplot(df, aes(x, y)) +
  geom_text(aes(label = text))
plotly::ggplotly(p)
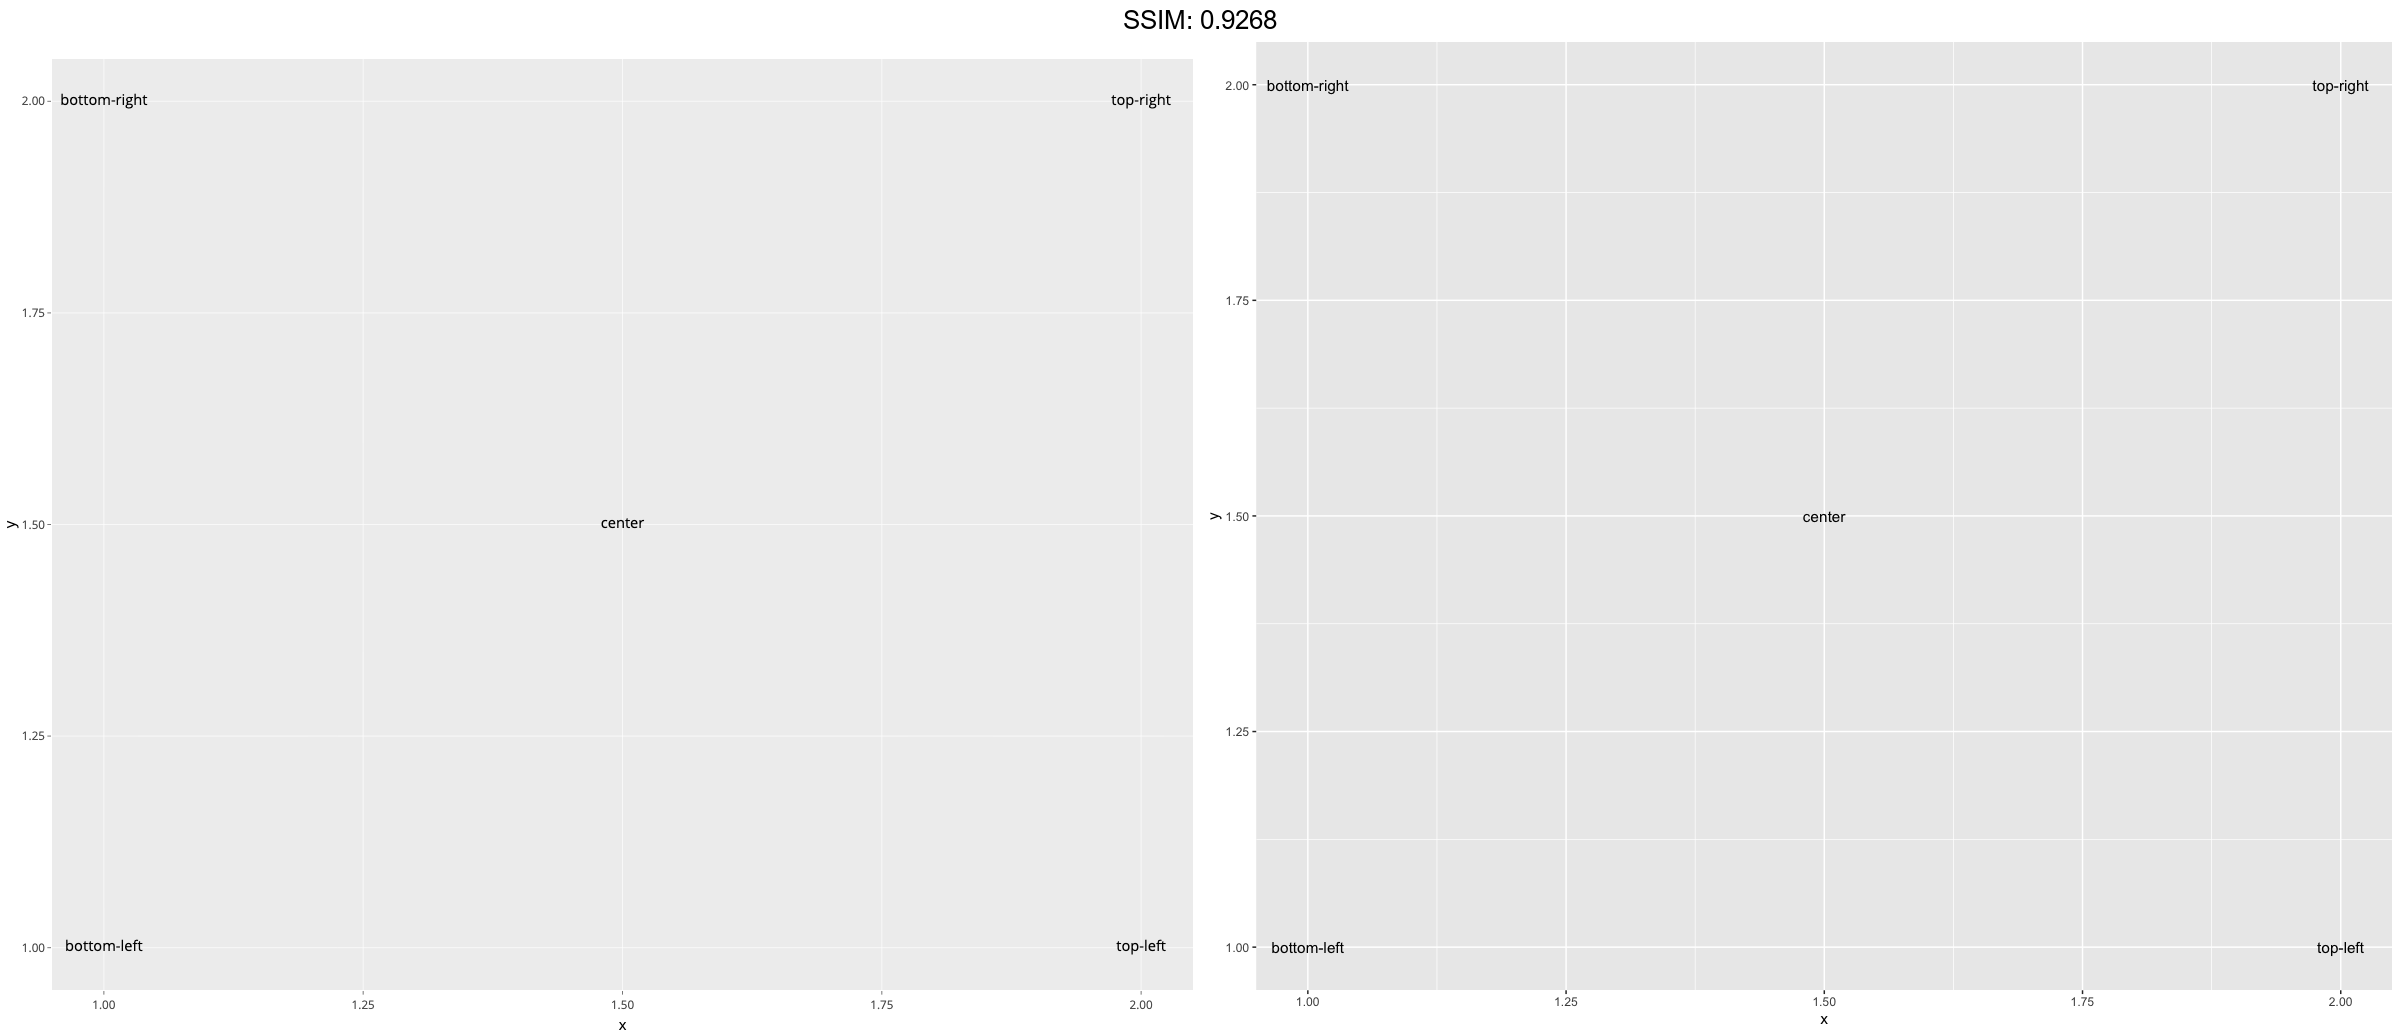
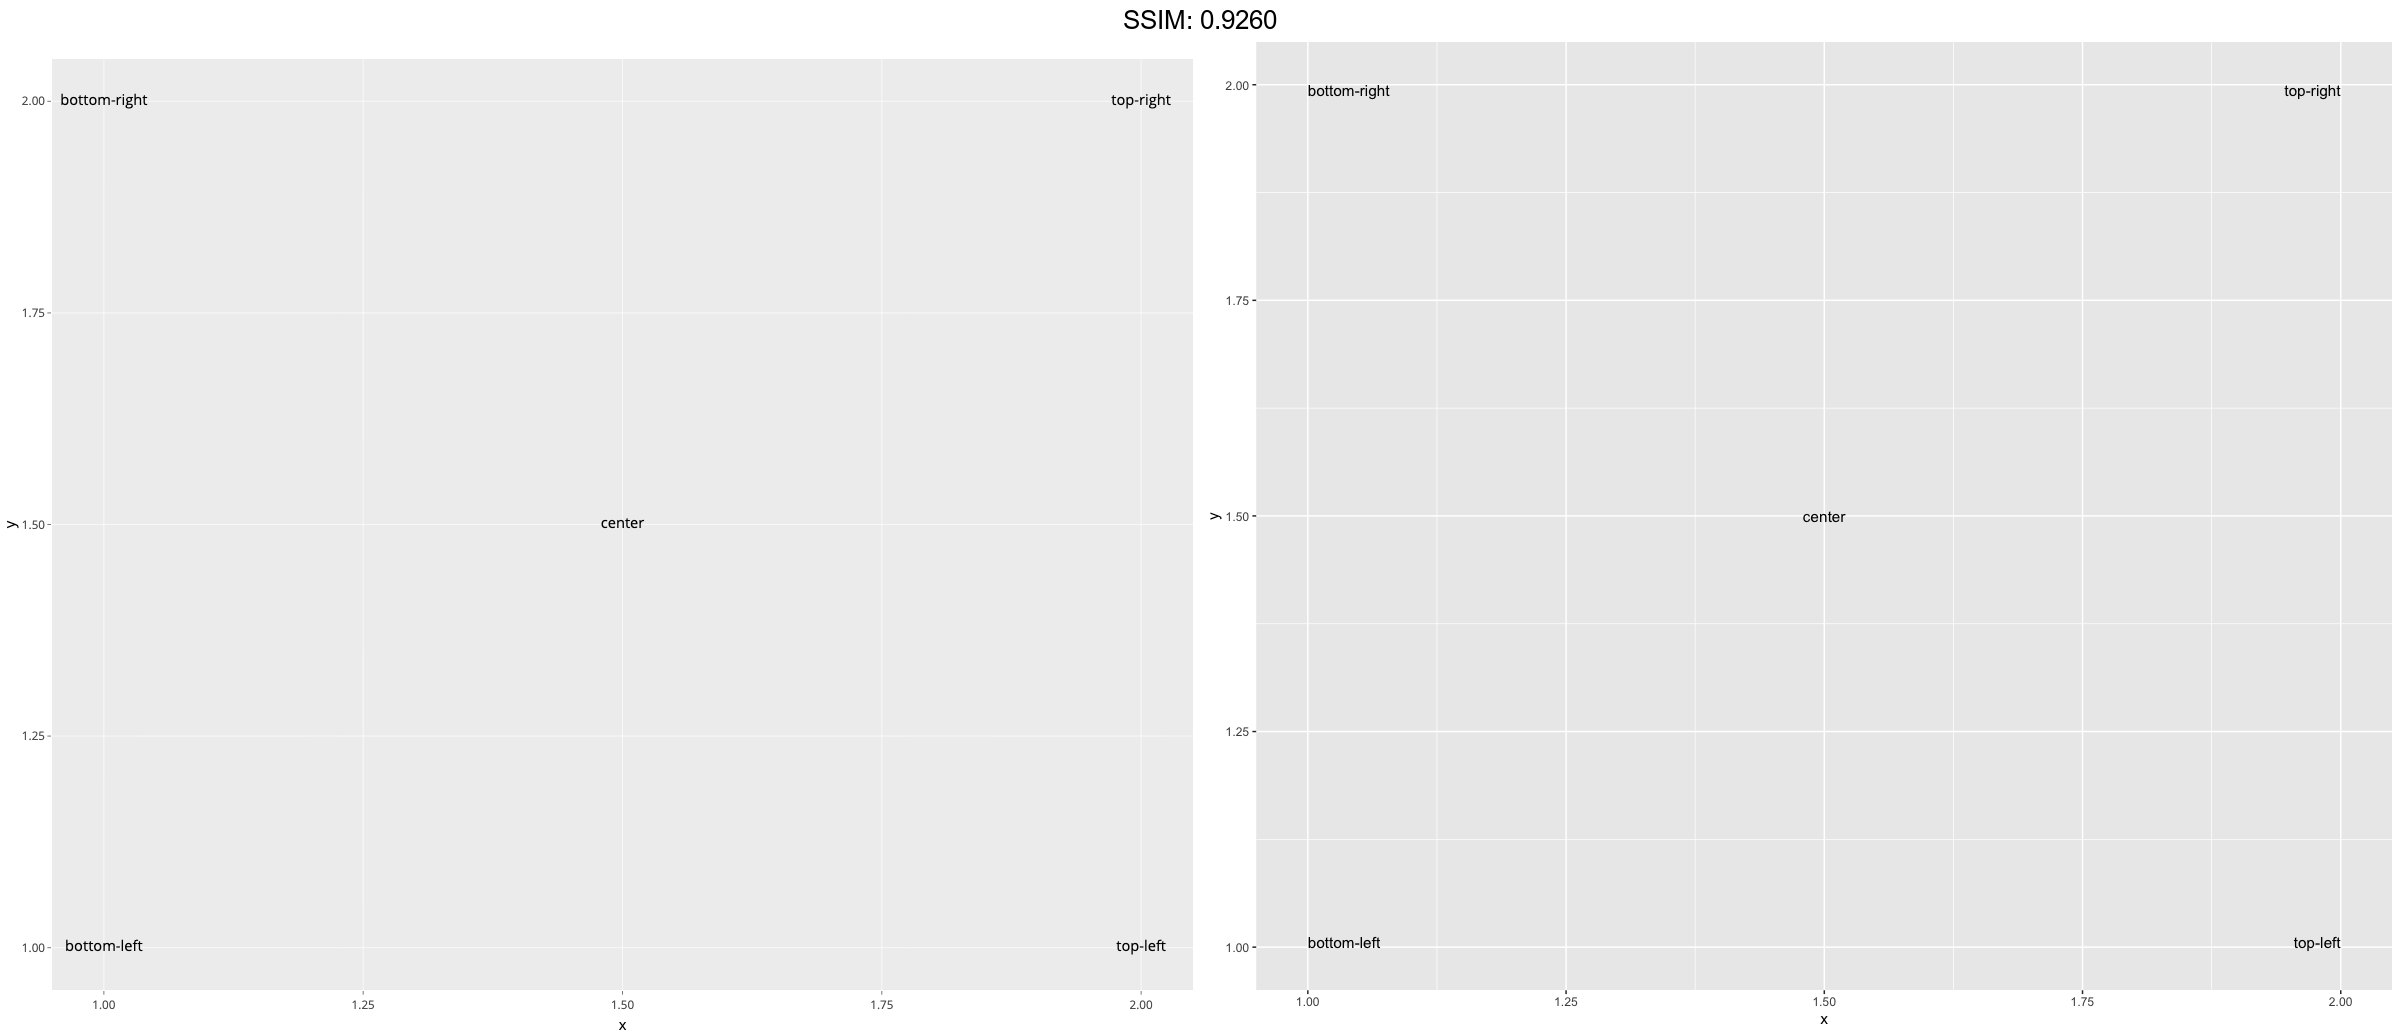
df <- data.frame(
  x = c(1, 1, 2, 2, 1.5),
  y = c(1, 2, 1, 2, 1.5),
  text = c("bottom-left", "bottom-right", "top-left", "top-right", "center")
)
p <-
 ggplot(df, aes(x, y)) +
  geom_text(aes(label = text), vjust = "inward", hjust = "inward")
plotly::ggplotly(p)