GGPLOT - geom_segment
Draws a straight line between points in the chart and then convert them with ggplotly
b <- ggplot(mtcars, aes(wt, mpg)) +
  geom_point()
df <- data.frame(x1 = 2.62, x2 = 3.57, y1 = 21.0, y2 = 15.0)
p <-
 b +
 geom_curve(aes(x = x1, y = y1, xend = x2, yend = y2, colour = "curve"), data = df) +
 geom_segment(aes(x = x1, y = y1, xend = x2, yend = y2, colour = "segment"), data = df)
plotly::ggplotly(p)
## Warning in geom2trace.default(dots[[1L]][[1L]], dots[[2L]][[1L]], dots[[3L]][[1L]]): geom_GeomCurve() has yet to be implemented in plotly.
##   If you'd like to see this geom implemented,
##   Please open an issue with your example code at
##   https://github.com/ropensci/plotly/issues


b <- ggplot(mtcars, aes(wt, mpg)) +
  geom_point()
df <- data.frame(x1 = 2.62, x2 = 3.57, y1 = 21.0, y2 = 15.0)
p <- b + geom_curve(aes(x = x1, y = y1, xend = x2, yend = y2), data = df, curvature = -0.2)
plotly::ggplotly(p)
## Warning in geom2trace.default(dots[[1L]][[1L]], dots[[2L]][[1L]], dots[[3L]][[1L]]): geom_GeomCurve() has yet to be implemented in plotly.
##   If you'd like to see this geom implemented,
##   Please open an issue with your example code at
##   https://github.com/ropensci/plotly/issues


b <- ggplot(mtcars, aes(wt, mpg)) +
  geom_point()
df <- data.frame(x1 = 2.62, x2 = 3.57, y1 = 21.0, y2 = 15.0)
p <- b + geom_curve(aes(x = x1, y = y1, xend = x2, yend = y2), data = df, curvature = 1)
plotly::ggplotly(p)
## Warning in geom2trace.default(dots[[1L]][[1L]], dots[[2L]][[1L]], dots[[3L]][[1L]]): geom_GeomCurve() has yet to be implemented in plotly.
##   If you'd like to see this geom implemented,
##   Please open an issue with your example code at
##   https://github.com/ropensci/plotly/issues


b <- ggplot(mtcars, aes(wt, mpg)) +
  geom_point()
df <- data.frame(x1 = 2.62, x2 = 3.57, y1 = 21.0, y2 = 15.0)
p <-
 b + geom_curve(
  aes(x = x1, y = y1, xend = x2, yend = y2),
  data = df,
  arrow = arrow(length = unit(0.03, "npc"))
)
plotly::ggplotly(p)
## Warning in geom2trace.default(dots[[1L]][[1L]], dots[[2L]][[1L]], dots[[3L]][[1L]]): geom_GeomCurve() has yet to be implemented in plotly.
##   If you'd like to see this geom implemented,
##   Please open an issue with your example code at
##   https://github.com/ropensci/plotly/issues


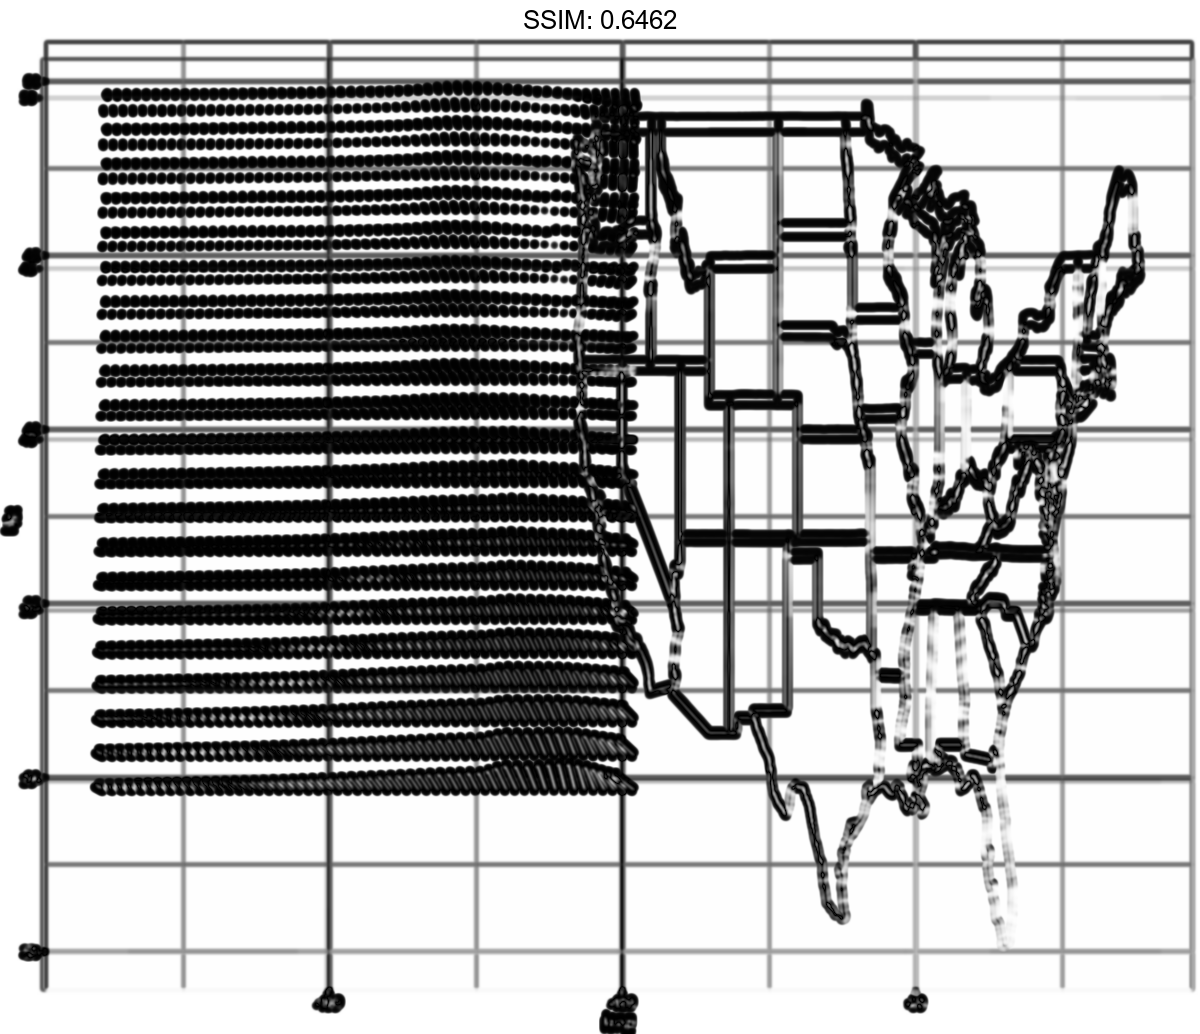
p <-
 ggplot(seals, aes(long, lat)) +
  geom_segment(aes(xend = long + delta_long, yend = lat + delta_lat),
    arrow = arrow(length = unit(0.1,"cm"))) +
  borders("state")
plotly::ggplotly(p)

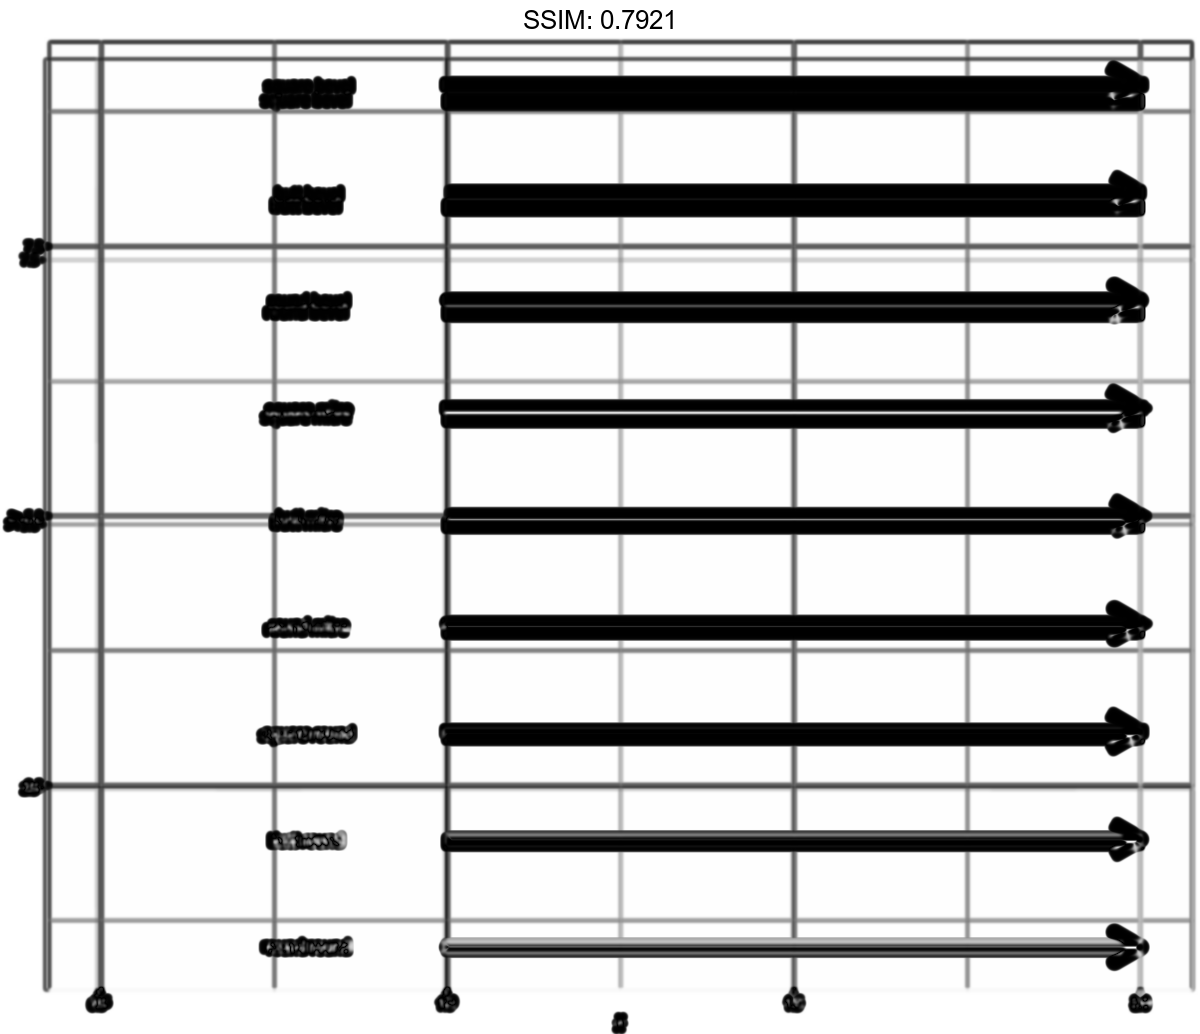
df2 <- expand.grid(
  lineend = c('round', 'butt', 'square'),
  linejoin = c('round', 'mitre', 'bevel'),
  stringsAsFactors = FALSE
)
df2 <- data.frame(df2, y = 1:9)
p <-
 ggplot(df2, aes(x = 1, y = y, xend = 2, yend = y, label = paste(lineend, linejoin))) +
  geom_segment(
     lineend = df2$lineend, linejoin = df2$linejoin,
     size = 3, arrow = arrow(length = unit(0.3, "inches"))
  ) +
  geom_text(hjust = 'outside', nudge_x = -0.2) +
  xlim(0.5, 2)
plotly::ggplotly(p)

counts <- as.data.frame(table(x = rpois(100,5)))
counts$x <- as.numeric(as.character(counts$x))
p <-
 with(counts, plot(x, Freq, type = "h", lwd = 10))
plotly::ggplotly(p)
## Error in UseMethod("api_create"): no applicable method for 'api_create' applied to an object of class "shiny.tag"
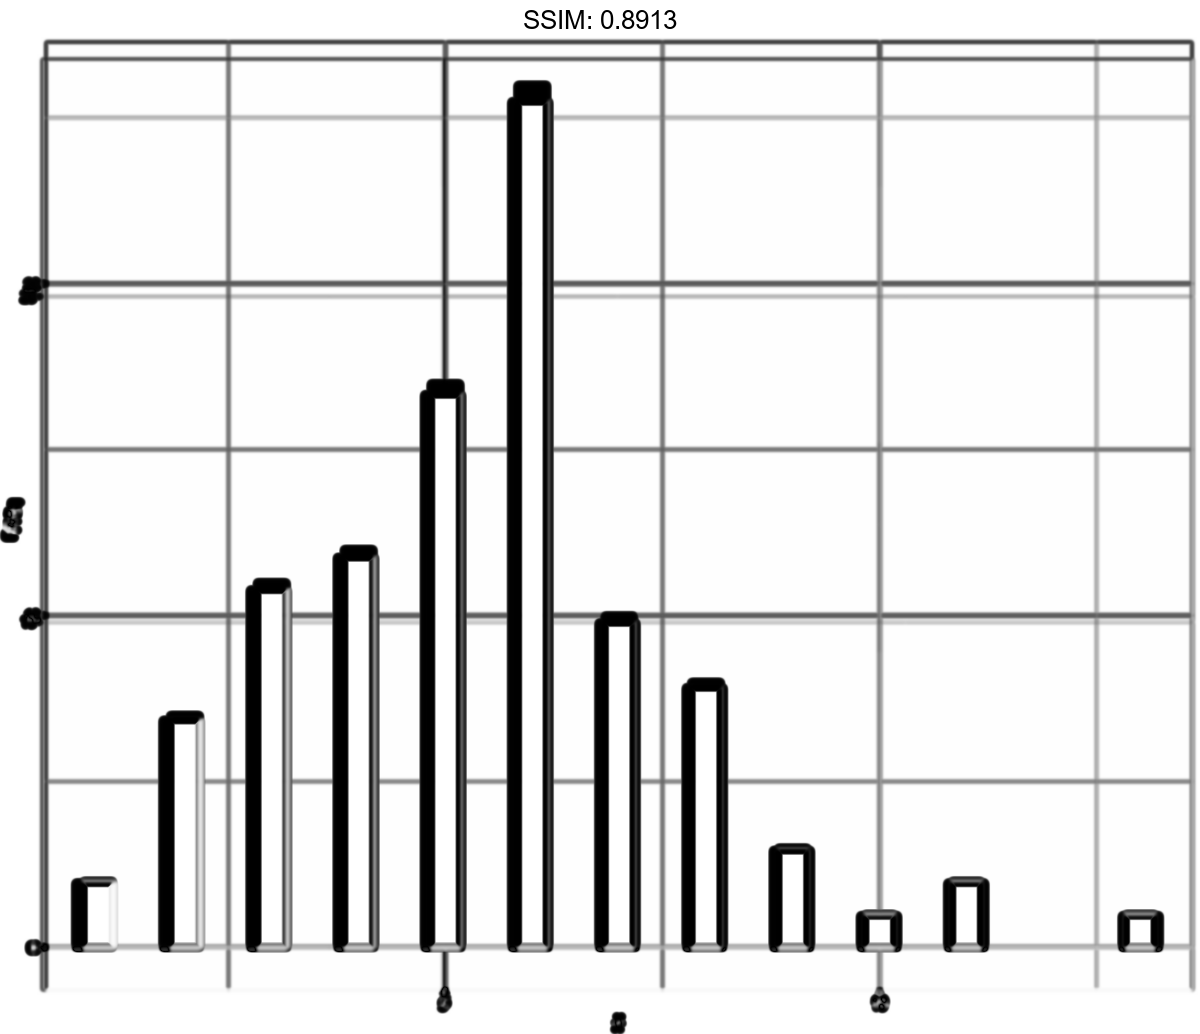
counts <- as.data.frame(table(x = rpois(100,5)))
counts$x <- as.numeric(as.character(counts$x))
p <-
 ggplot(counts, aes(x, Freq)) +
  geom_segment(aes(xend = x, yend = 0), size = 10, lineend = "butt")
plotly::ggplotly(p)