GGPLOT - geom_rug
Supplement a 2d display with the two 1d marginal distributions and then convert them with ggplotly
p <- ggplot(mtcars, aes(wt, mpg)) +
  geom_point()
plotly::ggplotly(p)

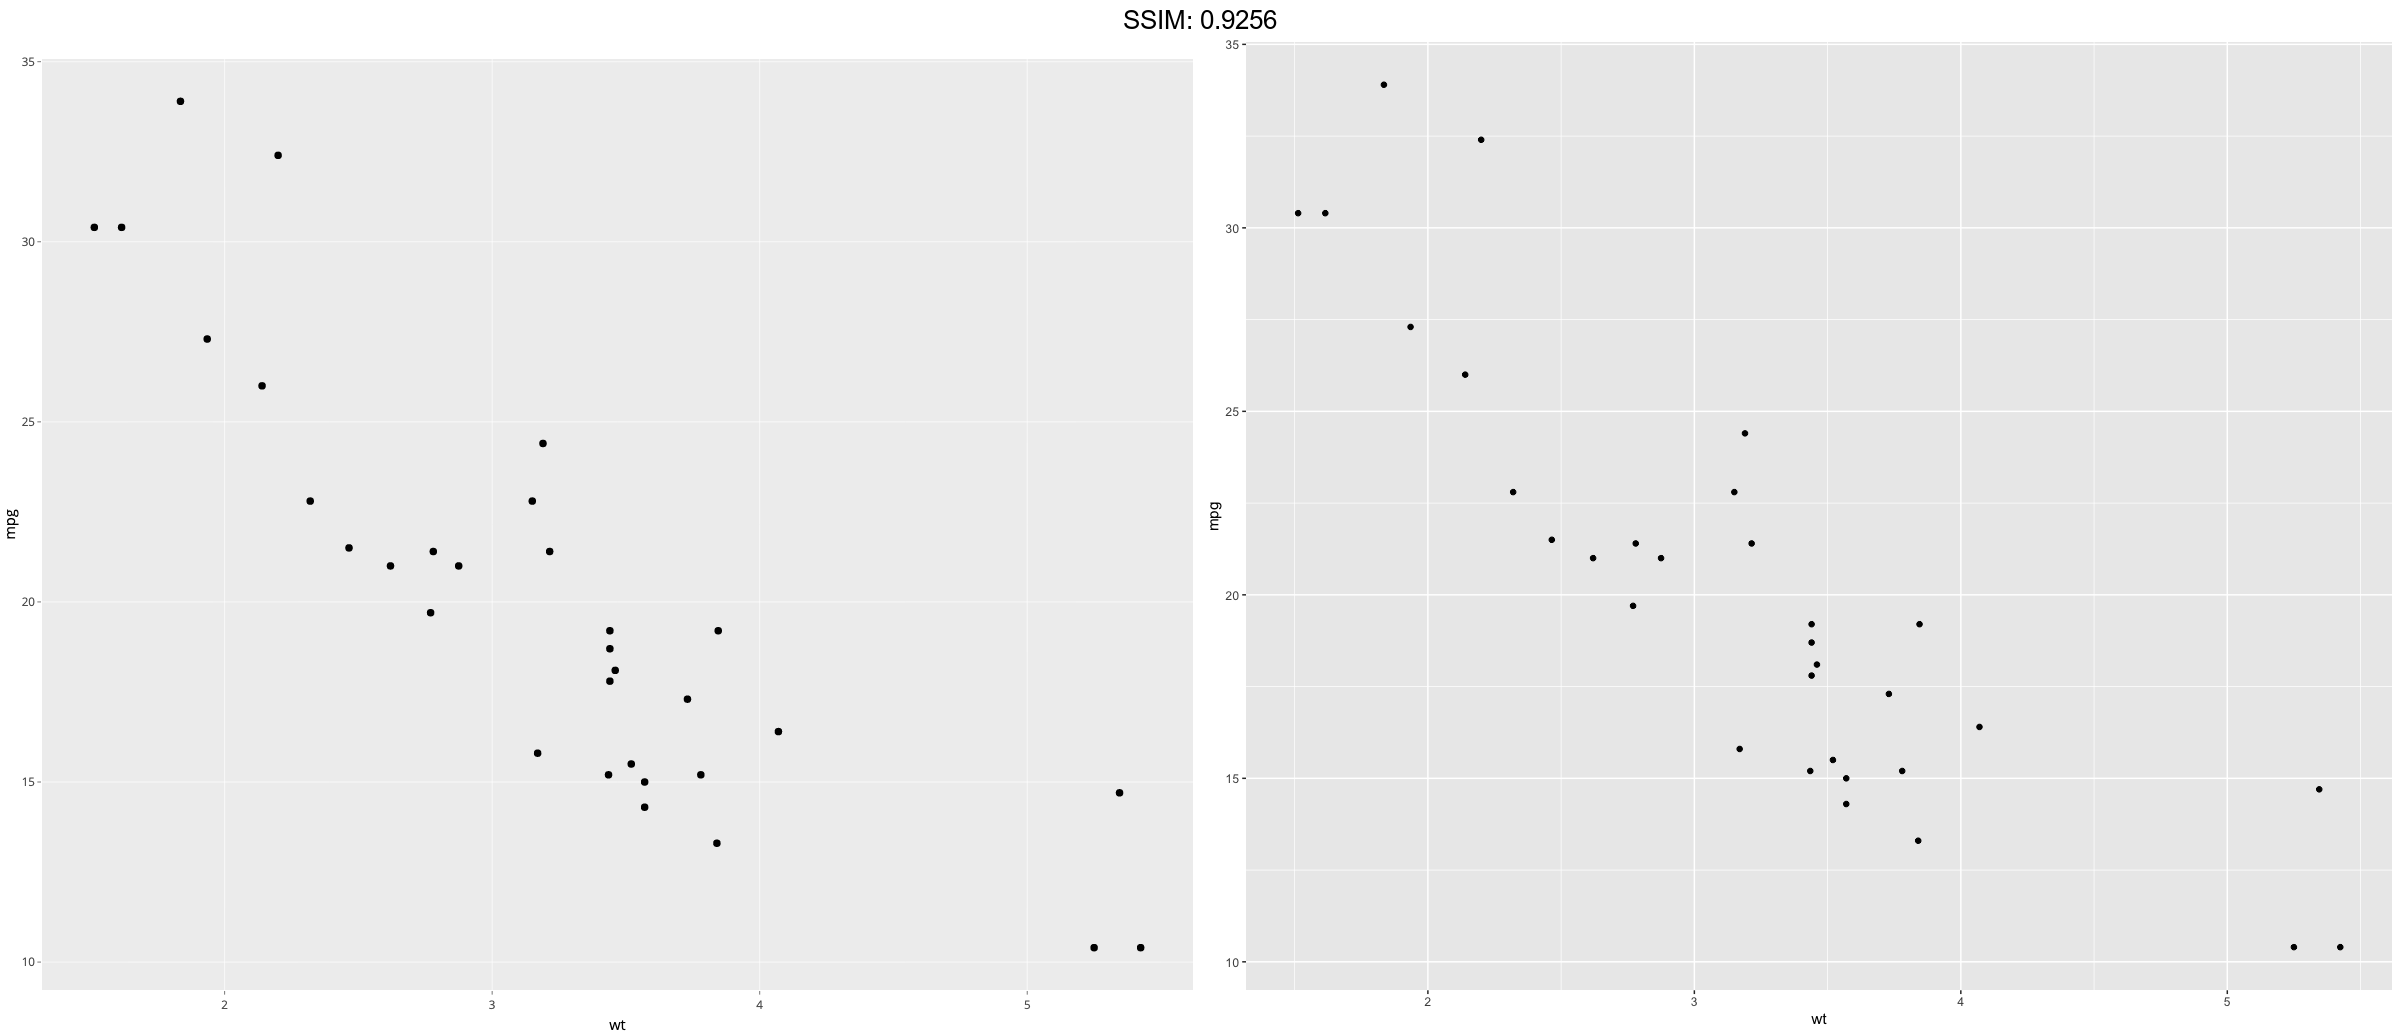

p <- ggplot(mtcars, aes(wt, mpg)) +
  geom_point()
p <- p + geom_rug()
plotly::ggplotly(p)

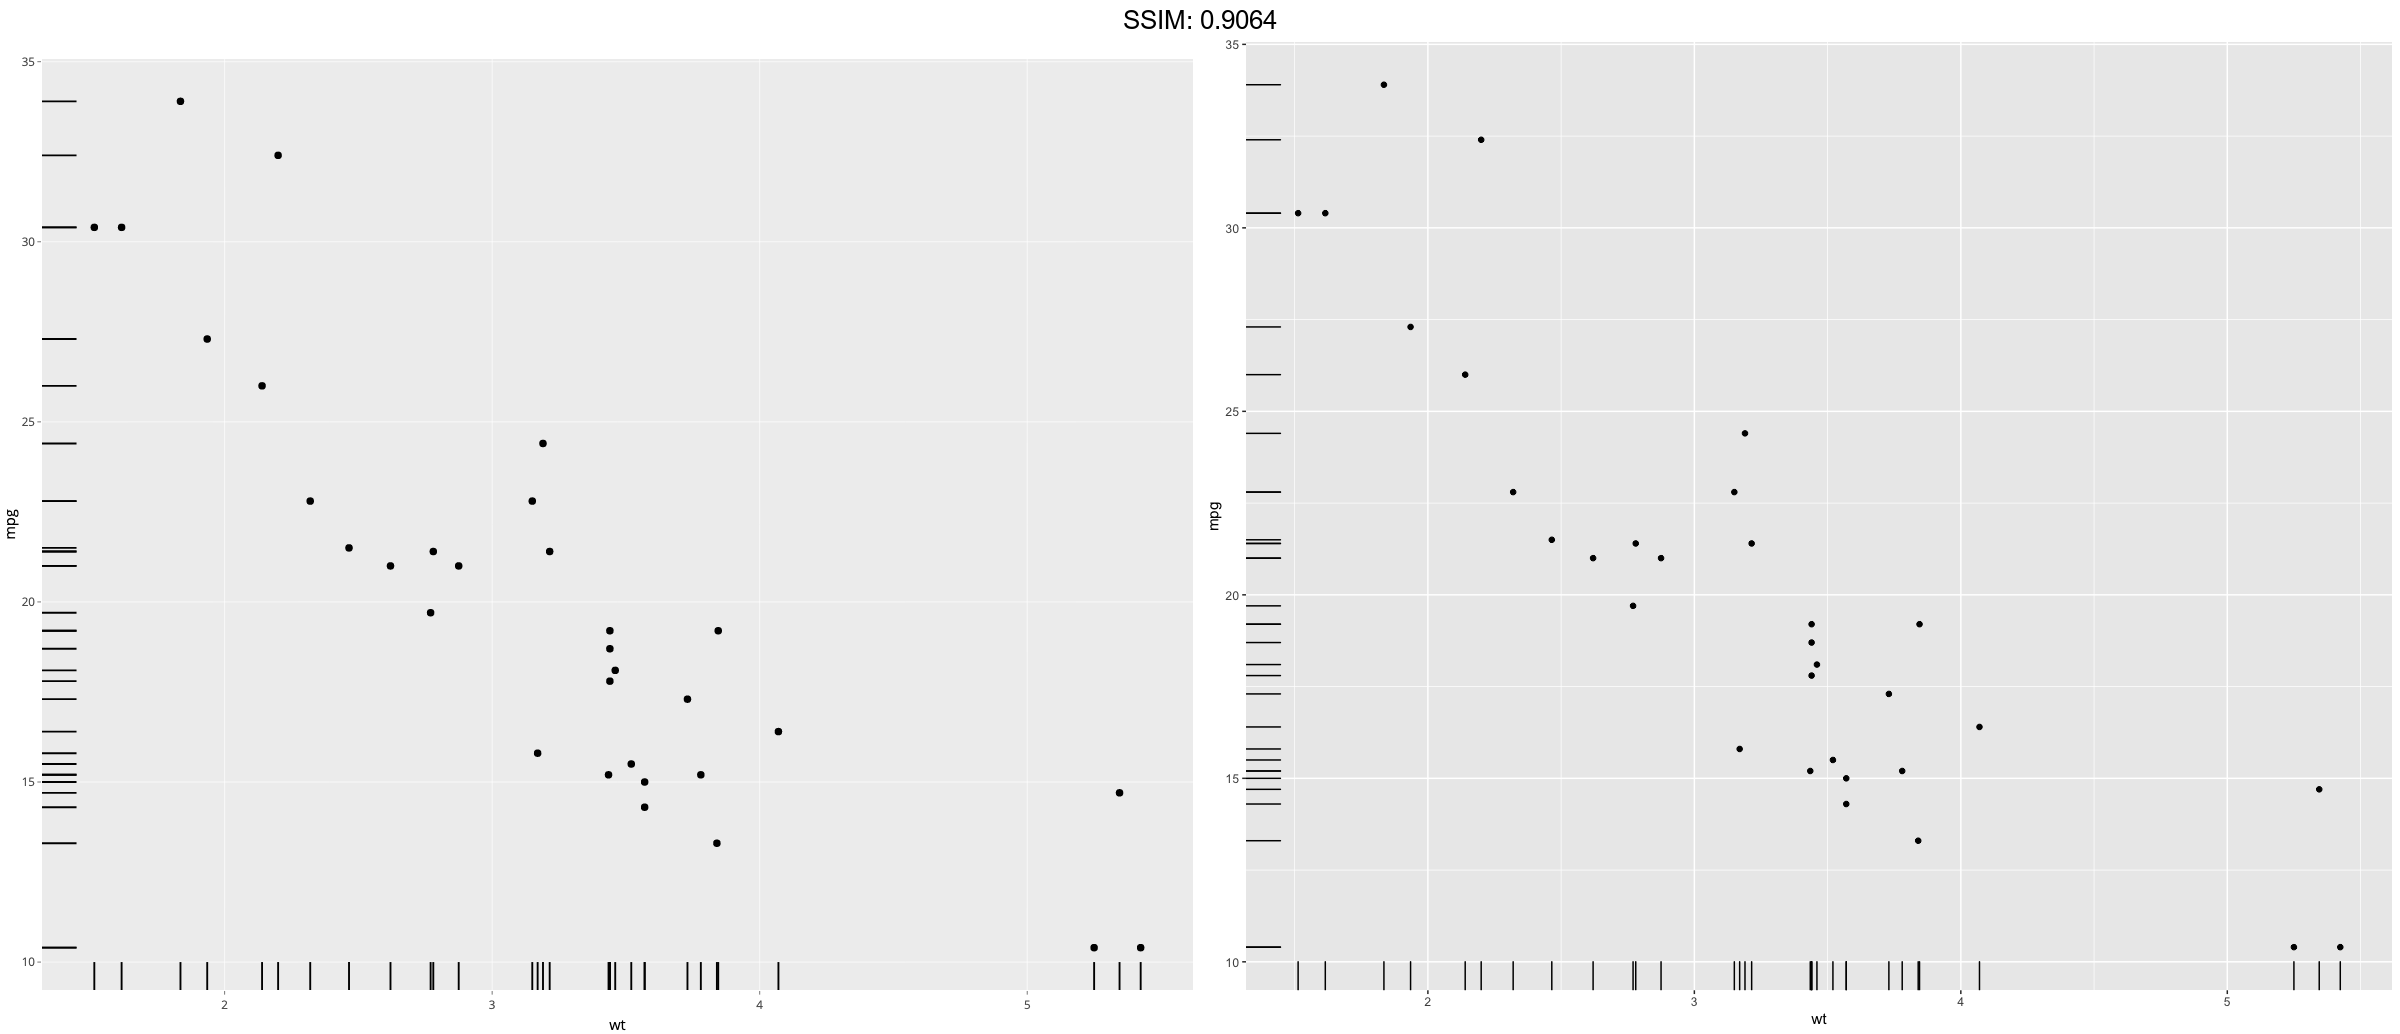
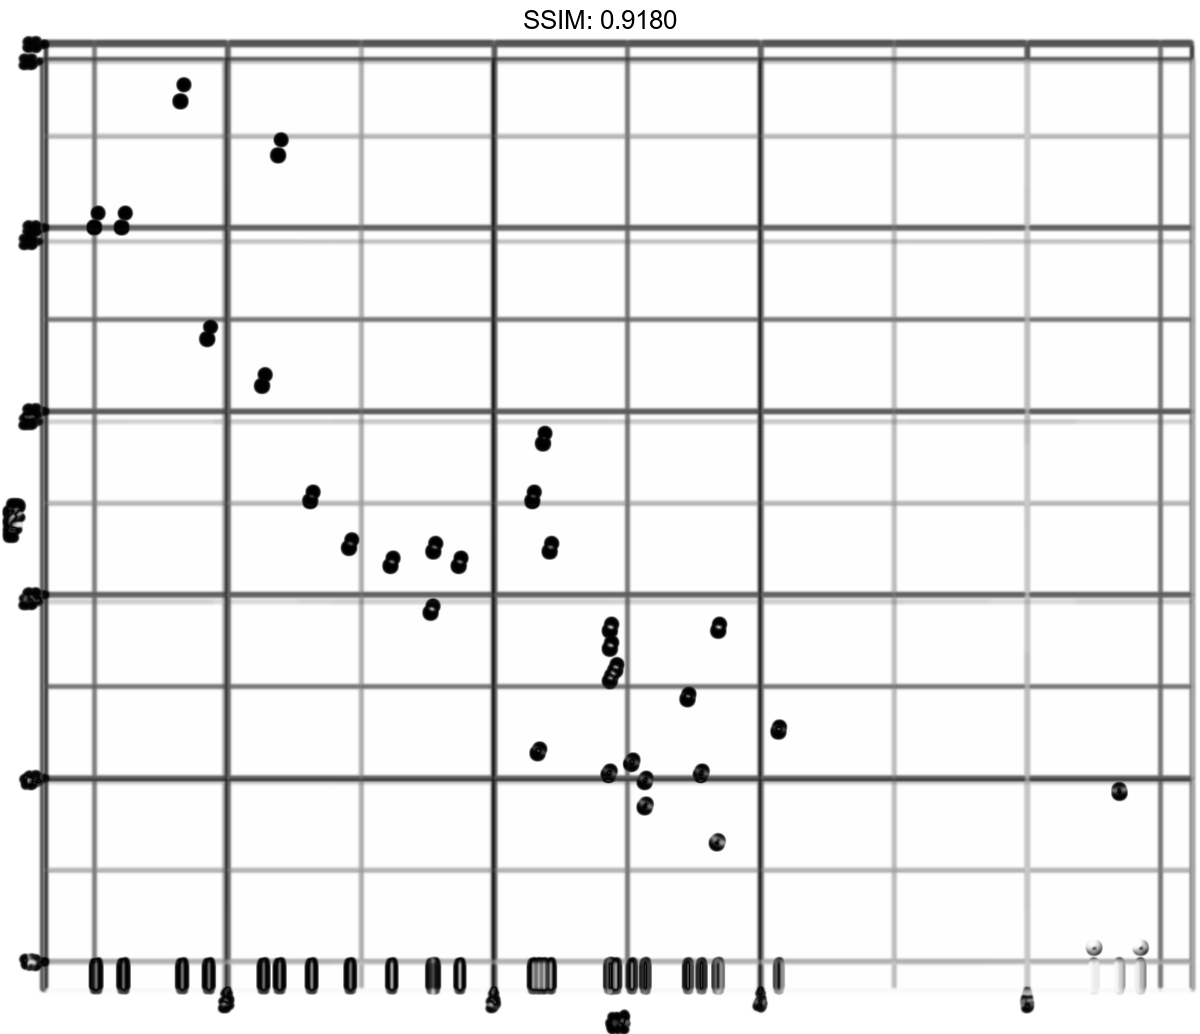
p <- ggplot(mtcars, aes(wt, mpg)) +
  geom_point()
p <- p + geom_rug(sides="b")    # Rug on bottom only
plotly::ggplotly(p)

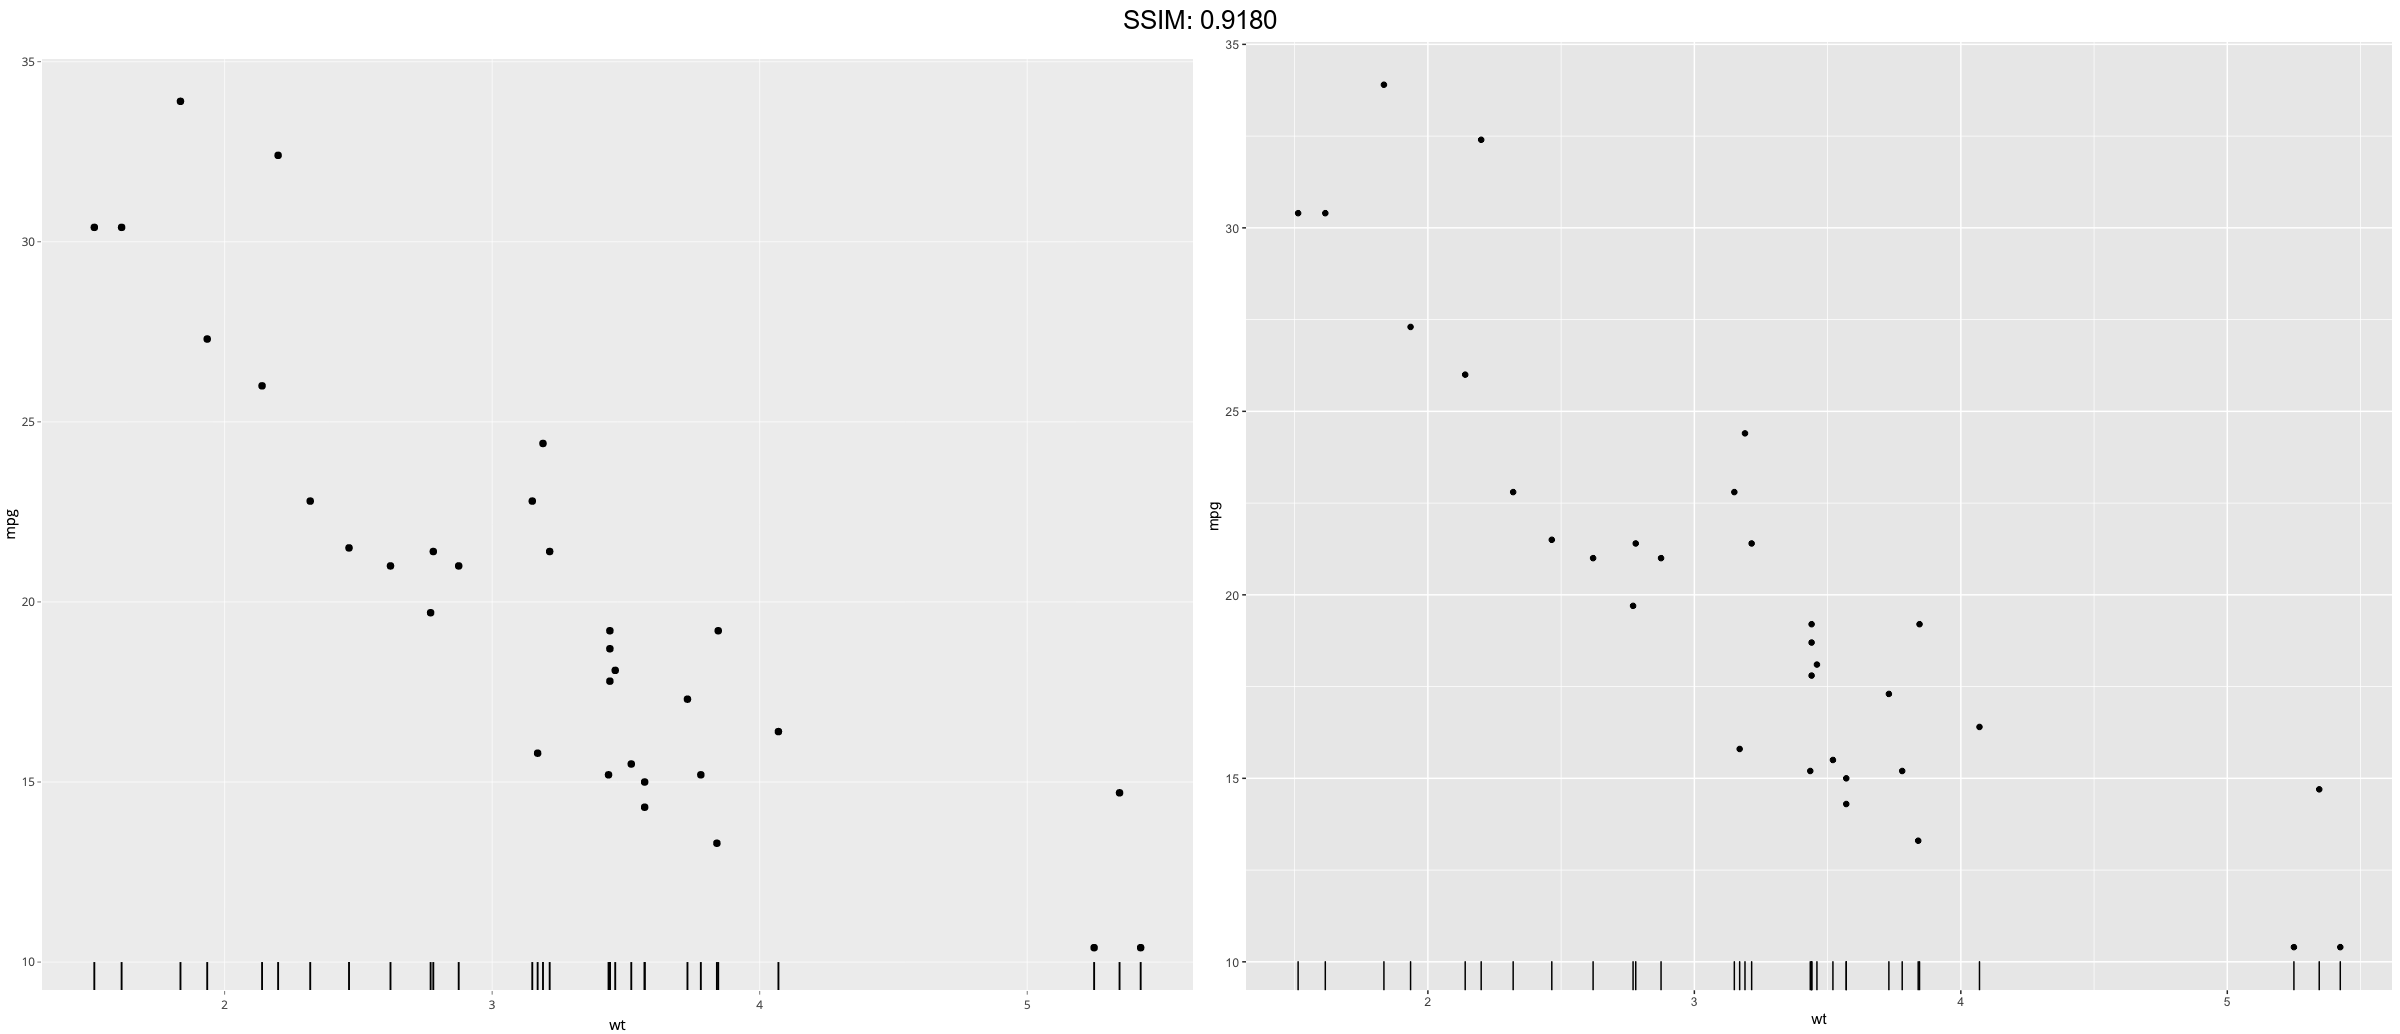
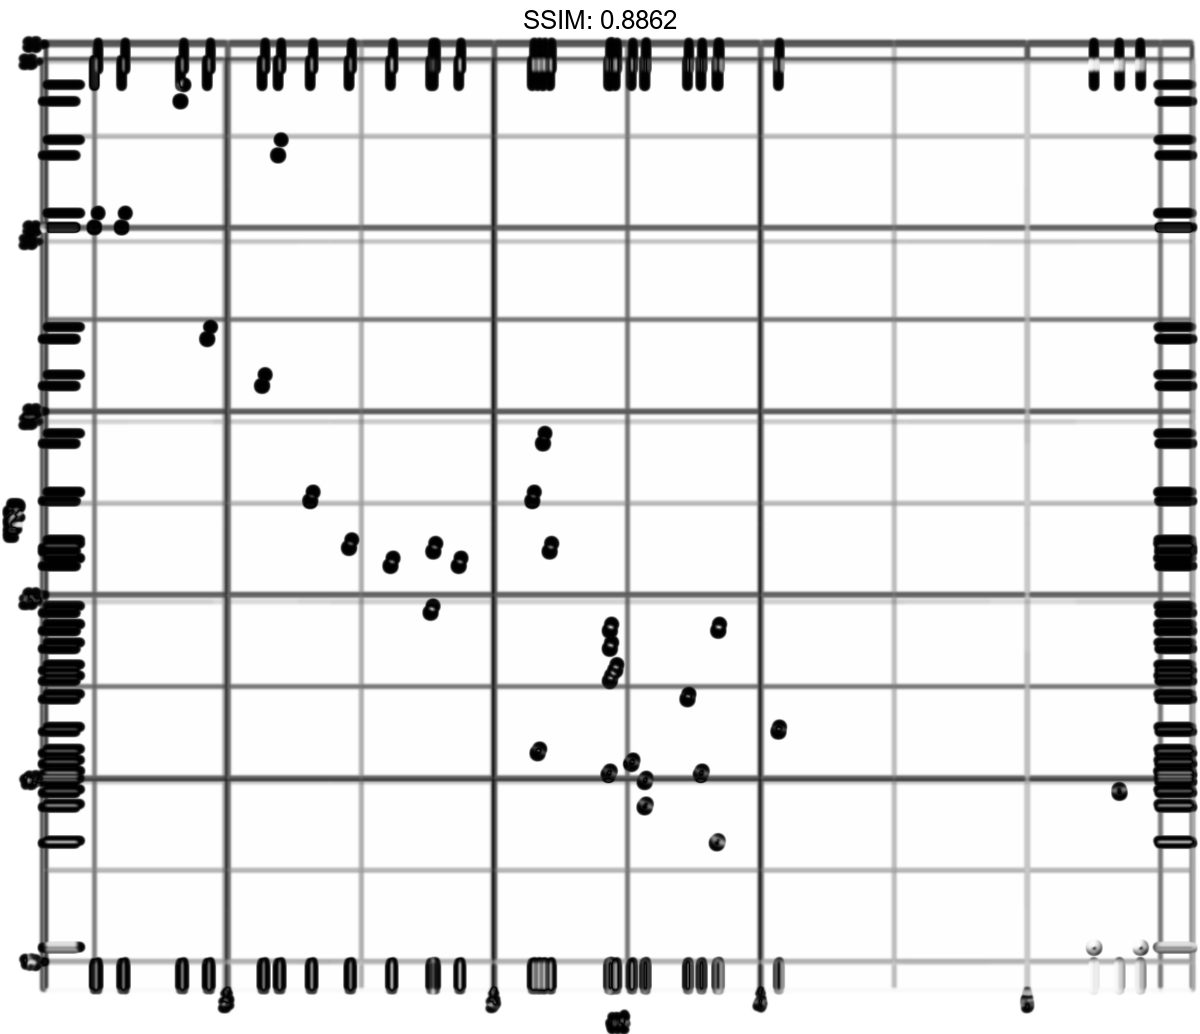
p <- ggplot(mtcars, aes(wt, mpg)) +
  geom_point()
p <- p + geom_rug(sides="trbl") # All four sides
plotly::ggplotly(p)


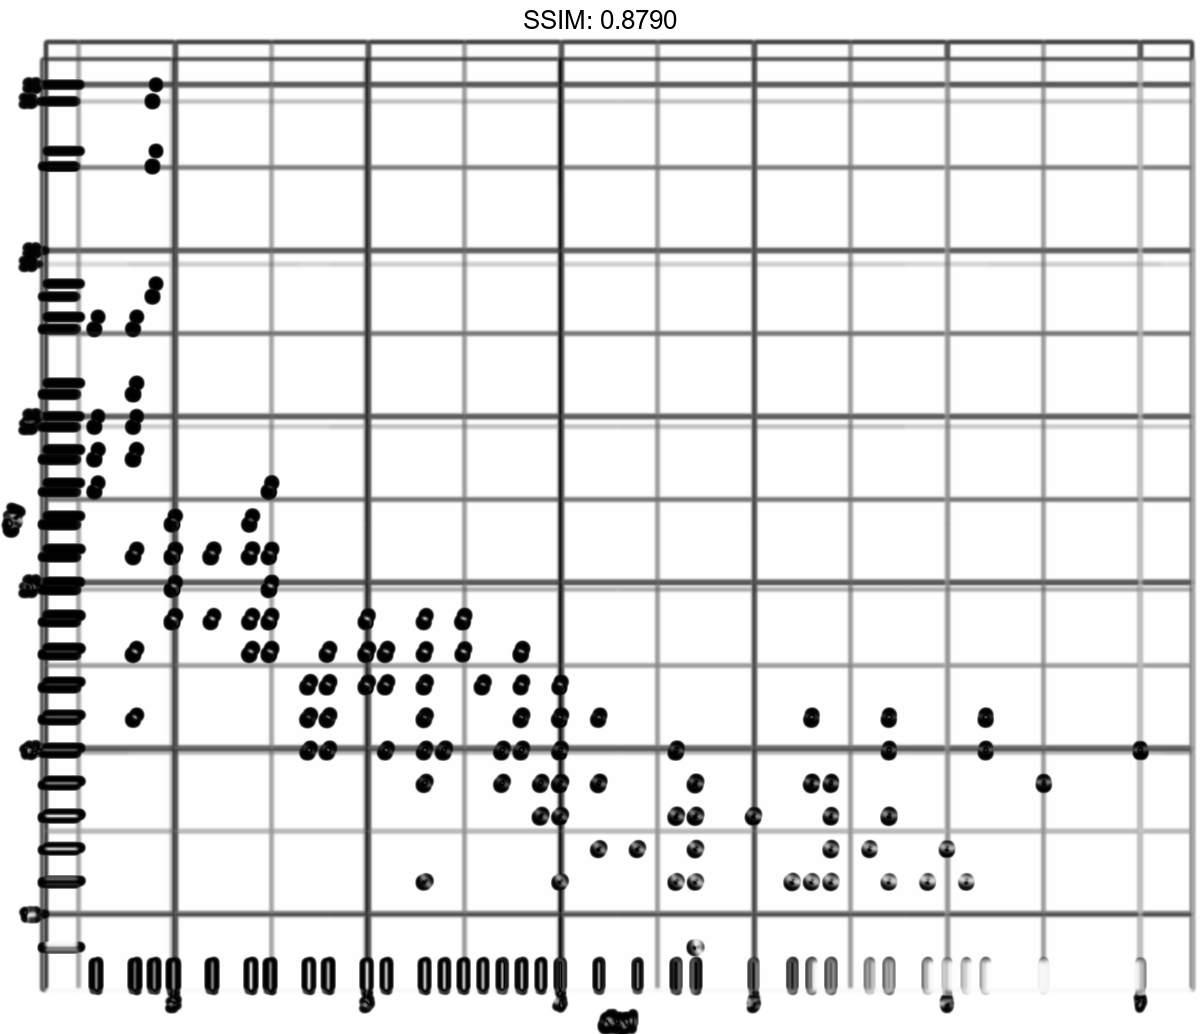
p <-
 ggplot(mpg, aes(displ, cty)) +
  geom_point() +
  geom_rug()
plotly::ggplotly(p)


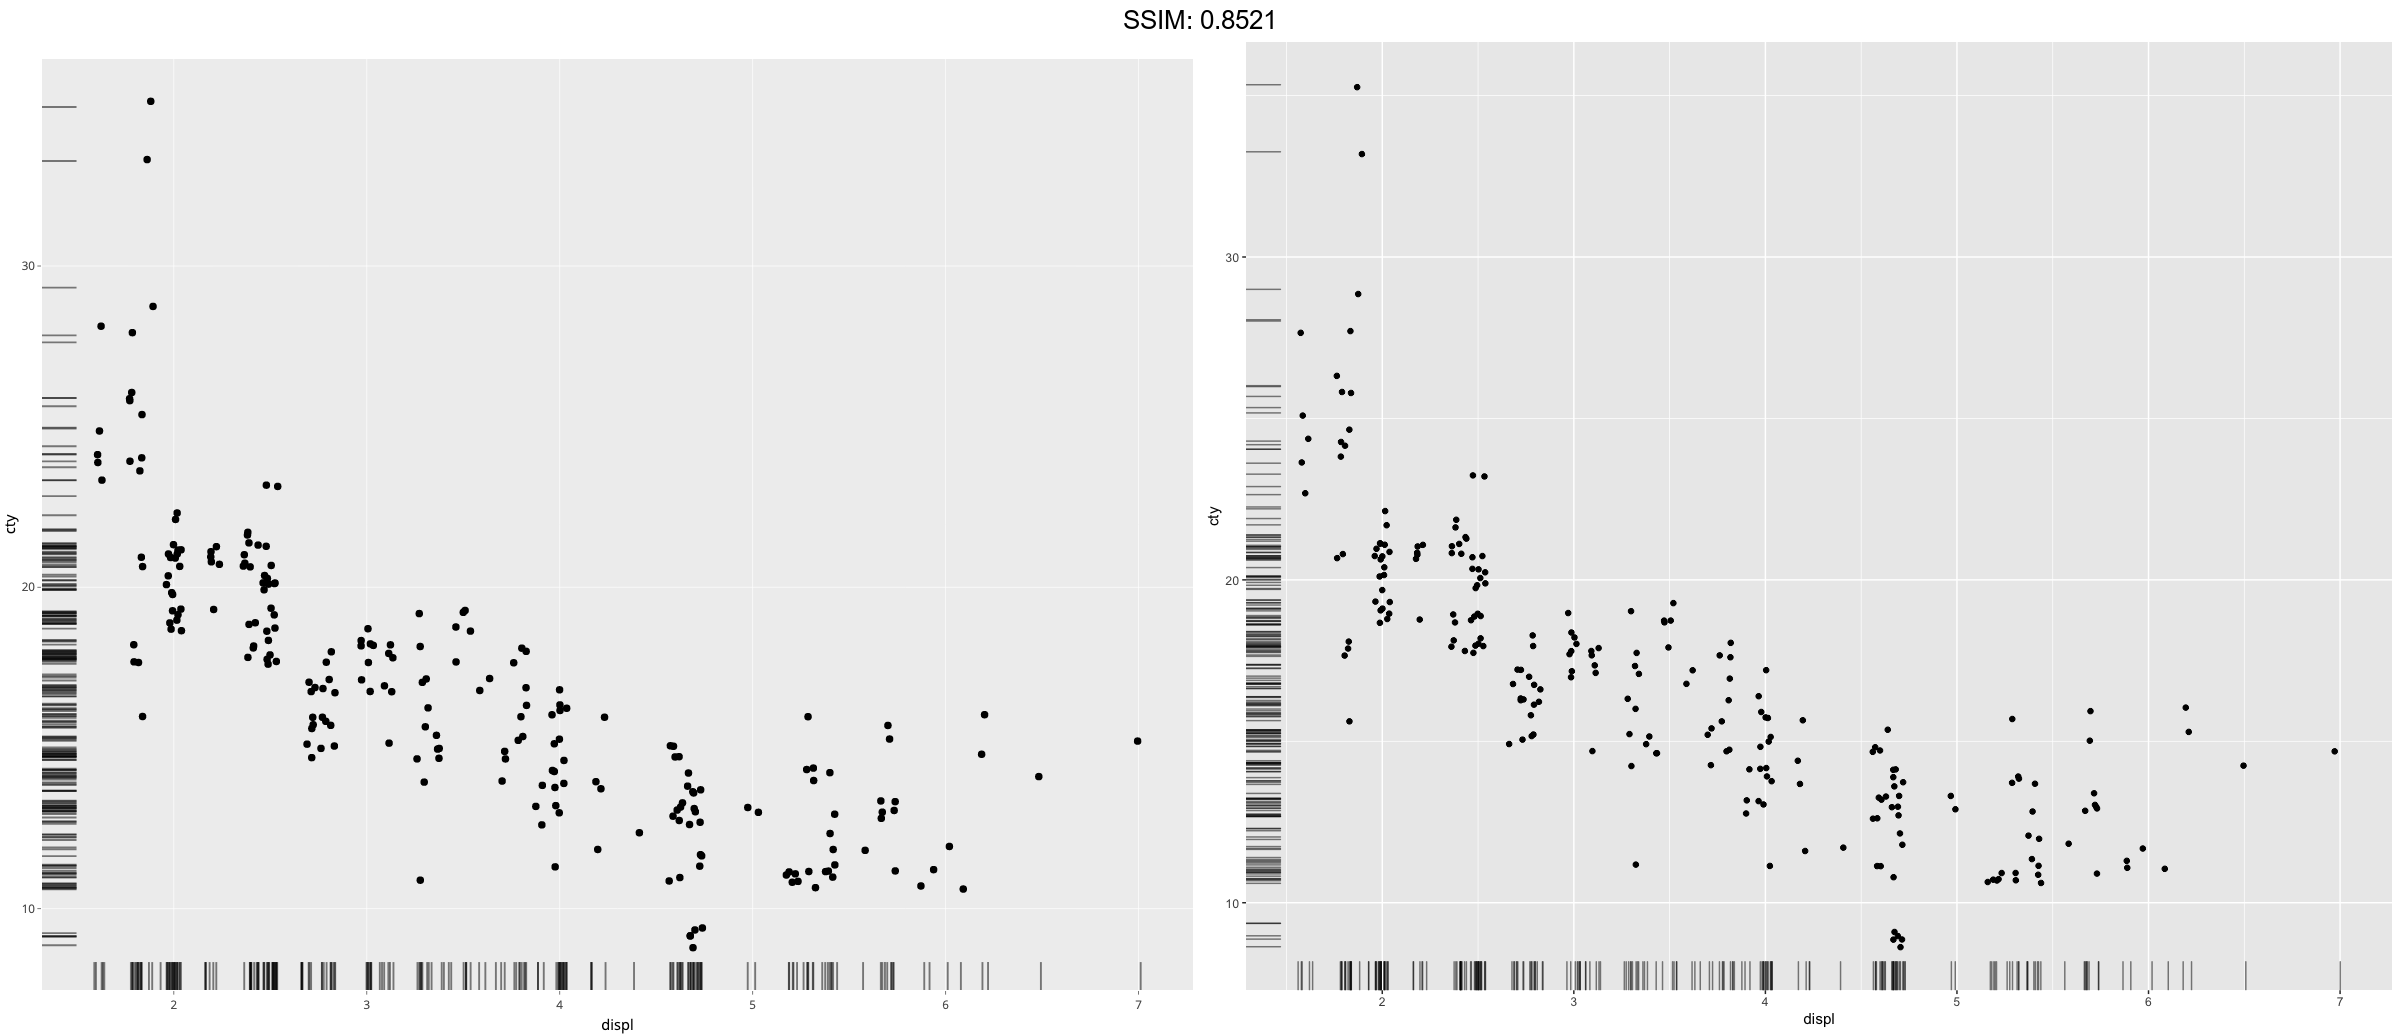
p <-
 ggplot(mpg, aes(displ, cty)) +
  geom_jitter() +
  geom_rug(alpha = 1/2, position = "jitter")
plotly::ggplotly(p)

p <- ggplot(mtcars, aes(wt, mpg)) +
  geom_point()
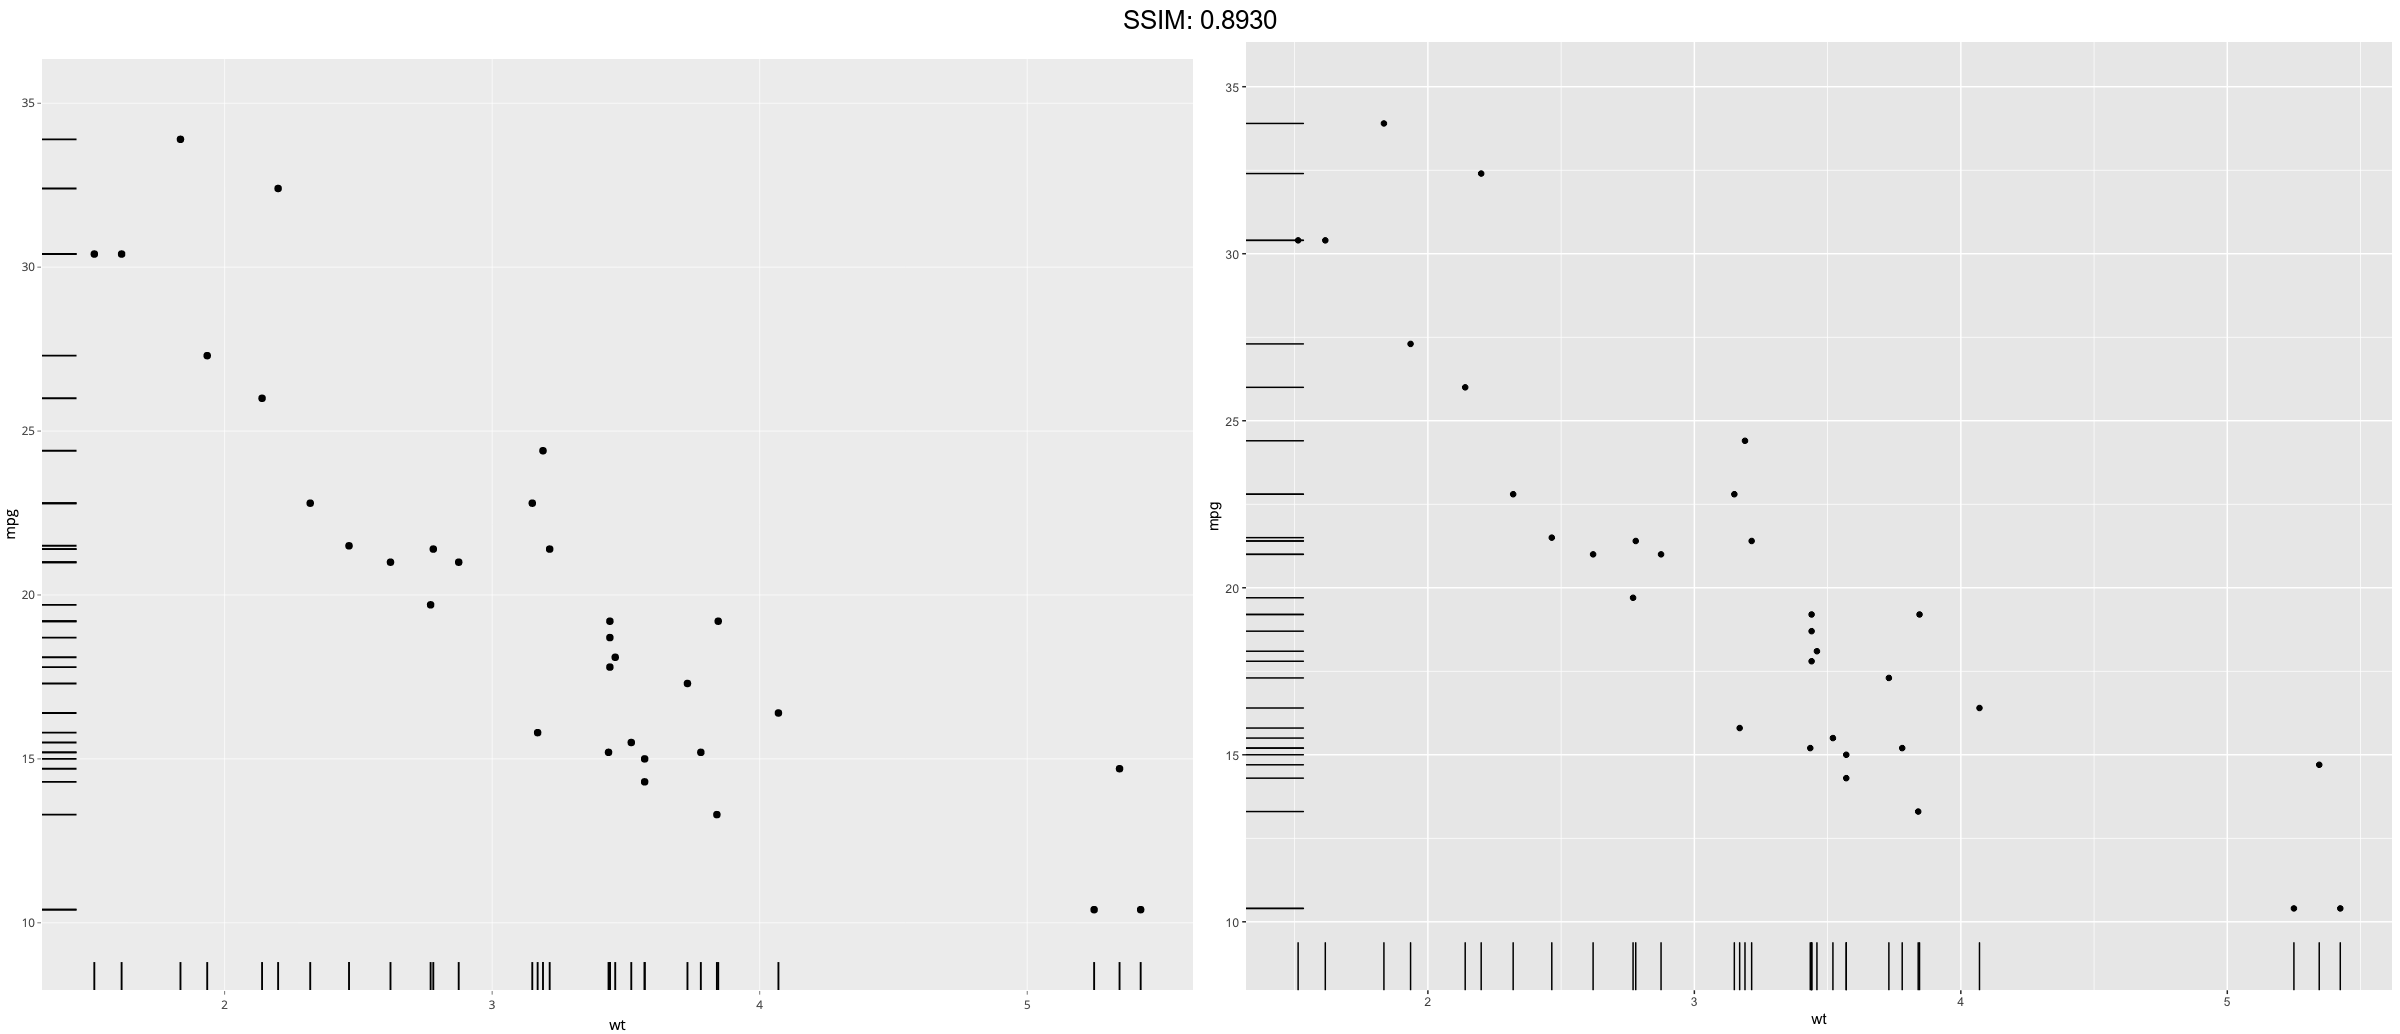
p <-
 p +
  geom_rug(outside = TRUE) +
  coord_cartesian(clip = "off")
plotly::ggplotly(p)

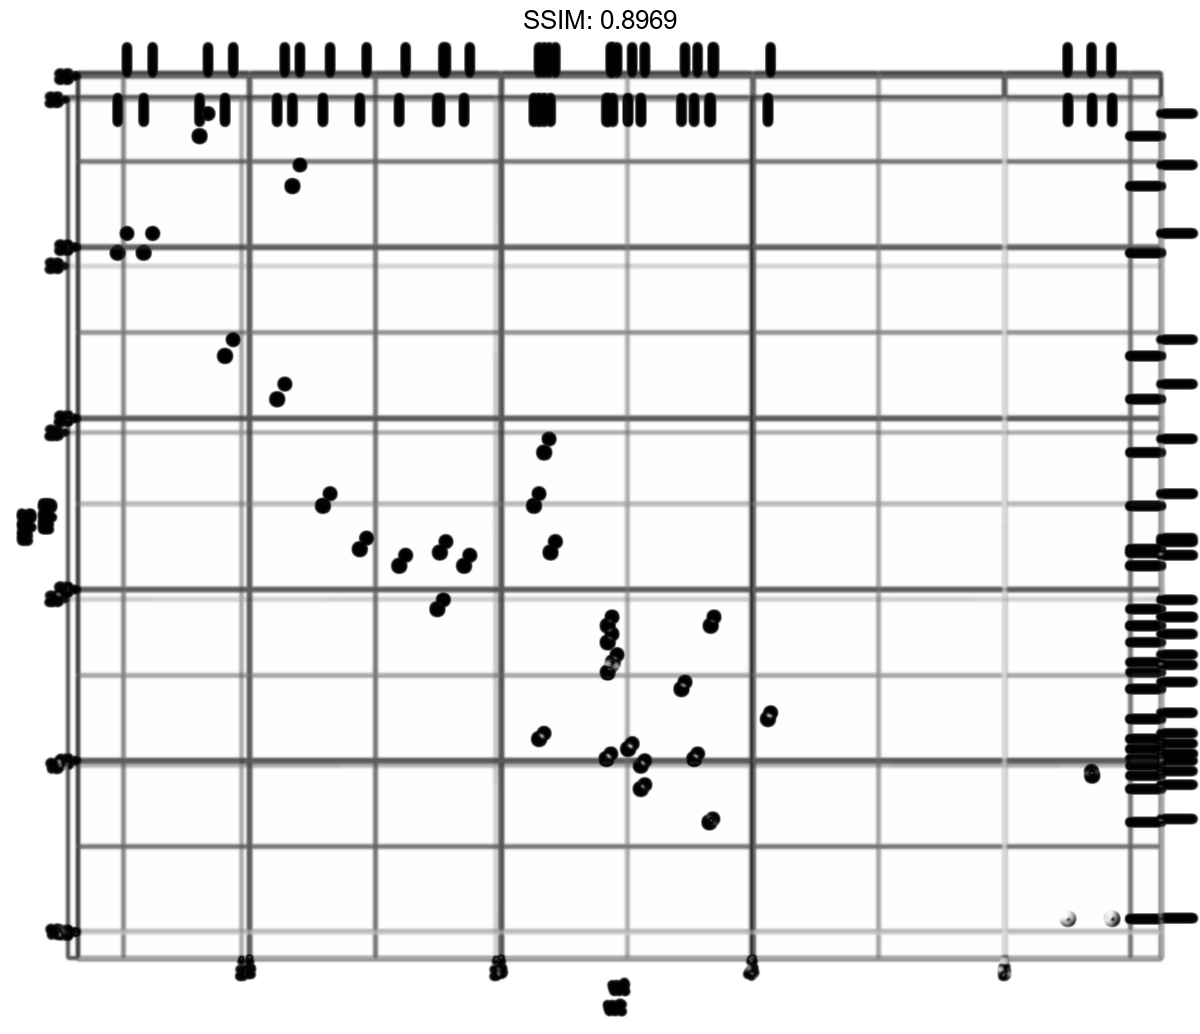
p <- ggplot(mtcars, aes(wt, mpg)) +
  geom_point()
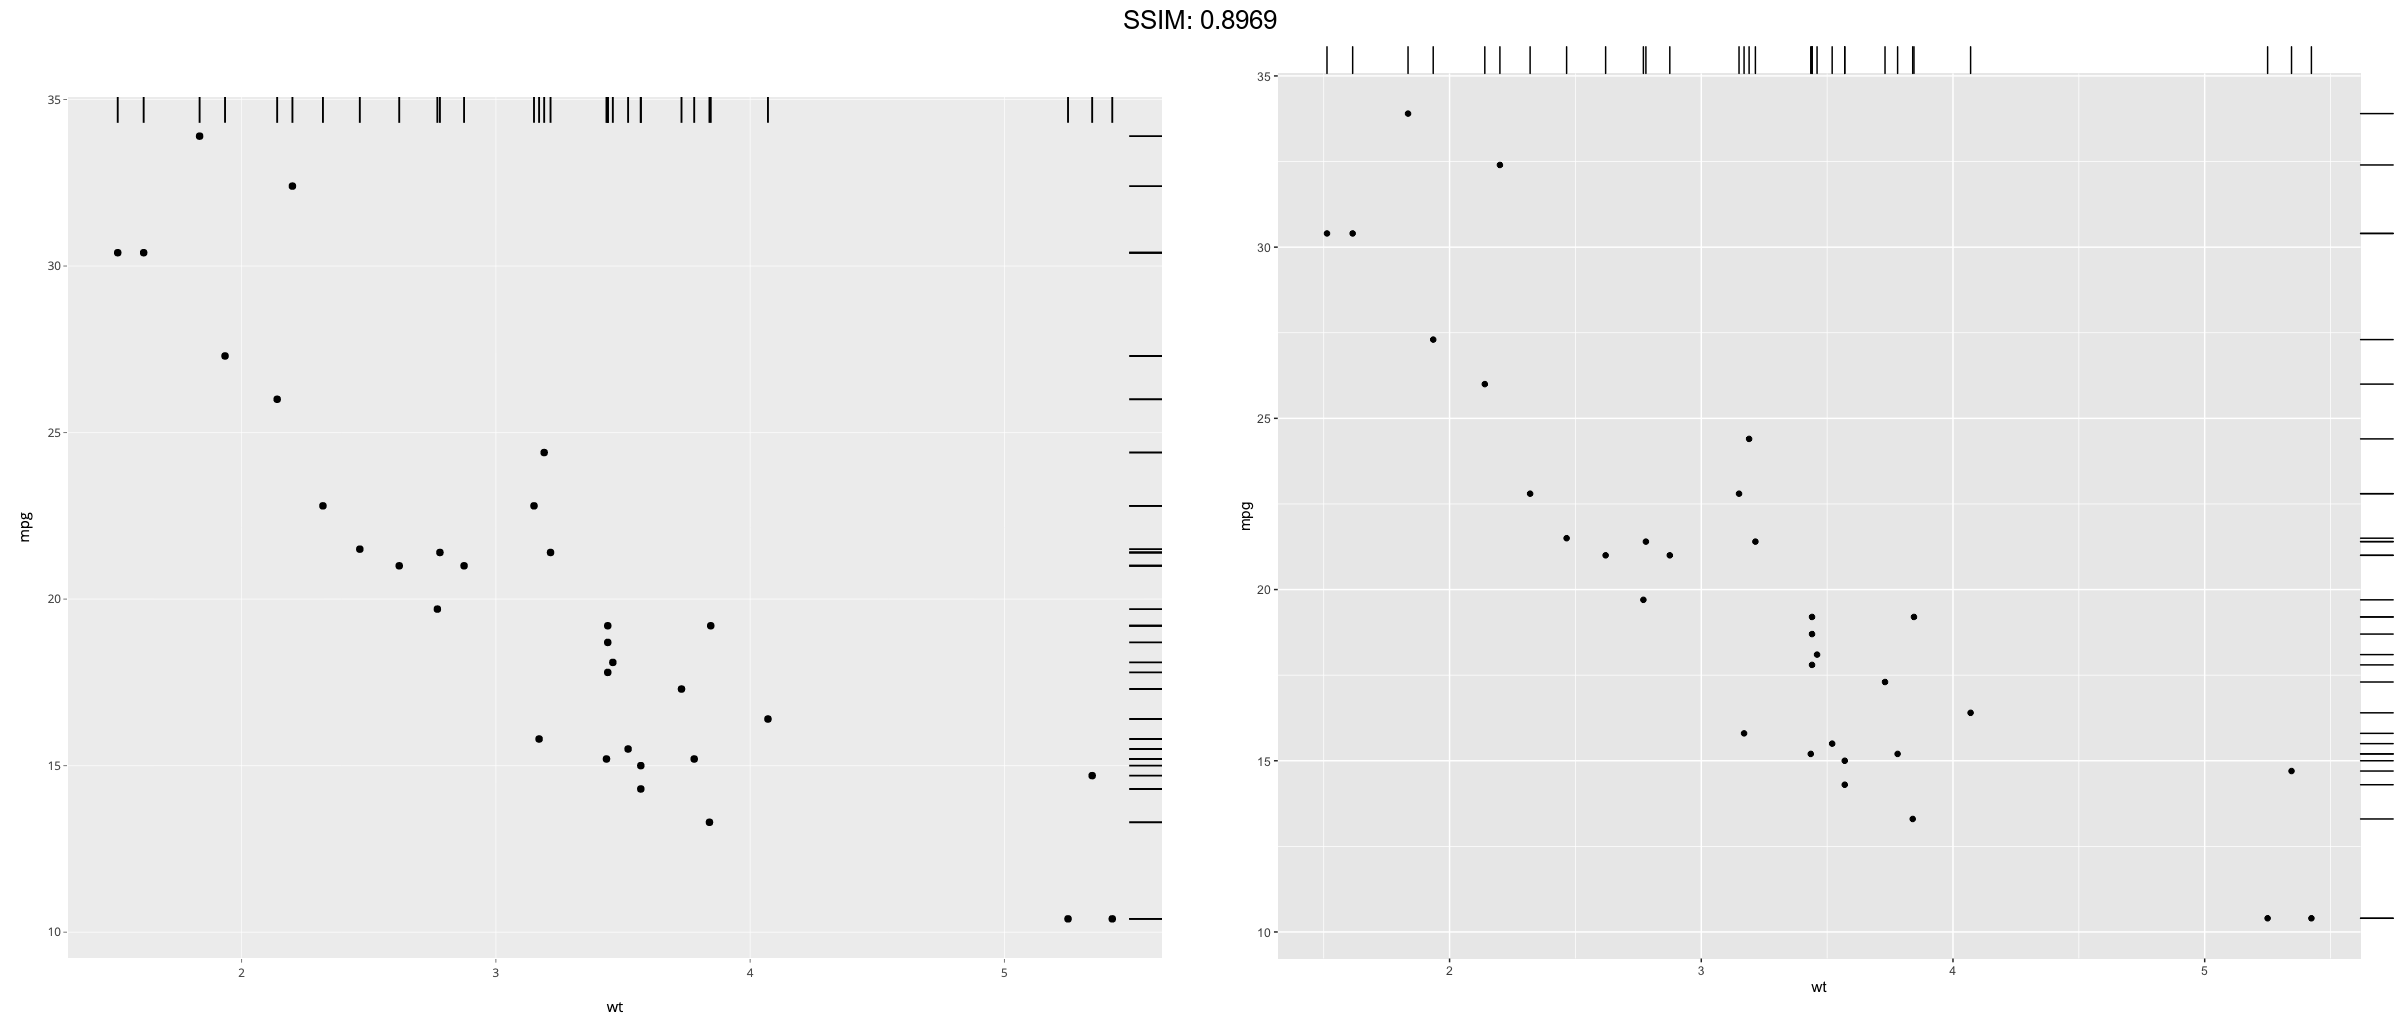
p <-
 p +
  geom_rug(outside = TRUE, sides = "tr") +
  coord_cartesian(clip = "off") +
  theme(plot.margin = margin(1, 1, 1, 1, "cm"))
plotly::ggplotly(p)

p <- ggplot(mtcars, aes(wt, mpg)) +
  geom_point()
p <-
 p +
  geom_rug(length = unit(0.05, "npc")) +
  scale_y_continuous(expand = c(0.1, 0.1))
plotly::ggplotly(p)


