GGPLOT - geom_ribbon
For each x value, it displays a y interval defined by ymin and ymax and then convert them with ggplotly
huron <- data.frame(year = 1875:1972, level = as.vector(LakeHuron))
h <- ggplot(huron, aes(year))
p <-  h + geom_ribbon(aes(ymin=0, ymax=level))
plotly::ggplotly(p)

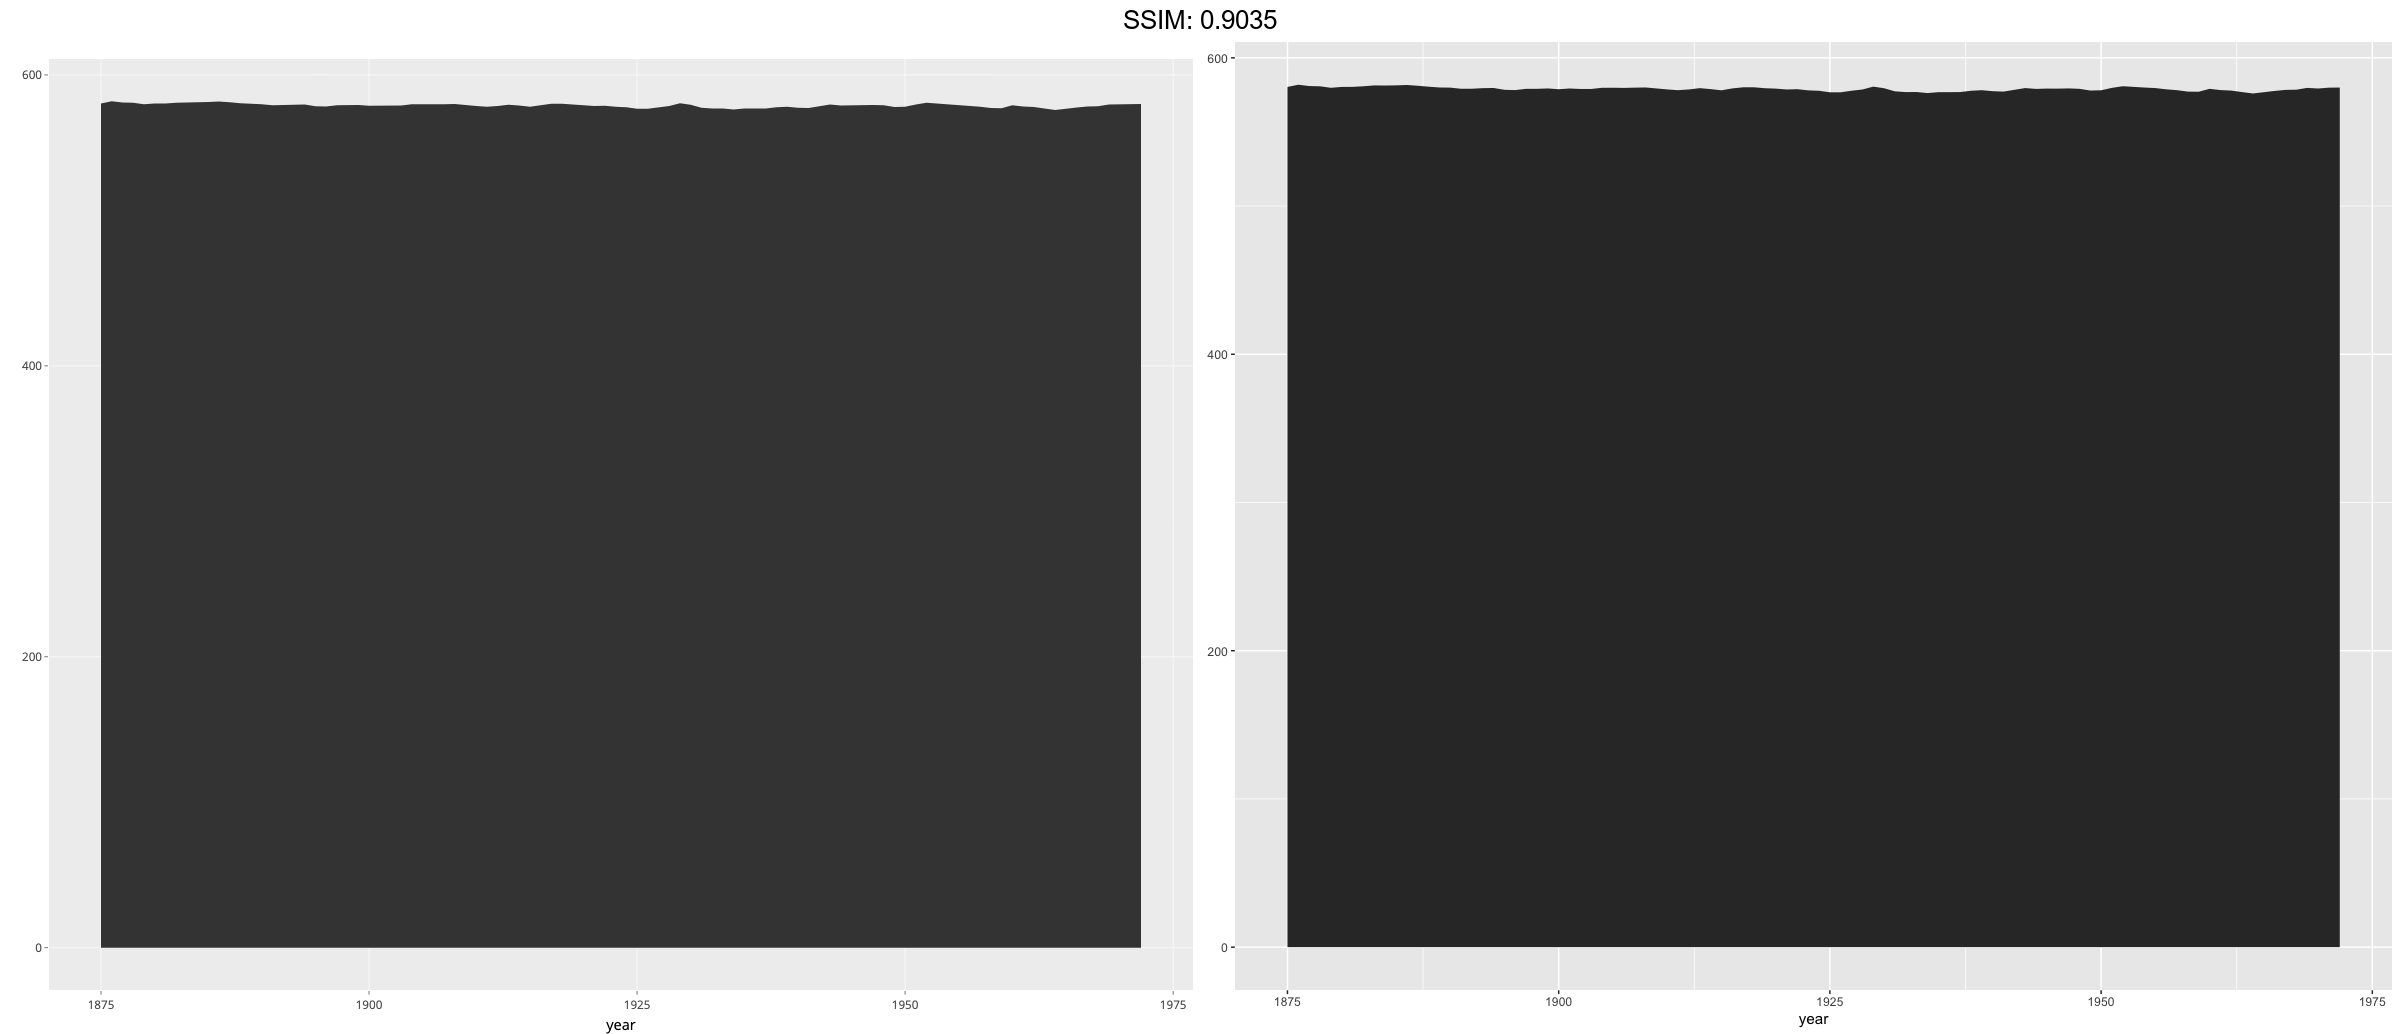
huron <- data.frame(year = 1875:1972, level = as.vector(LakeHuron))
h <- ggplot(huron, aes(year))
p <-  h + geom_area(aes(y = level))
plotly::ggplotly(p)
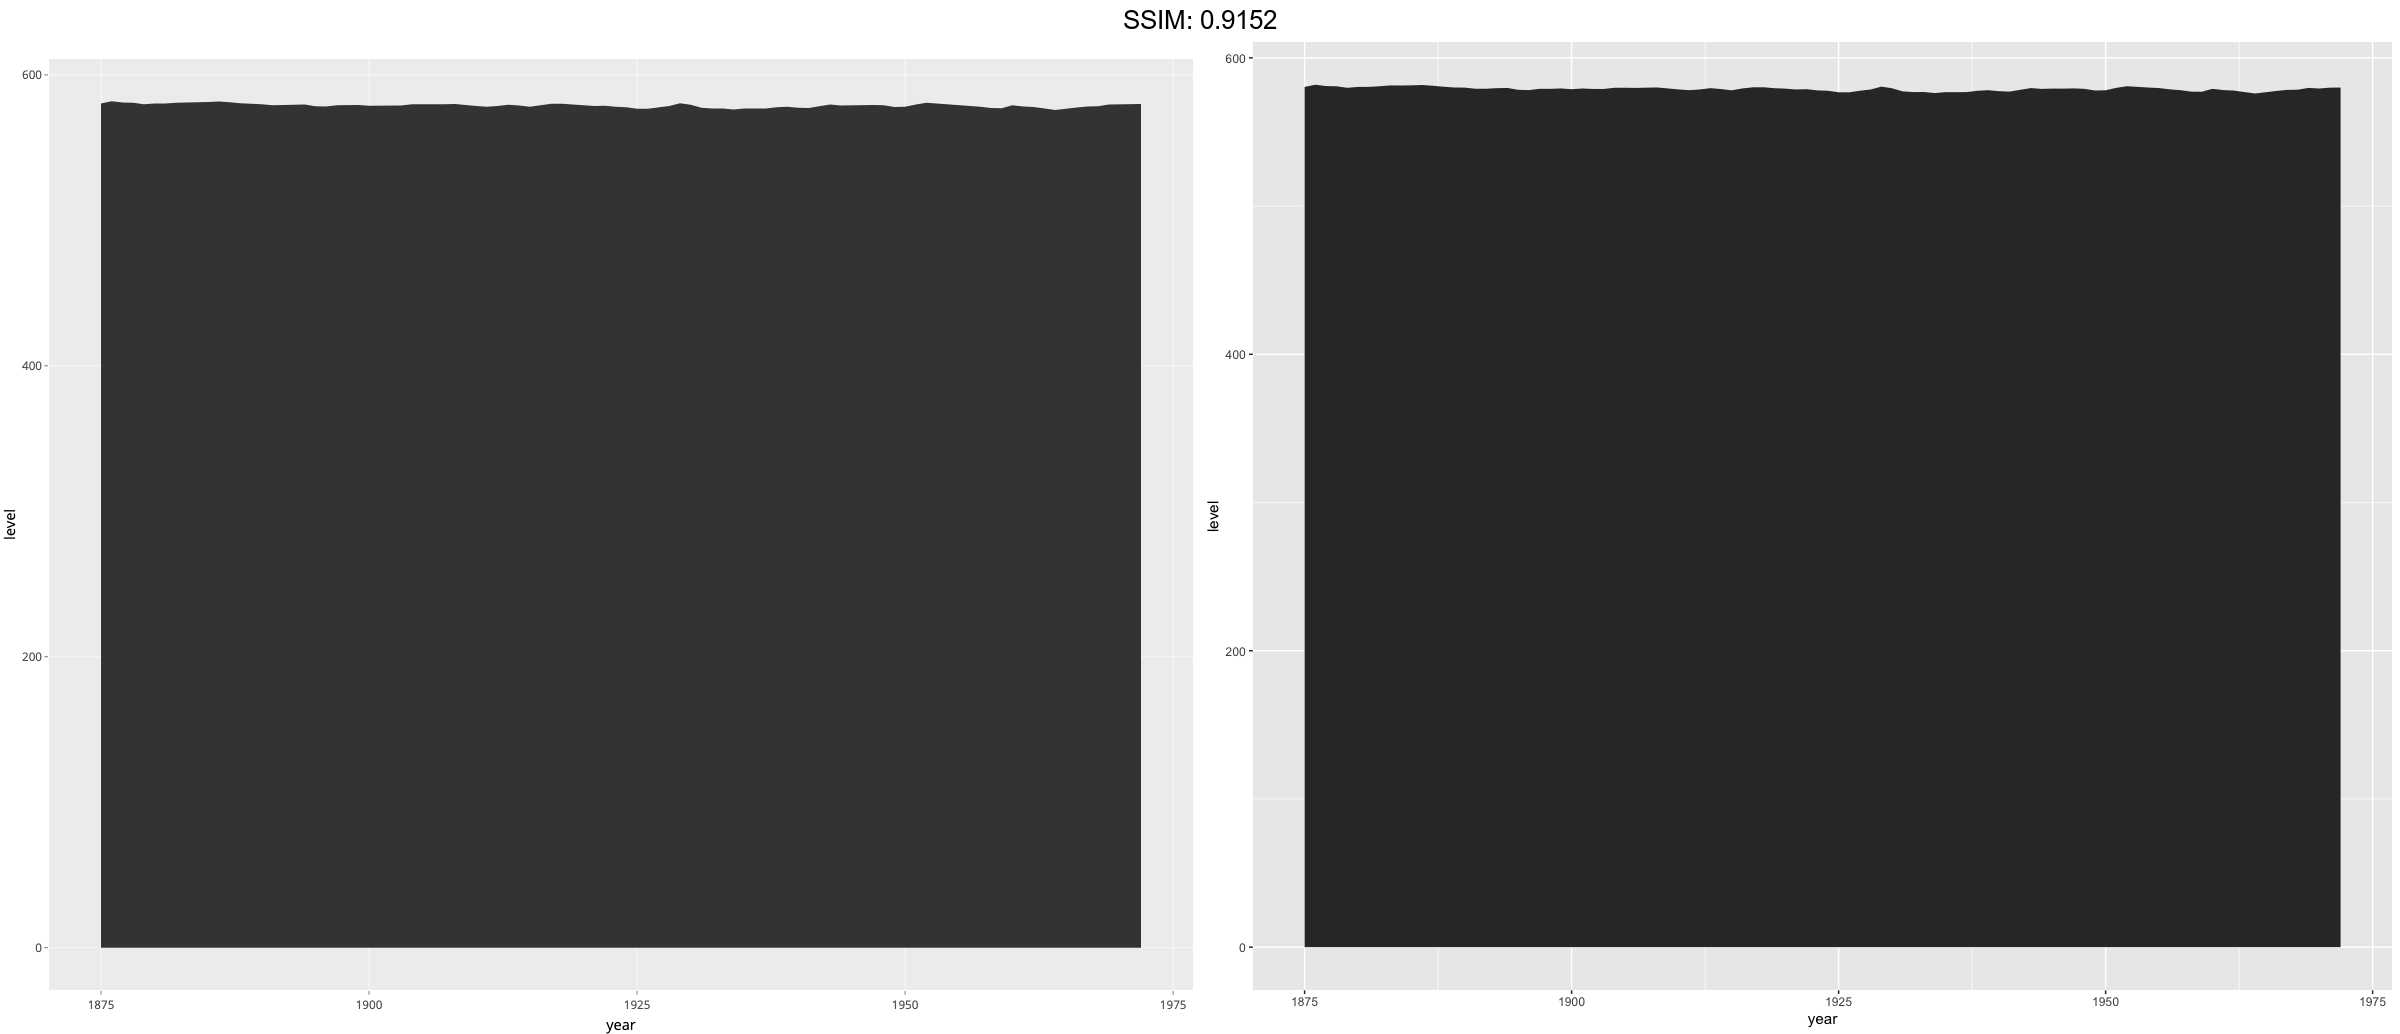
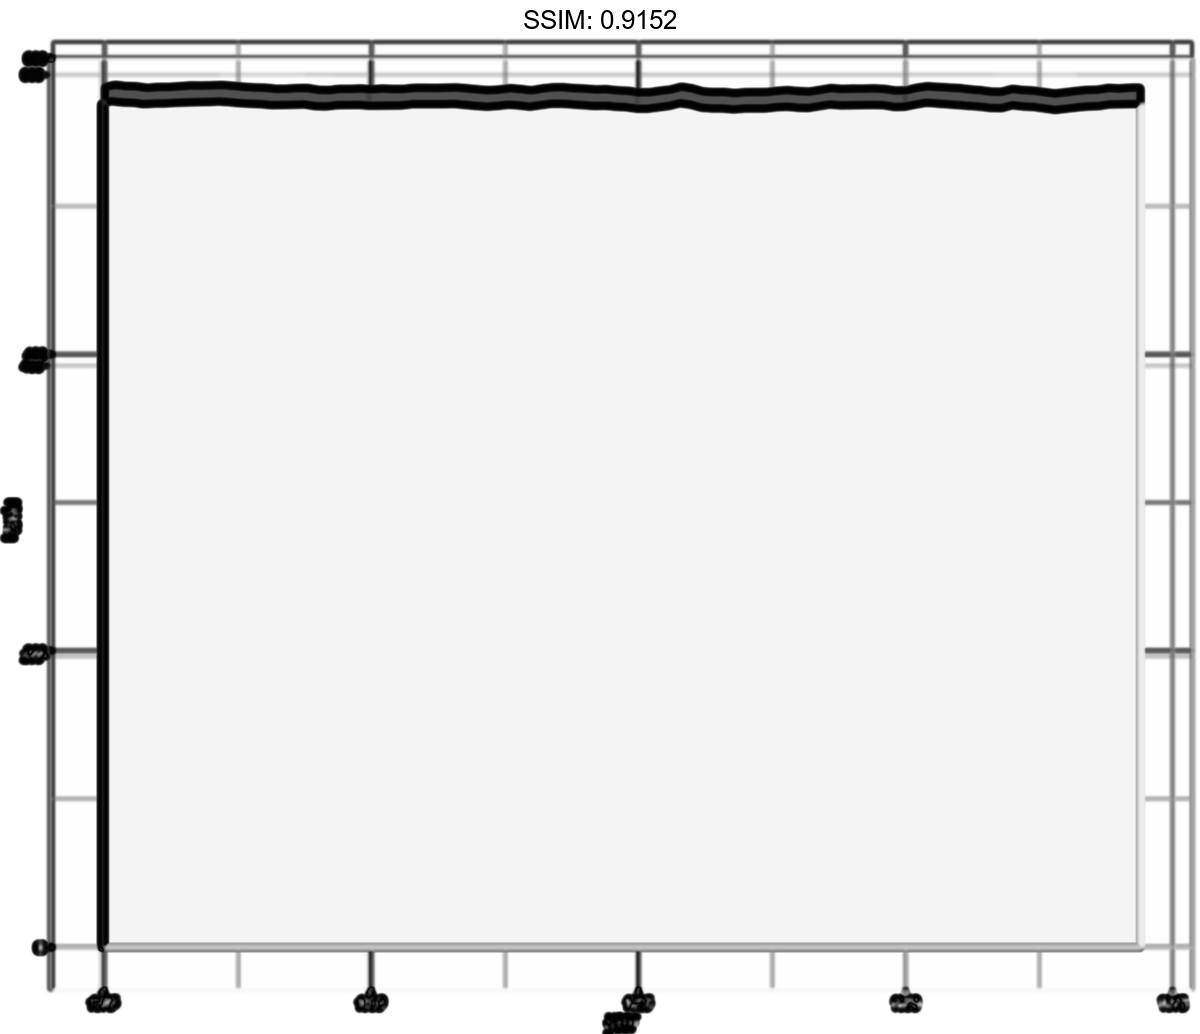
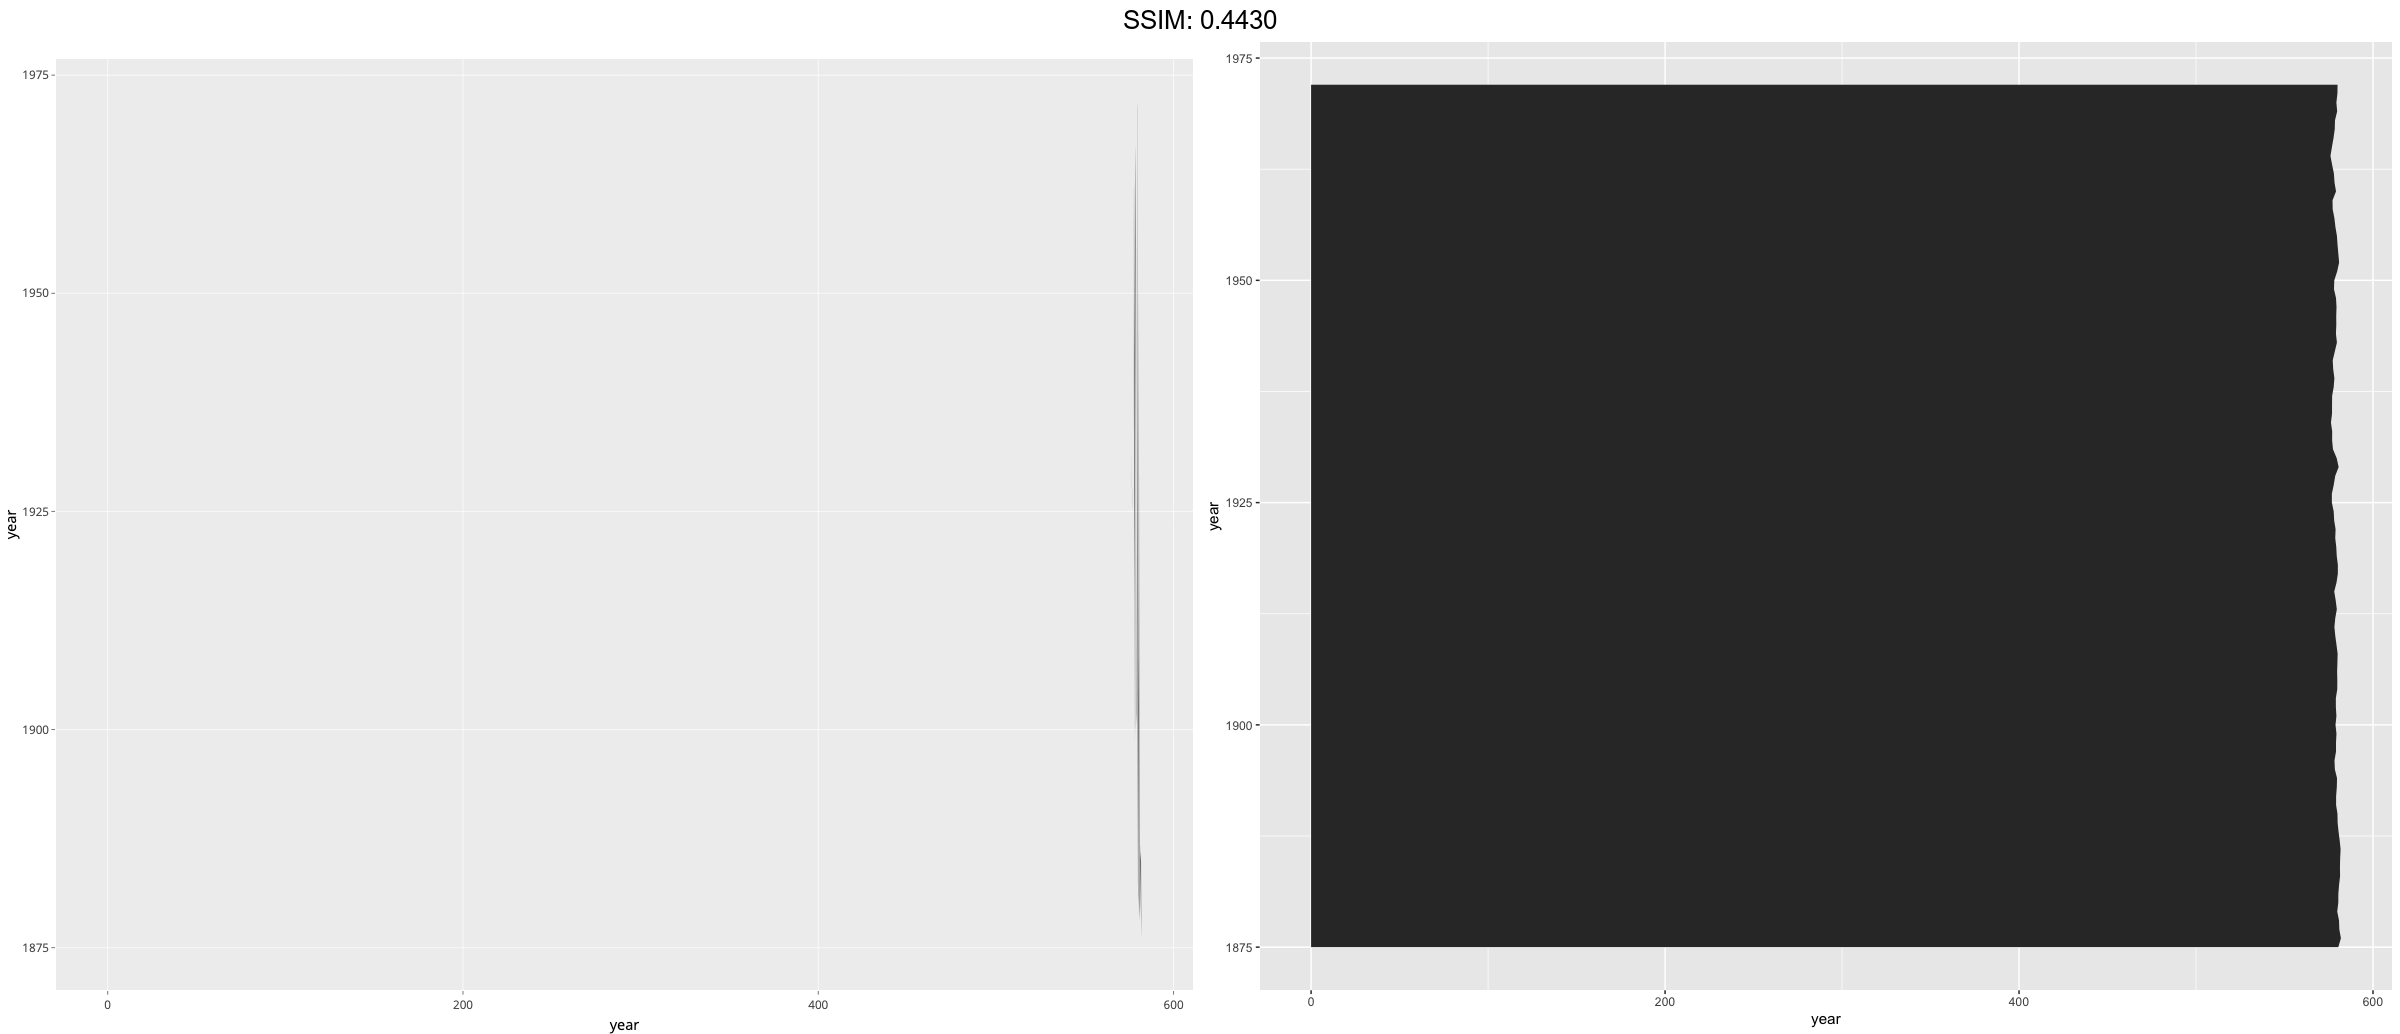
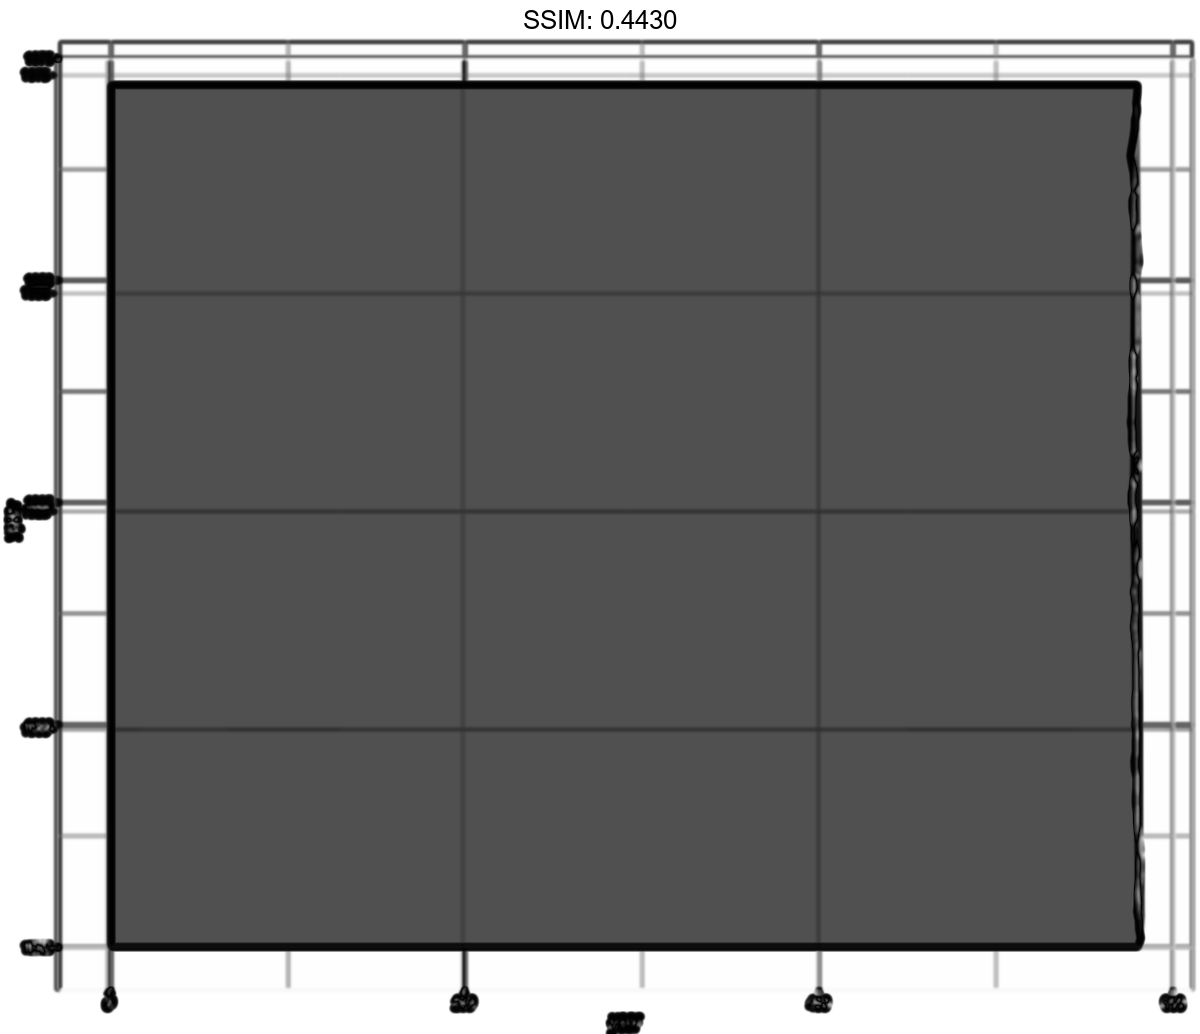
huron <- data.frame(year = 1875:1972, level = as.vector(LakeHuron))
h <- ggplot(huron, aes(year))
p <-  h + geom_area(aes(x = level, y = year), orientation = "y")
plotly::ggplotly(p)
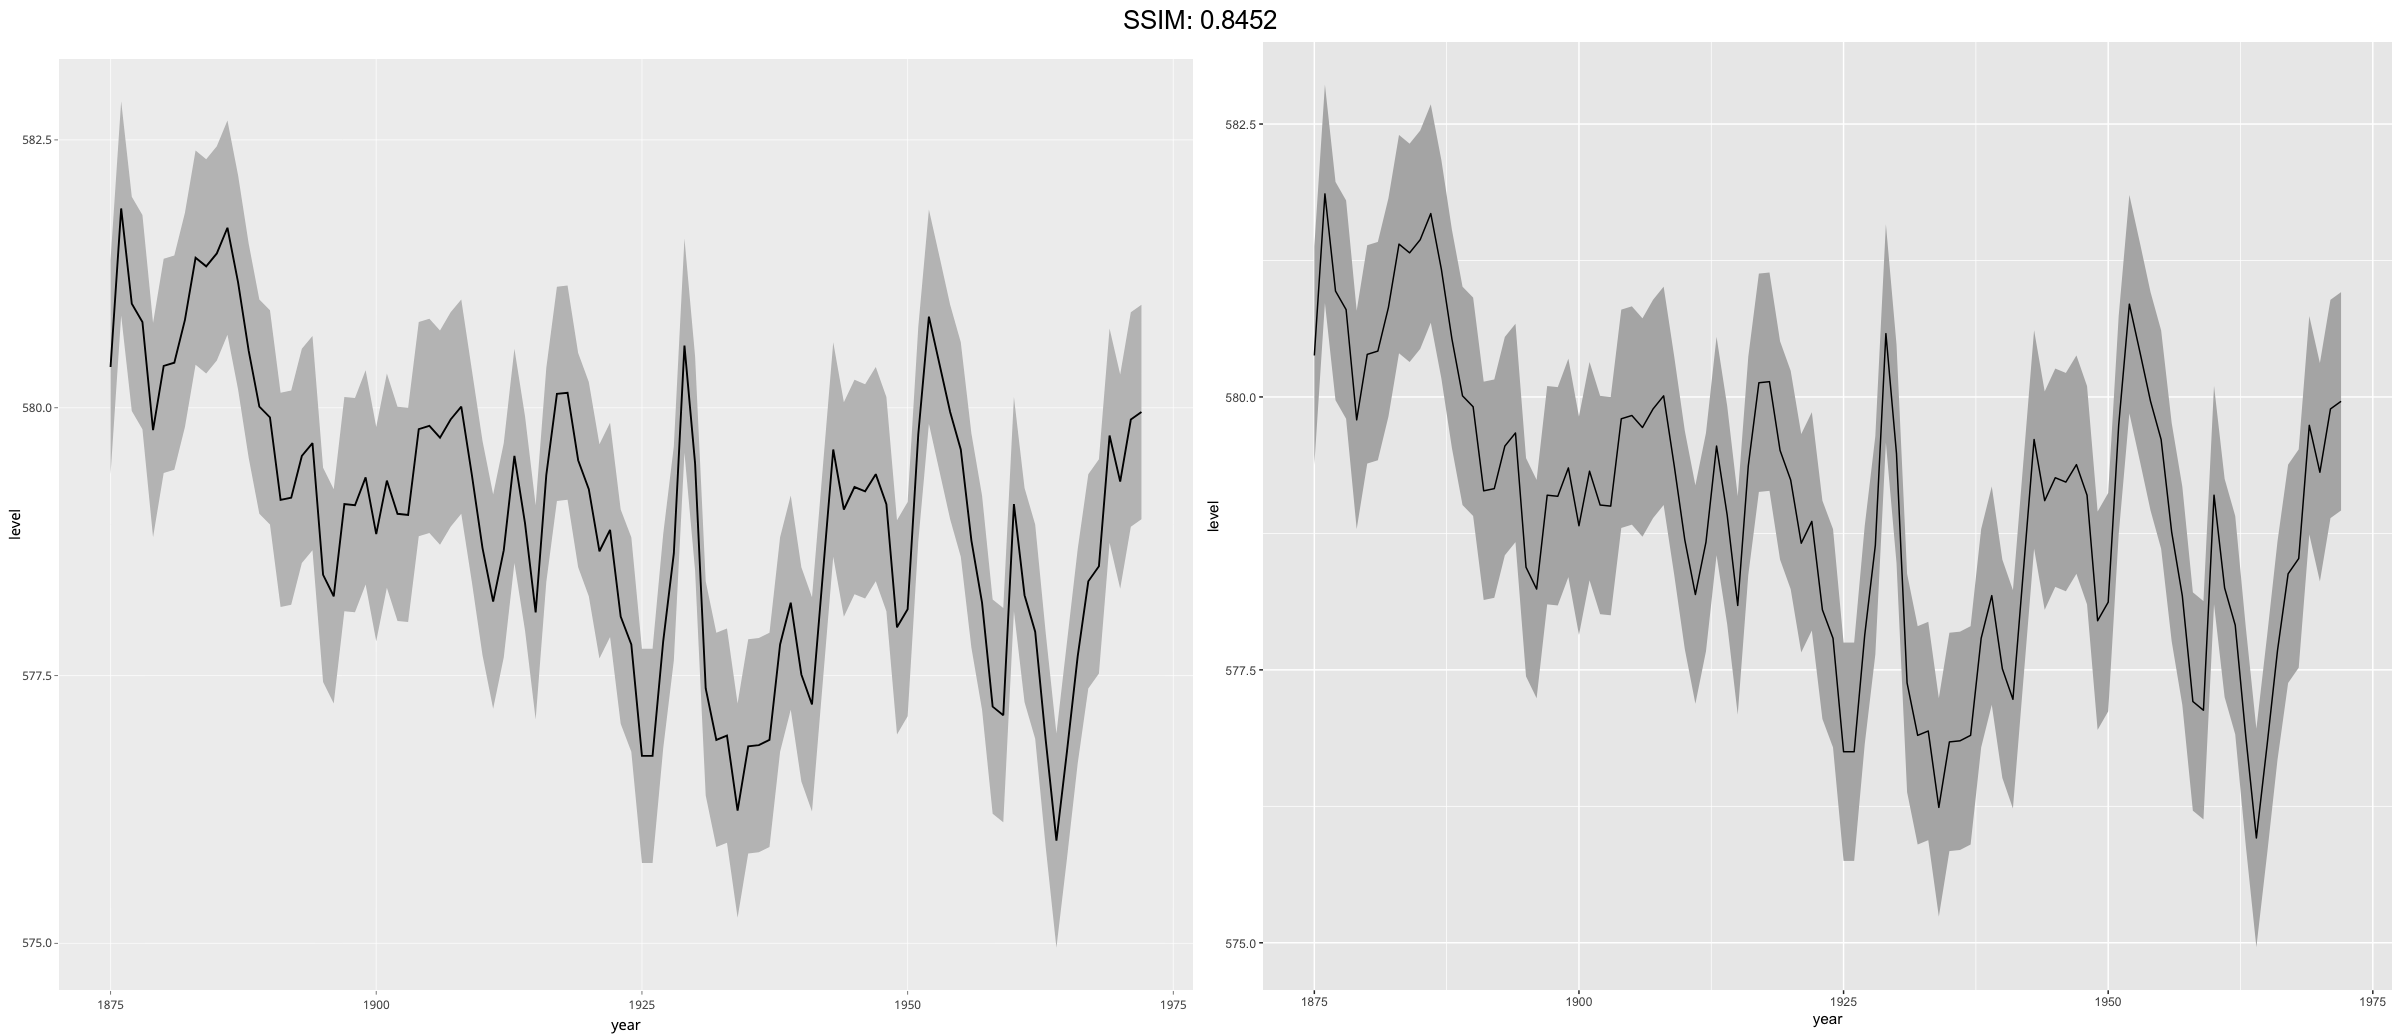
huron <- data.frame(year = 1875:1972, level = as.vector(LakeHuron))
h <- ggplot(huron, aes(year))
p <-
 h +
  geom_ribbon(aes(ymin = level - 1, ymax = level + 1), fill = "grey70") +
  geom_line(aes(y = level))
plotly::ggplotly(p)