GGPLOT - geom_quantile
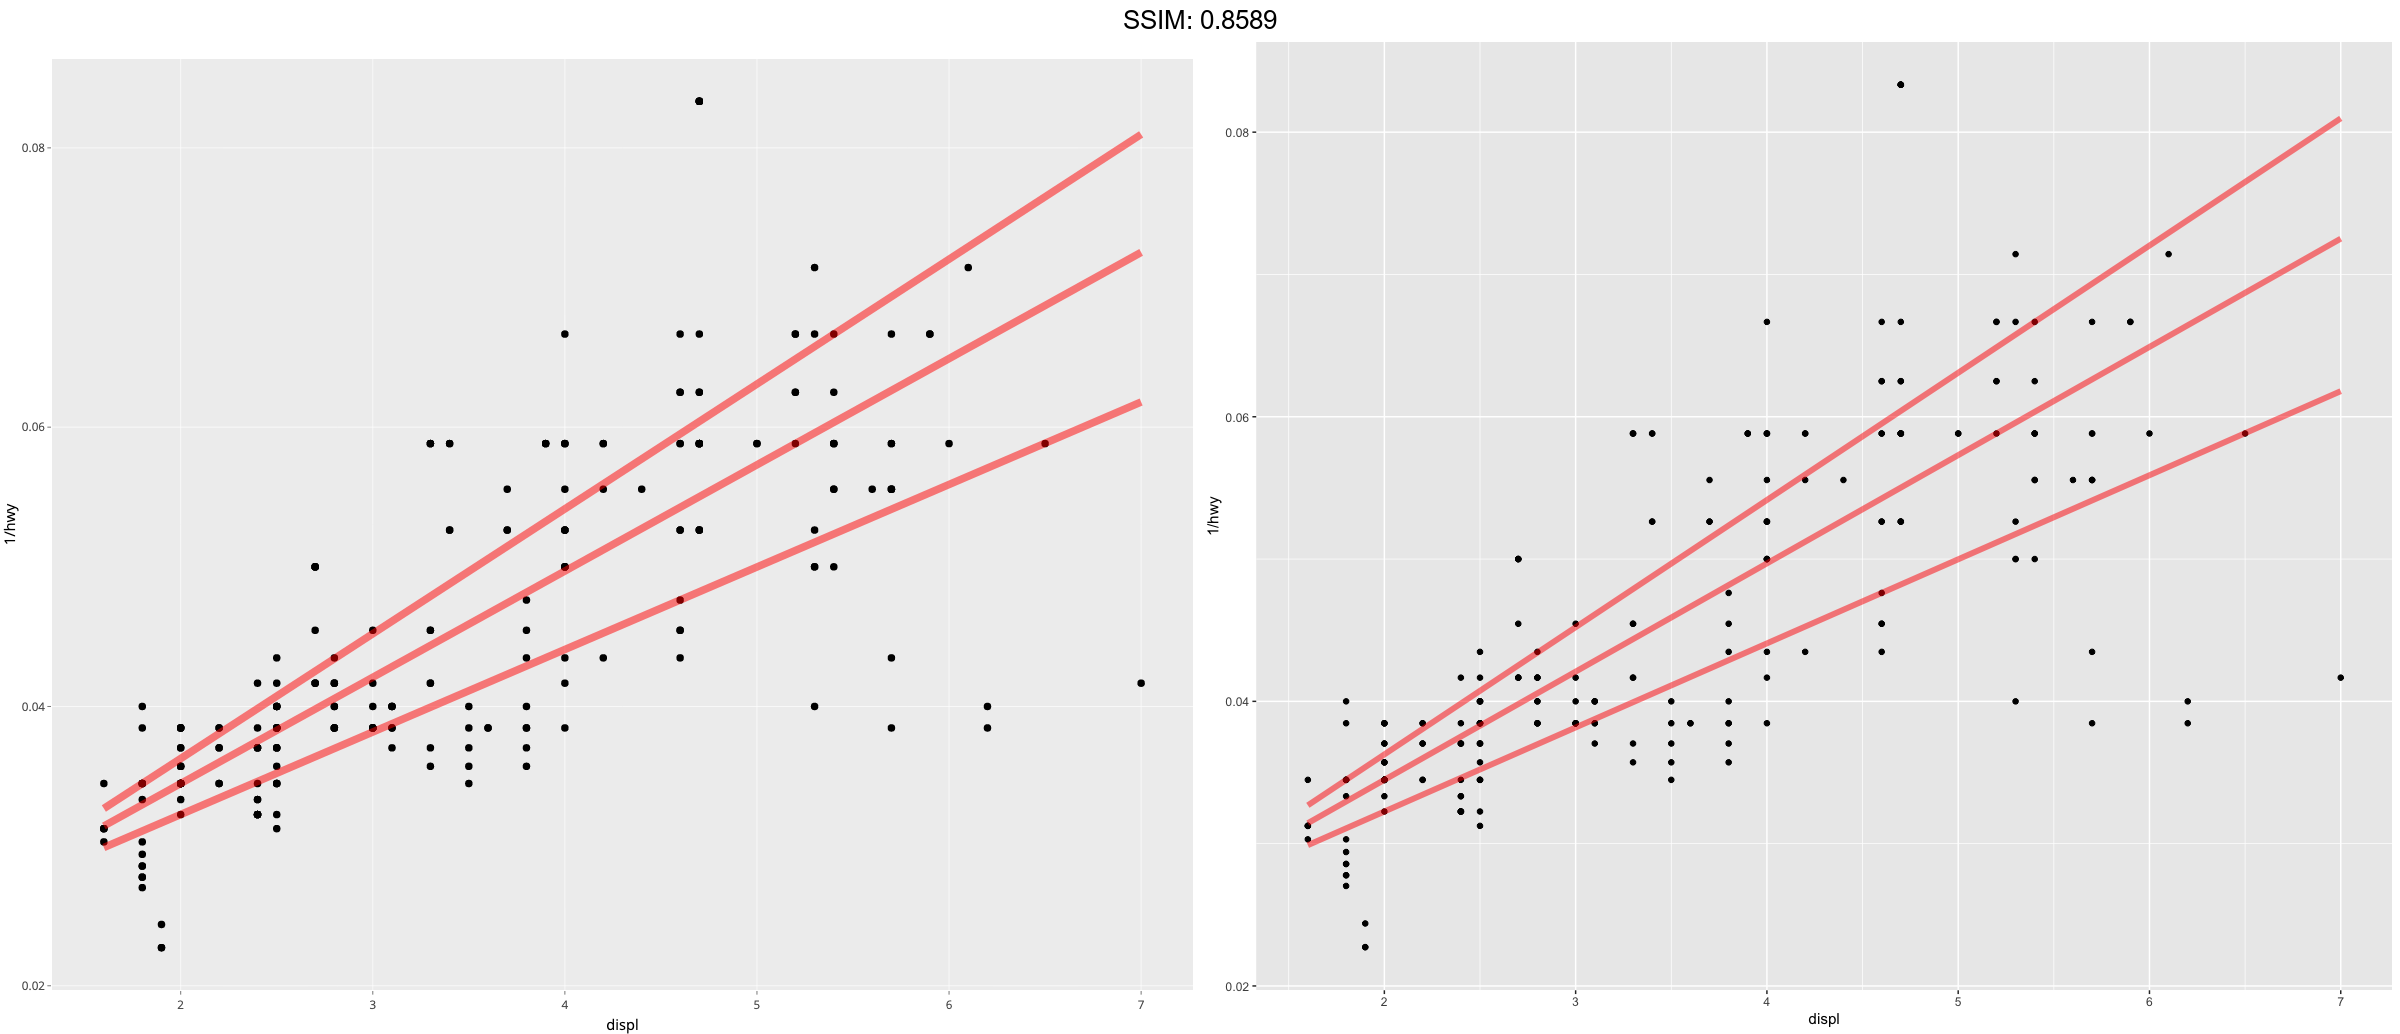
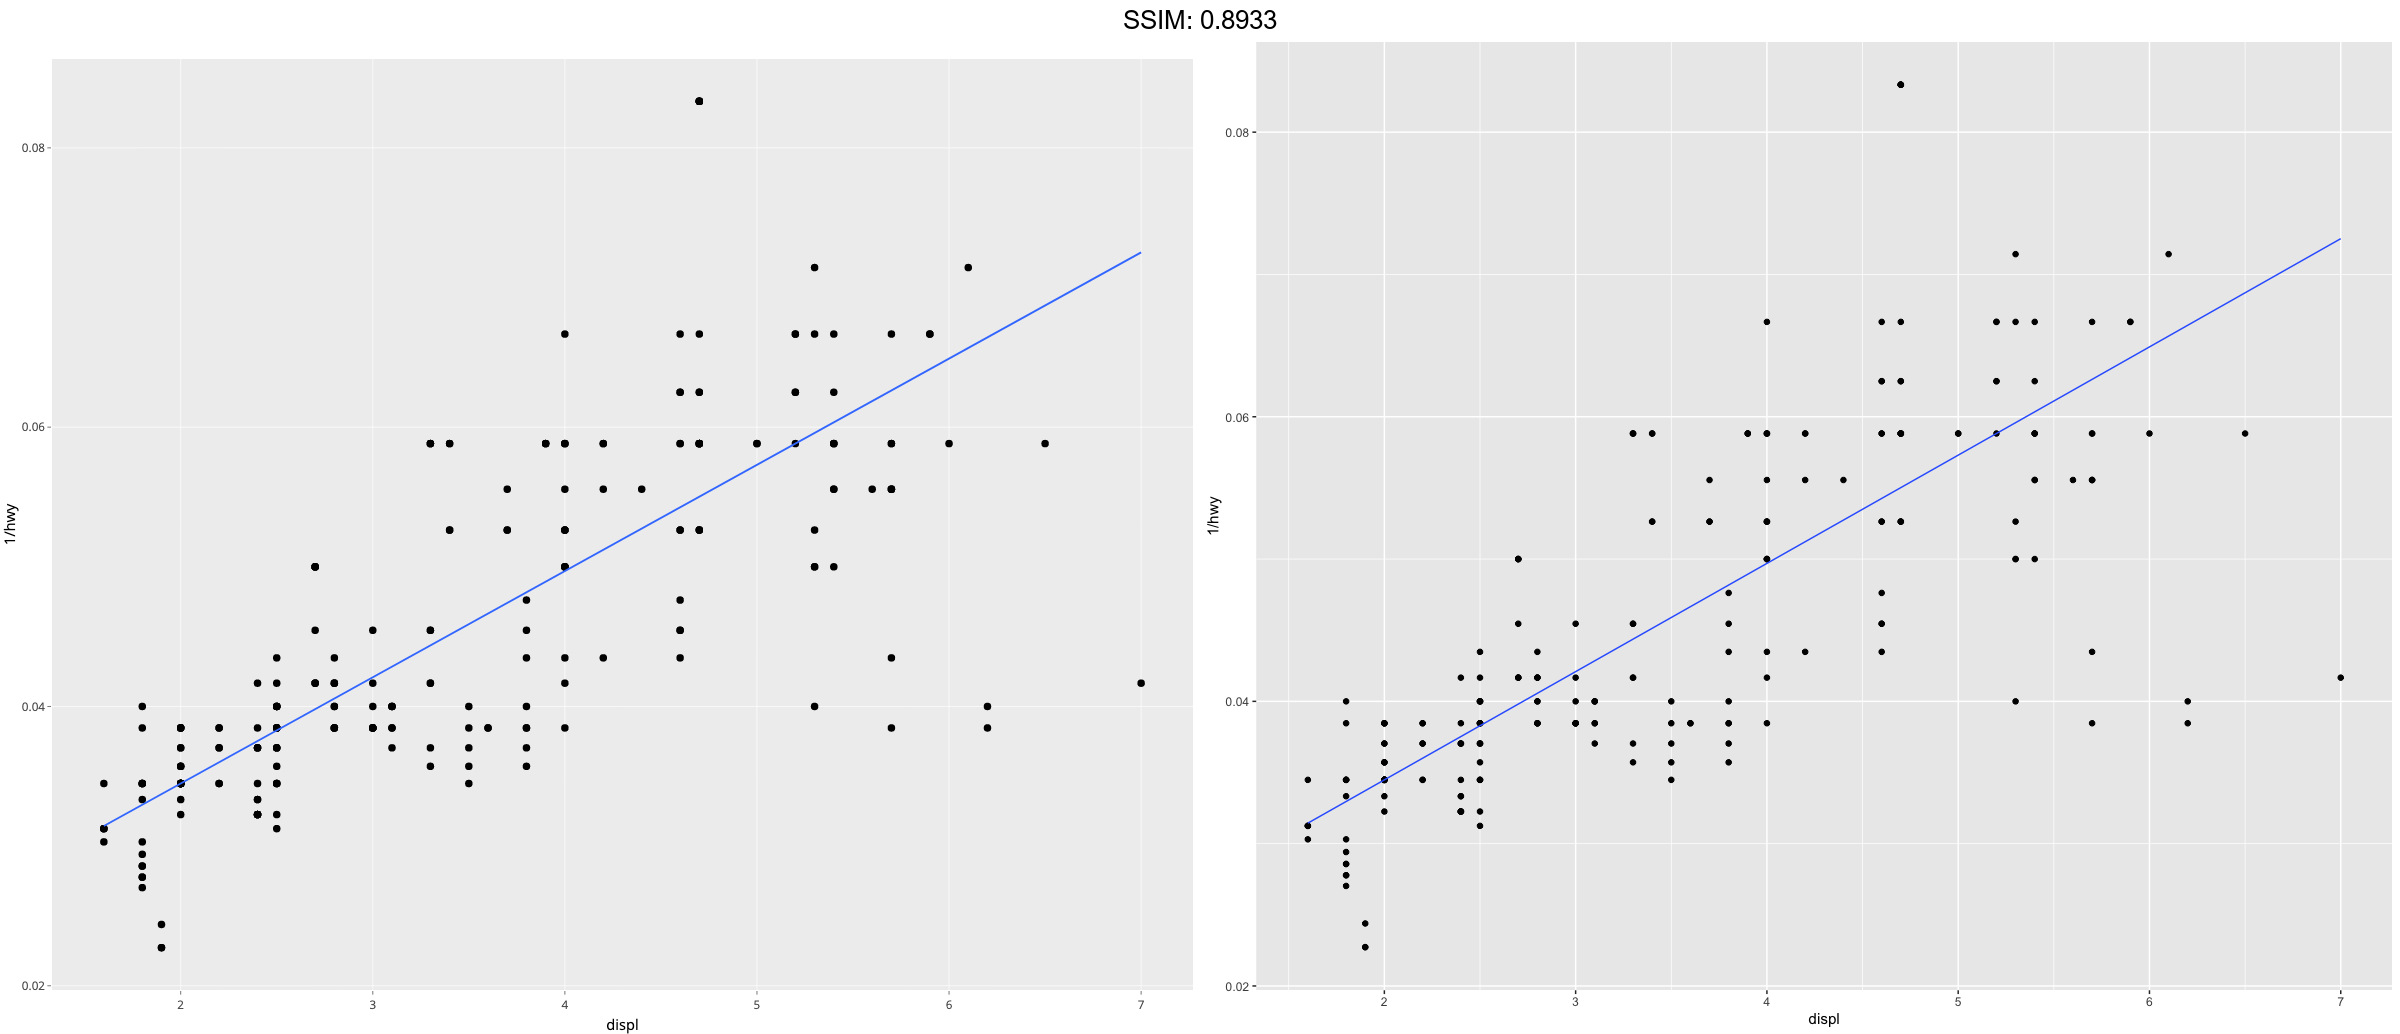
Fits a quantile regression to the data and draws the fitted quantiles with lines and then converts them with ggplotly
m <-
  ggplot(mpg, aes(displ, 1 / hwy)) +
  geom_point()
p <-  m + geom_quantile()
plotly::ggplotly(p)
## Smoothing formula not specified. Using: y ~ x


m <-
  ggplot(mpg, aes(displ, 1 / hwy)) +
  geom_point()
p <-  m + geom_quantile(quantiles = 0.5)
plotly::ggplotly(p)
## Smoothing formula not specified. Using: y ~ x

m <-
  ggplot(mpg, aes(displ, 1 / hwy)) +
  geom_point()
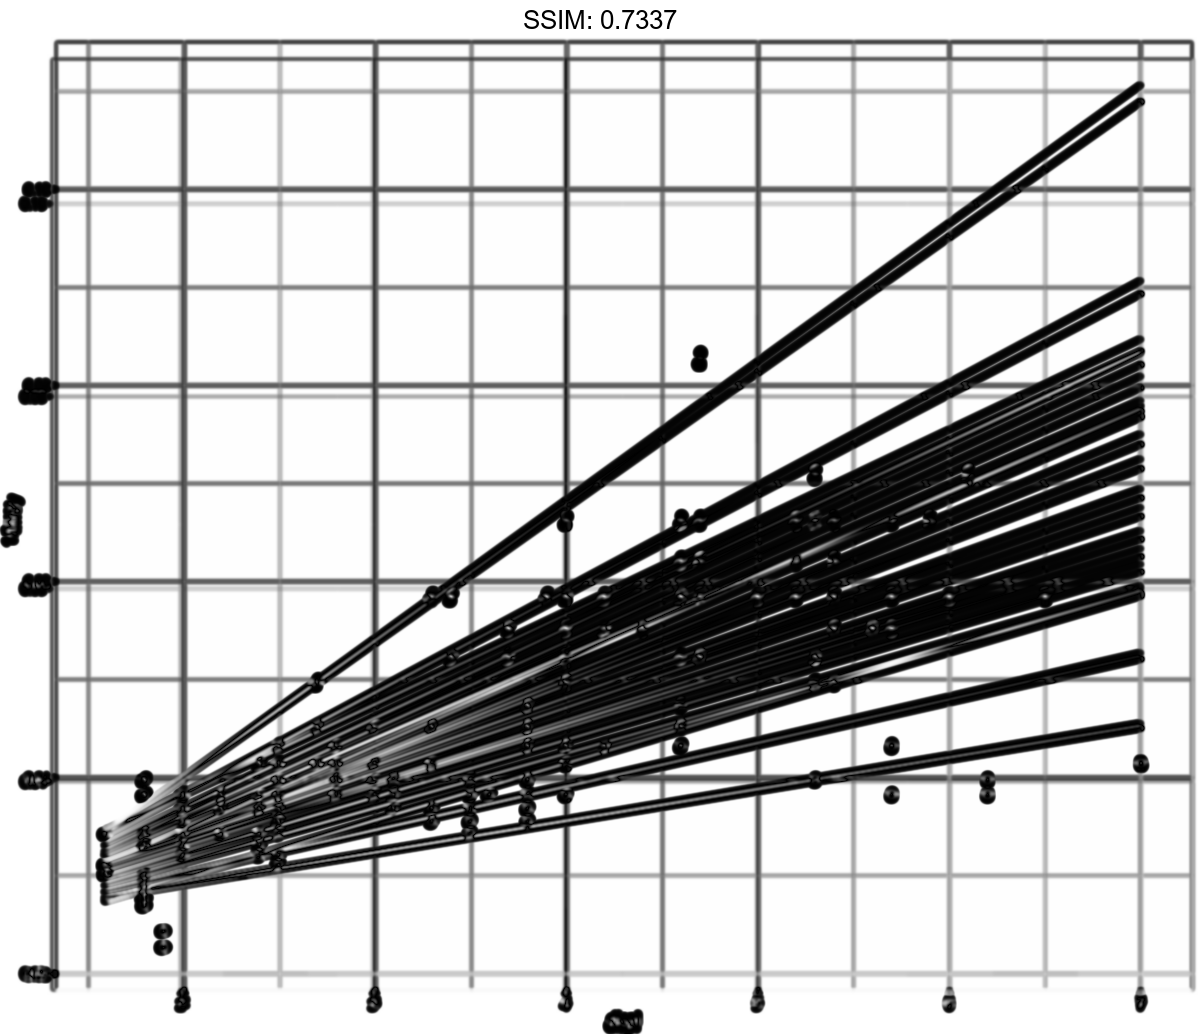
q10 <- seq(0.05, 0.95, by = 0.05)
p <-  m + geom_quantile(quantiles = q10)
plotly::ggplotly(p)
## Smoothing formula not specified. Using: y ~ x


m <-
  ggplot(mpg, aes(displ, 1 / hwy)) +
  geom_point()
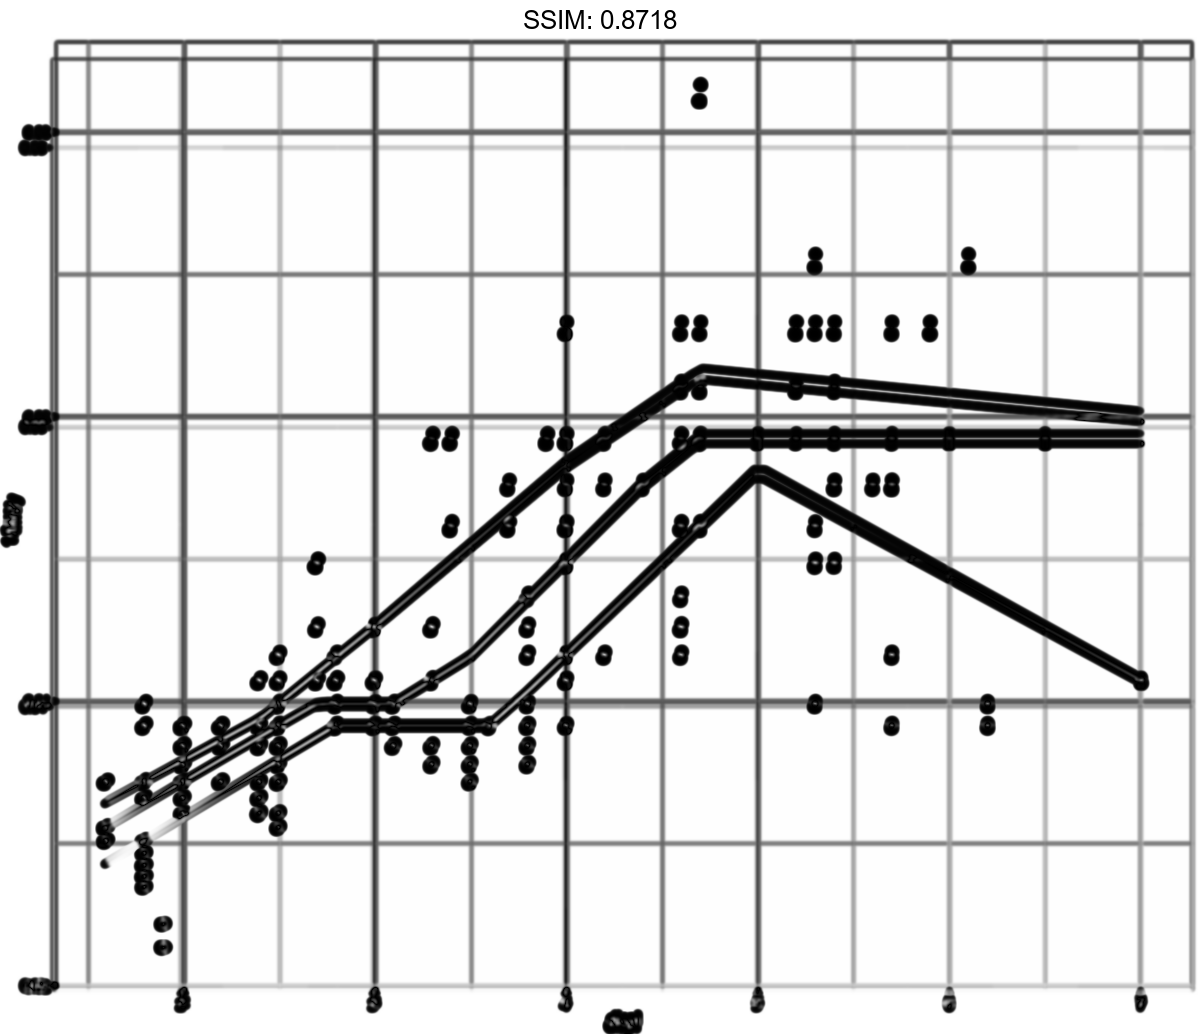
p <-  m + geom_quantile(method = "rqss")
plotly::ggplotly(p)
## Smoothing formula not specified. Using: y ~ qss(x, lambda = 1)


m <-
  ggplot(mpg, aes(displ, 1 / hwy)) +
  geom_point()
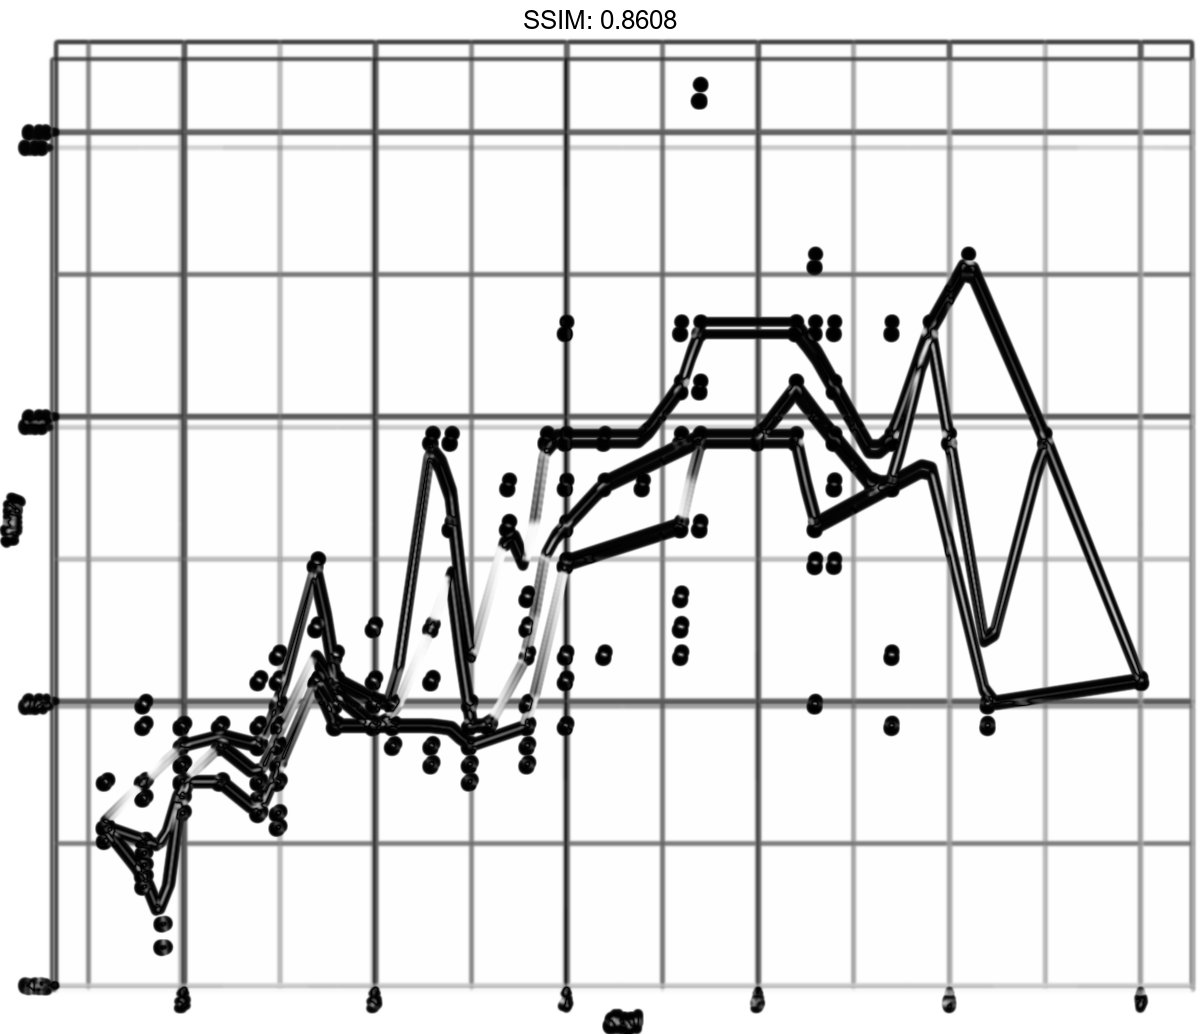
p <-  m + geom_quantile(method = "rqss", lambda = 0.1)
plotly::ggplotly(p)
## Smoothing formula not specified. Using: y ~ qss(x, lambda = 0.1)


m <-
  ggplot(mpg, aes(displ, 1 / hwy)) +
  geom_point()
p <-  m + geom_quantile(colour = "red", size = 2, alpha = 0.5)
plotly::ggplotly(p)
## Smoothing formula not specified. Using: y ~ x

