GGPLOT - geom_polygon
Draw polygons and then convert them with ggplotly
ids <- factor(c("1.1", "2.1", "1.2", "2.2", "1.3", "2.3"))
values <- data.frame(
id = ids,
value = c(3, 3.1, 3.1, 3.2, 3.15, 3.5)
)
positions <- data.frame(
id = rep(ids, each = 4),
x = c(2, 1, 1.1, 2.2, 1, 0, 0.3, 1.1, 2.2, 1.1, 1.2, 2.5, 1.1, 0.3,
0.5, 1.2, 2.5, 1.2, 1.3, 2.7, 1.2, 0.5, 0.6, 1.3),
y = c(-0.5, 0, 1, 0.5, 0, 0.5, 1.5, 1, 0.5, 1, 2.1, 1.7, 1, 1.5,
2.2, 2.1, 1.7, 2.1, 3.2, 2.8, 2.1, 2.2, 3.3, 3.2)
)
datapoly <- merge(values, positions, by = c("id"))
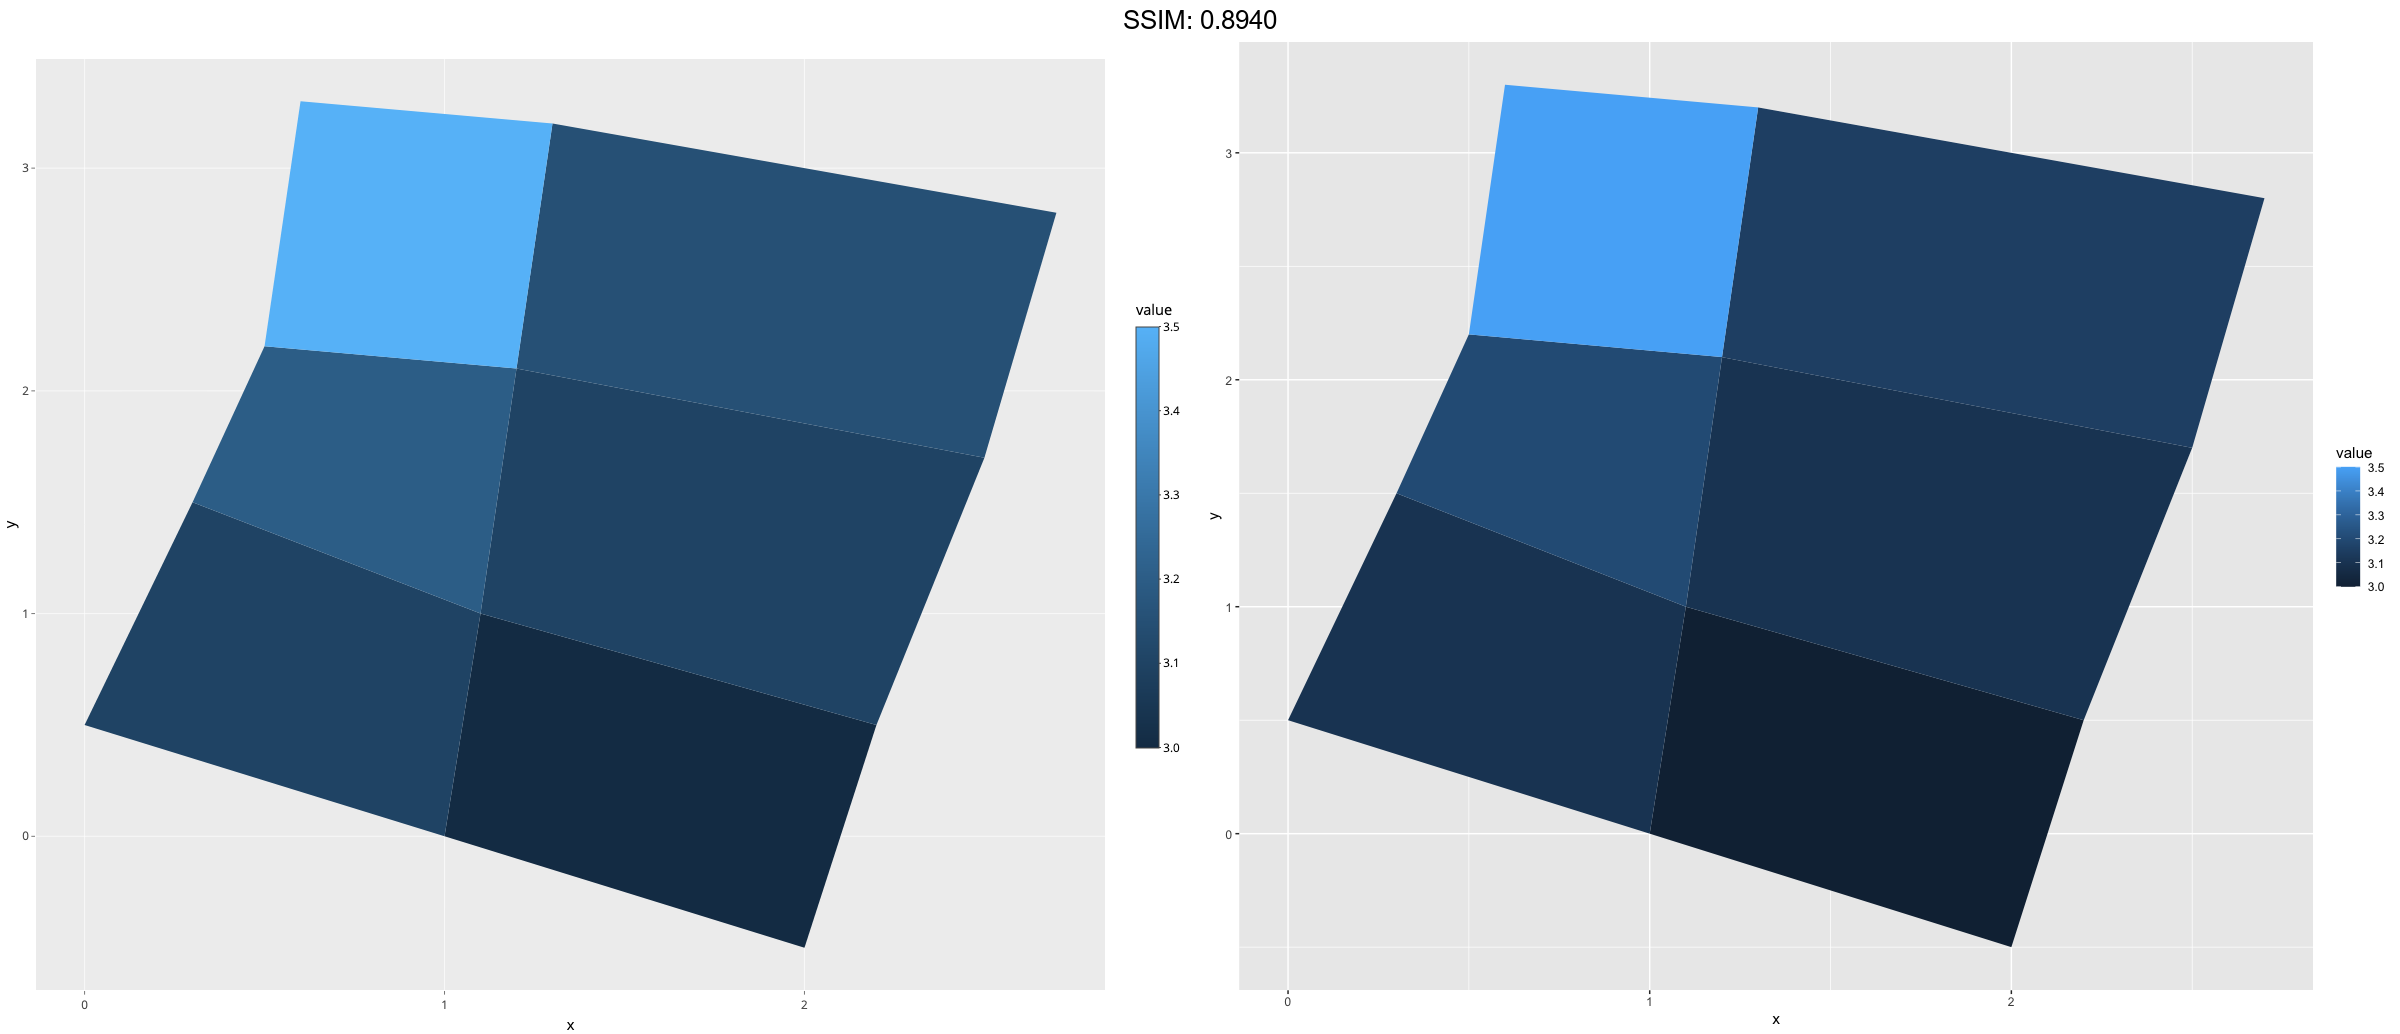
p <- ggplot(datapoly, aes(x = x, y = y)) +
geom_polygon(aes(fill = value, group = id))
plotly::ggplotly(p)

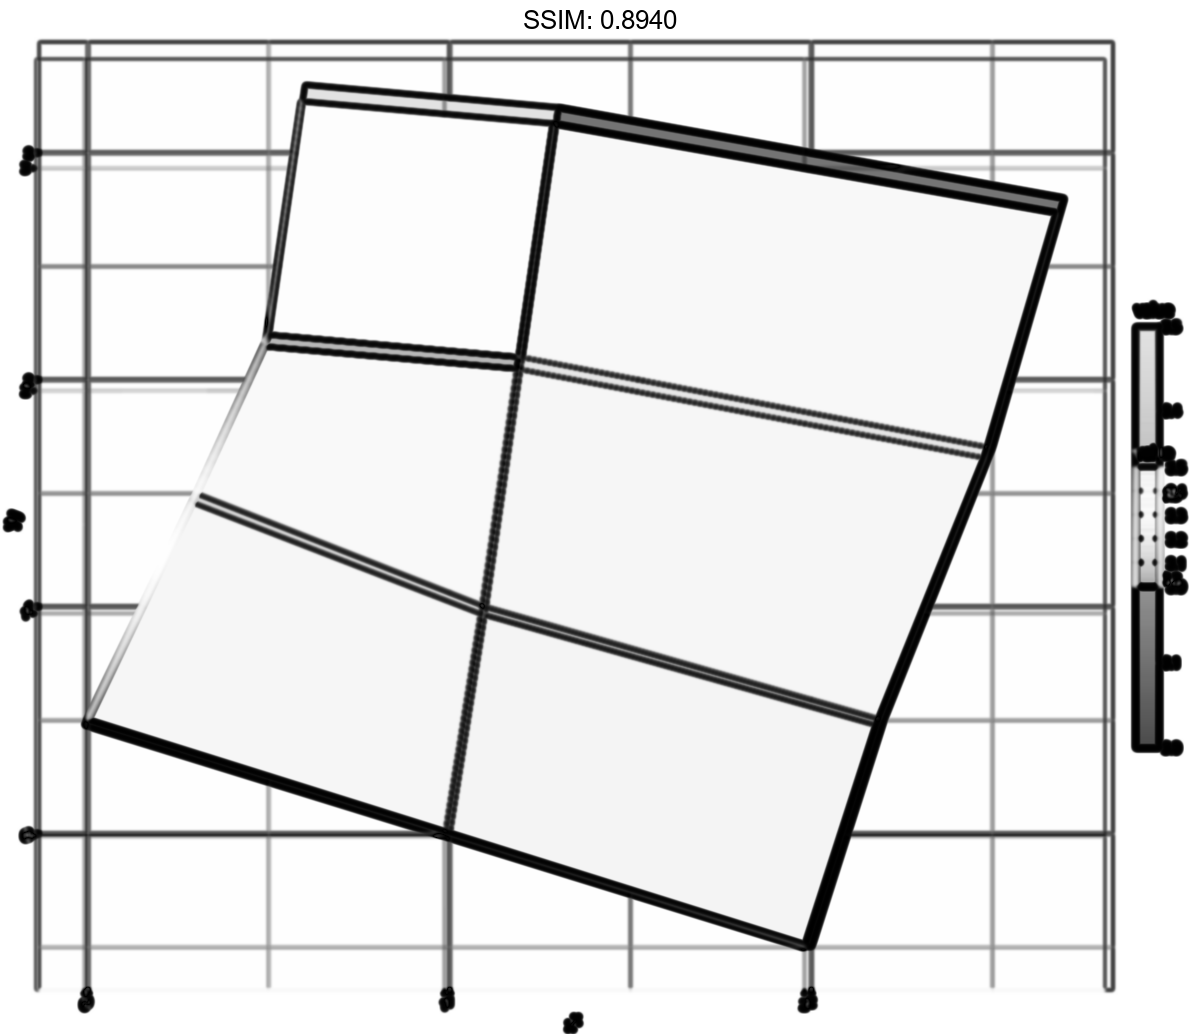
stream <- data.frame(
  x = cumsum(runif(50, max = 0.1)),
  y = cumsum(runif(50,max = 0.1))
)
p <- ggplot(datapoly, aes(x = x, y = y)) +
  geom_polygon(aes(fill = value, group = id))
p <-  p + geom_line(data = stream, colour = "grey30", size = 5)
plotly::ggplotly(p)
p <-
 if (packageVersion("grid") >= "3.6") {
  # As of R version 3.6 geom_polygon() supports polygons with holes
  # Use the subgroup aesthetic to differentiate holes from the main polygon

  holes <- do.call(rbind, lapply(split(datapoly, datapoly$id), function(df) {
    df$x <- df$x + 0.5 * (mean(df$x) - df$x)
    df$y <- df$y + 0.5 * (mean(df$y) - df$y)
    df
  }))
  datapoly$subid <- 1L
  holes$subid <- 2L
  datapoly <- rbind(datapoly, holes)

  p <- ggplot(datapoly, aes(x = x, y = y)) +
    geom_polygon(aes(fill = value, group = id, subgroup = subid))
  p
}
plotly::ggplotly(p)