GGPLOT - geom_point
Create scatterplots and then convert them with ggplotly
p <- ggplot(mtcars, aes(wt, mpg))
p <-  p + geom_point()
plotly::ggplotly(p)


p <- ggplot(mtcars, aes(wt, mpg))
p <-  p + geom_point(aes(colour = factor(cyl)))
plotly::ggplotly(p)


p <- ggplot(mtcars, aes(wt, mpg))
p <-  p + geom_point(aes(shape = factor(cyl)))
plotly::ggplotly(p)

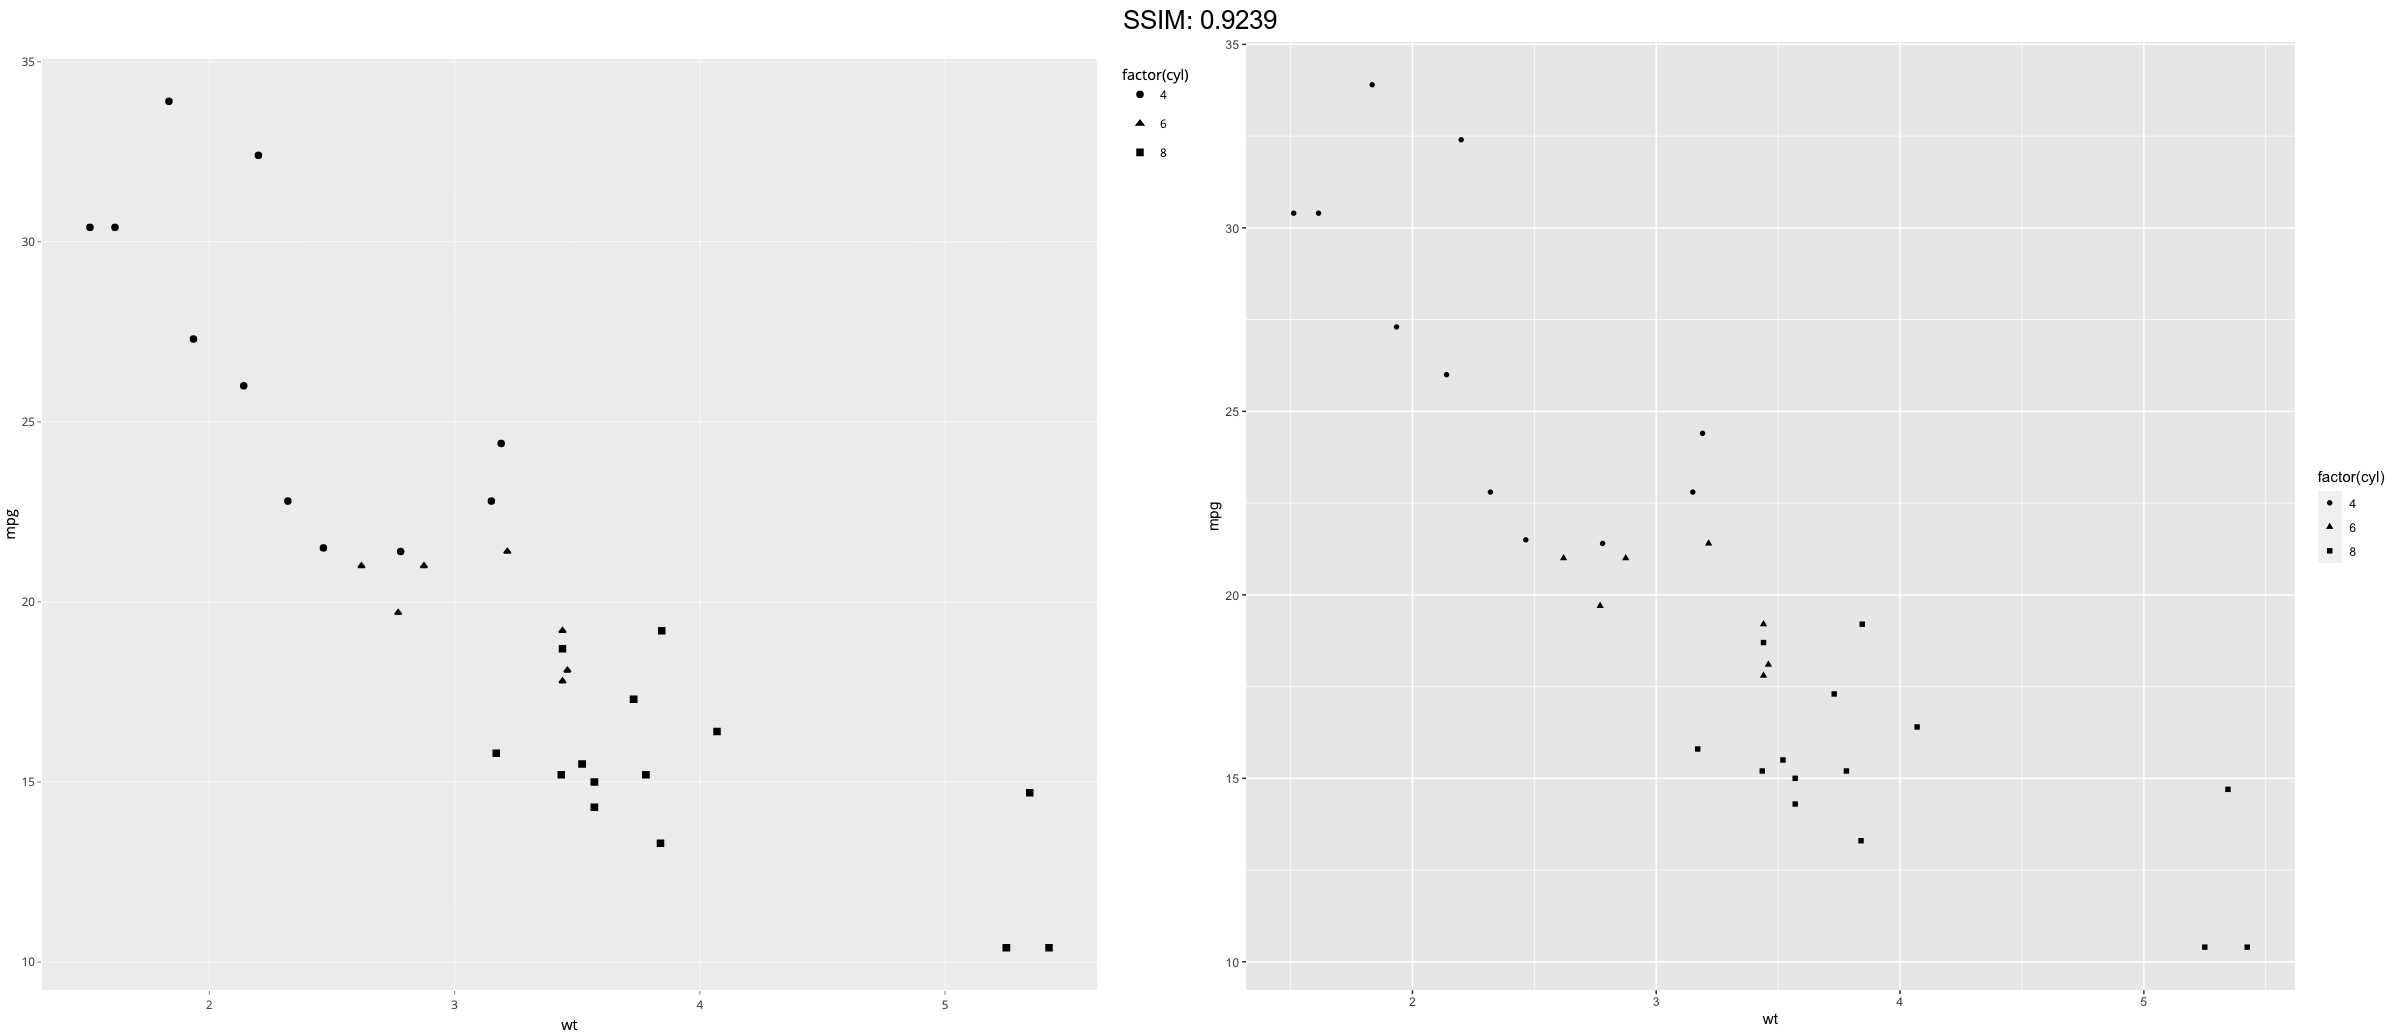

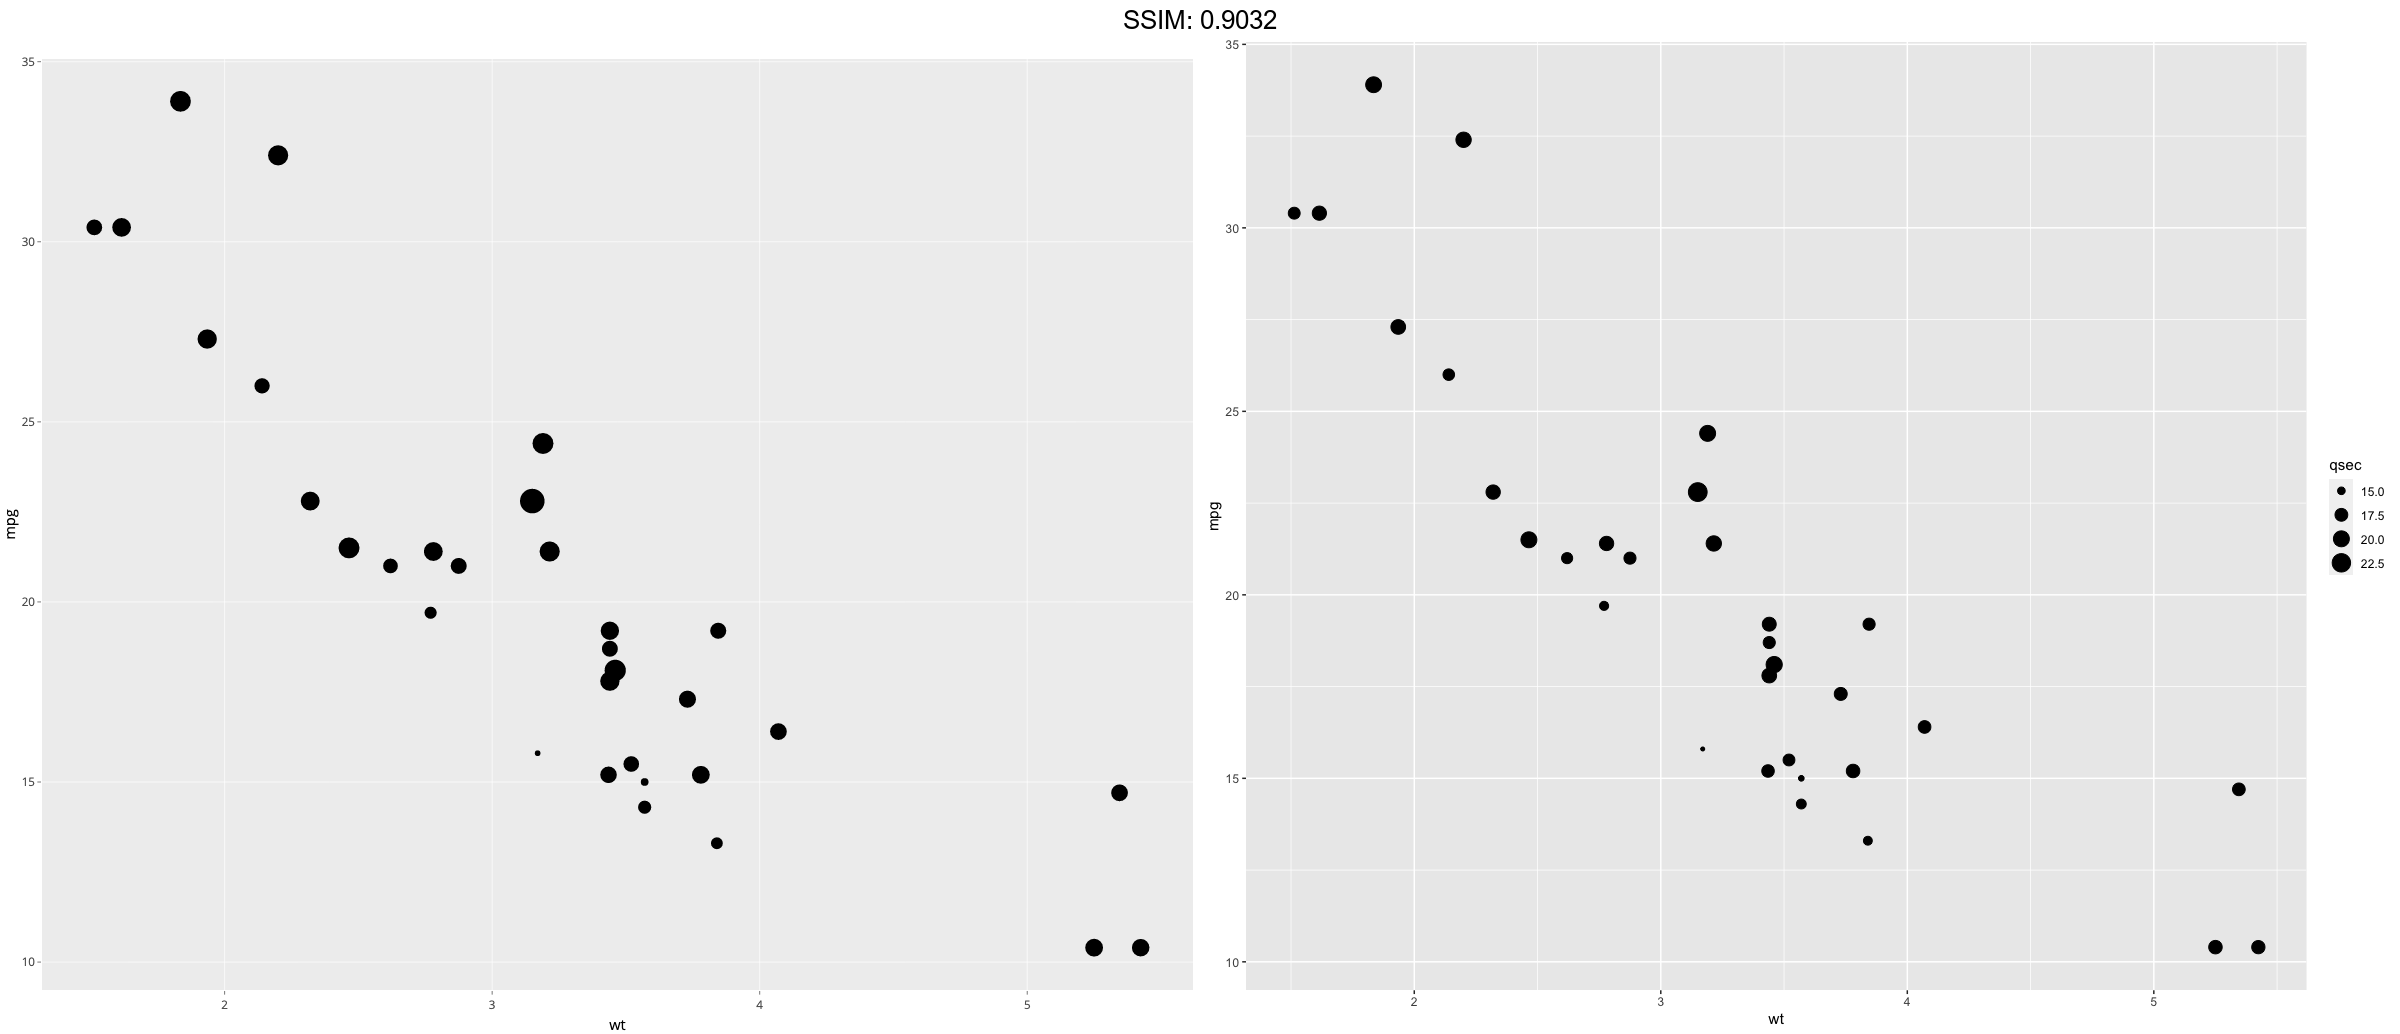
p <- ggplot(mtcars, aes(wt, mpg))
p <-  p + geom_point(aes(size = qsec))
plotly::ggplotly(p)


p <- ggplot(mtcars, aes(wt, mpg)) + geom_point(colour = "red", size = 3)
plotly::ggplotly(p)


d <- ggplot(diamonds, aes(carat, price))
p <-  d + geom_point(alpha = 1/10)
plotly::ggplotly(p)


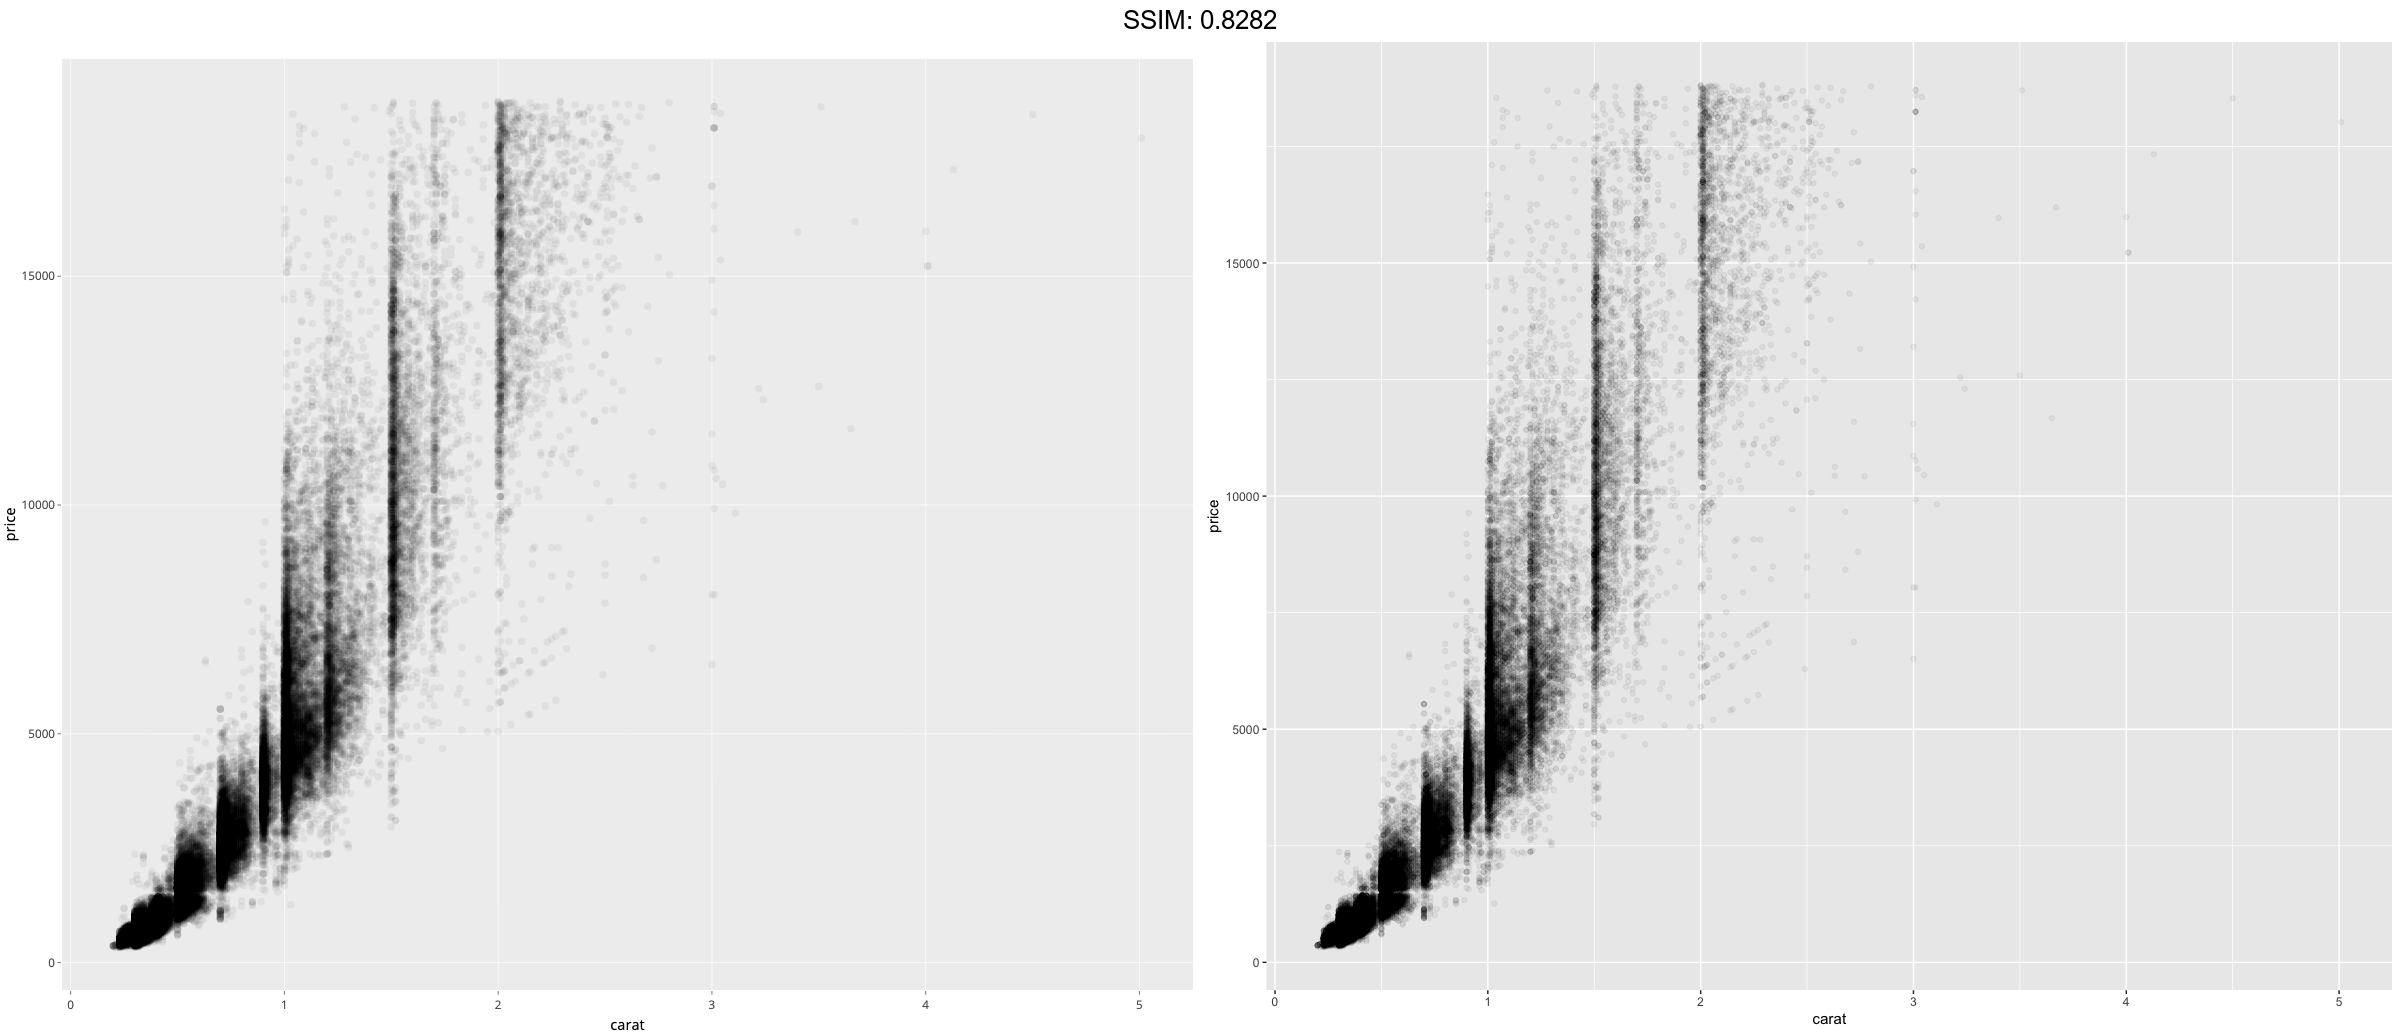
d <- ggplot(diamonds, aes(carat, price))
p <-  d + geom_point(alpha = 1/20)
plotly::ggplotly(p)


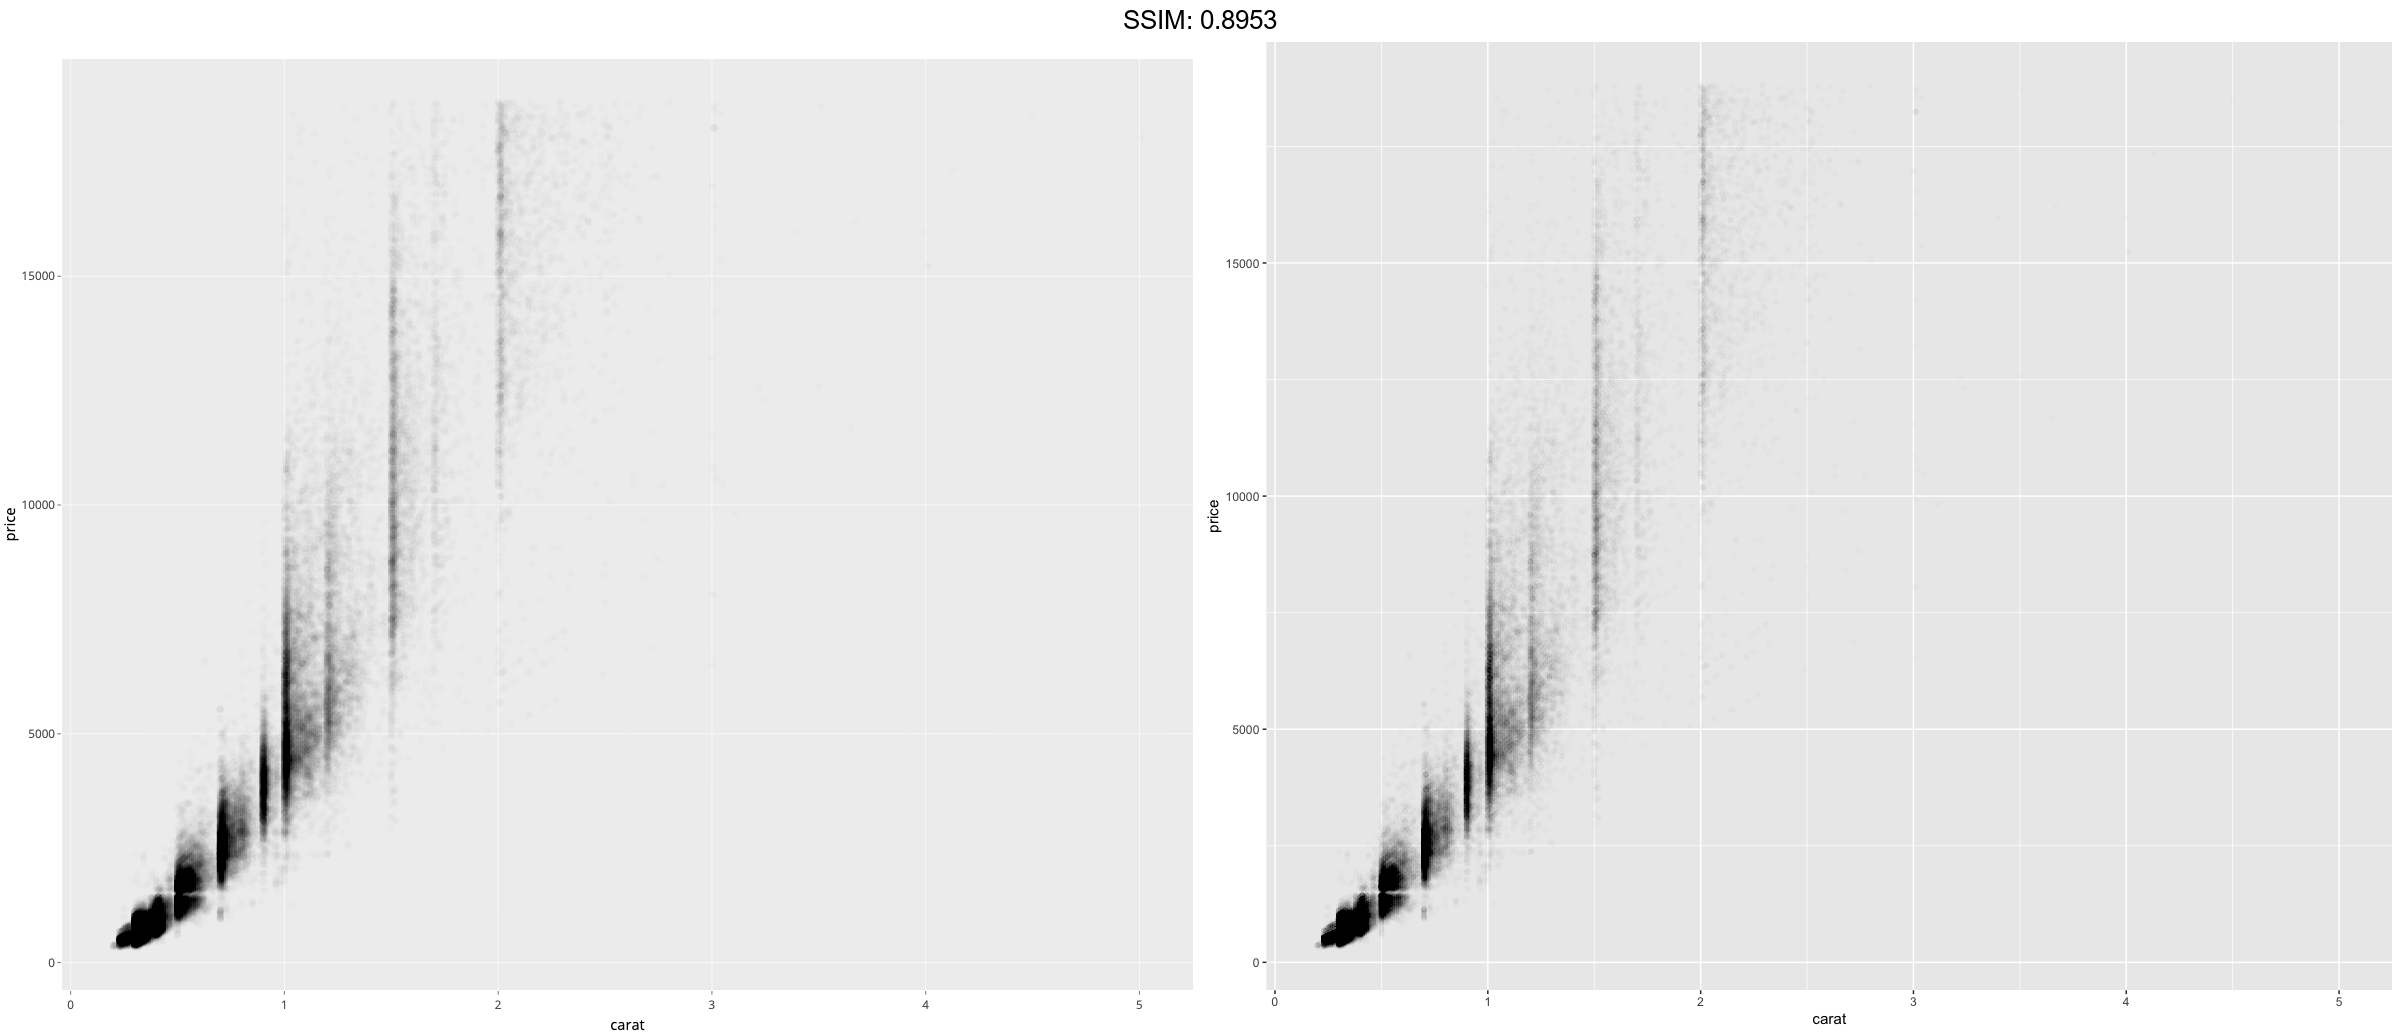
d <- ggplot(diamonds, aes(carat, price))
p <-  d + geom_point(alpha = 1/100)
plotly::ggplotly(p)


p <-
 ggplot(mtcars, aes(wt, mpg)) +
  geom_point(shape = 21, colour = "black", fill = "white", size = 5, stroke = 5)
plotly::ggplotly(p)


p <- ggplot(mtcars, aes(mpg, wt, shape = factor(cyl)))
p <-
 p +
  geom_point(aes(colour = factor(cyl)), size = 4) +
  geom_point(colour = "grey90", size = 1.5)
plotly::ggplotly(p)


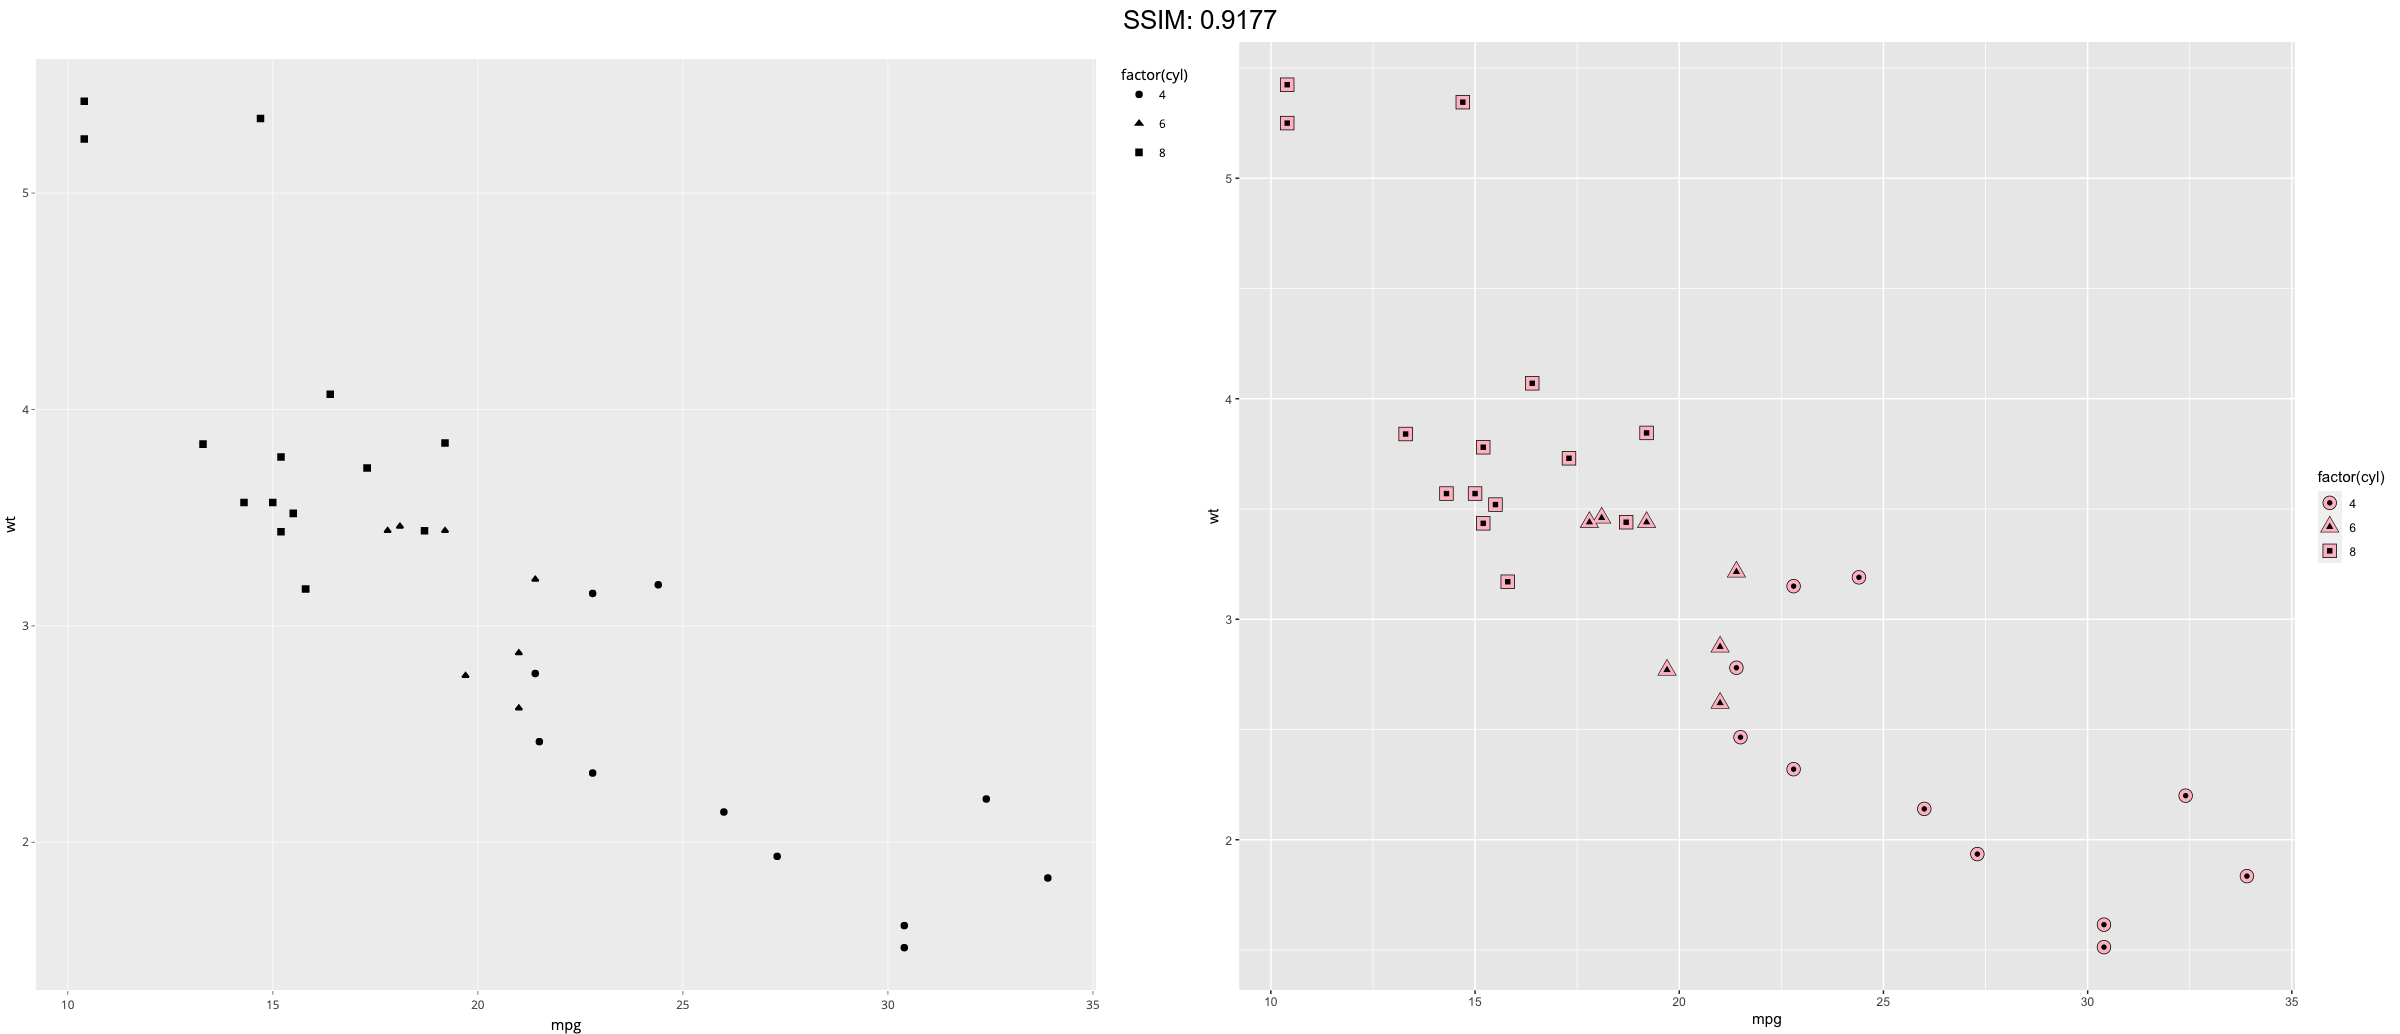
p <- ggplot(mtcars, aes(mpg, wt, shape = factor(cyl)))
p <-
 p +
  geom_point(colour = "black", size = 4.5) +
  geom_point(colour = "pink", size = 4) +
  geom_point(aes(shape = factor(cyl)))
plotly::ggplotly(p)


mtcars2 <- transform(mtcars, mpg = ifelse(runif(32) < 0.2, NA, mpg))
p <-
 ggplot(mtcars2, aes(wt, mpg)) +
  geom_point()
plotly::ggplotly(p)


mtcars2 <- transform(mtcars, mpg = ifelse(runif(32) < 0.2, NA, mpg))
p <-
 ggplot(mtcars2, aes(wt, mpg)) +
  geom_point(na.rm = TRUE)
plotly::ggplotly(p)


