GGPLOT - geom_path
Connect the observations in the order in which they appear in the data and then convert them with ggplotly.
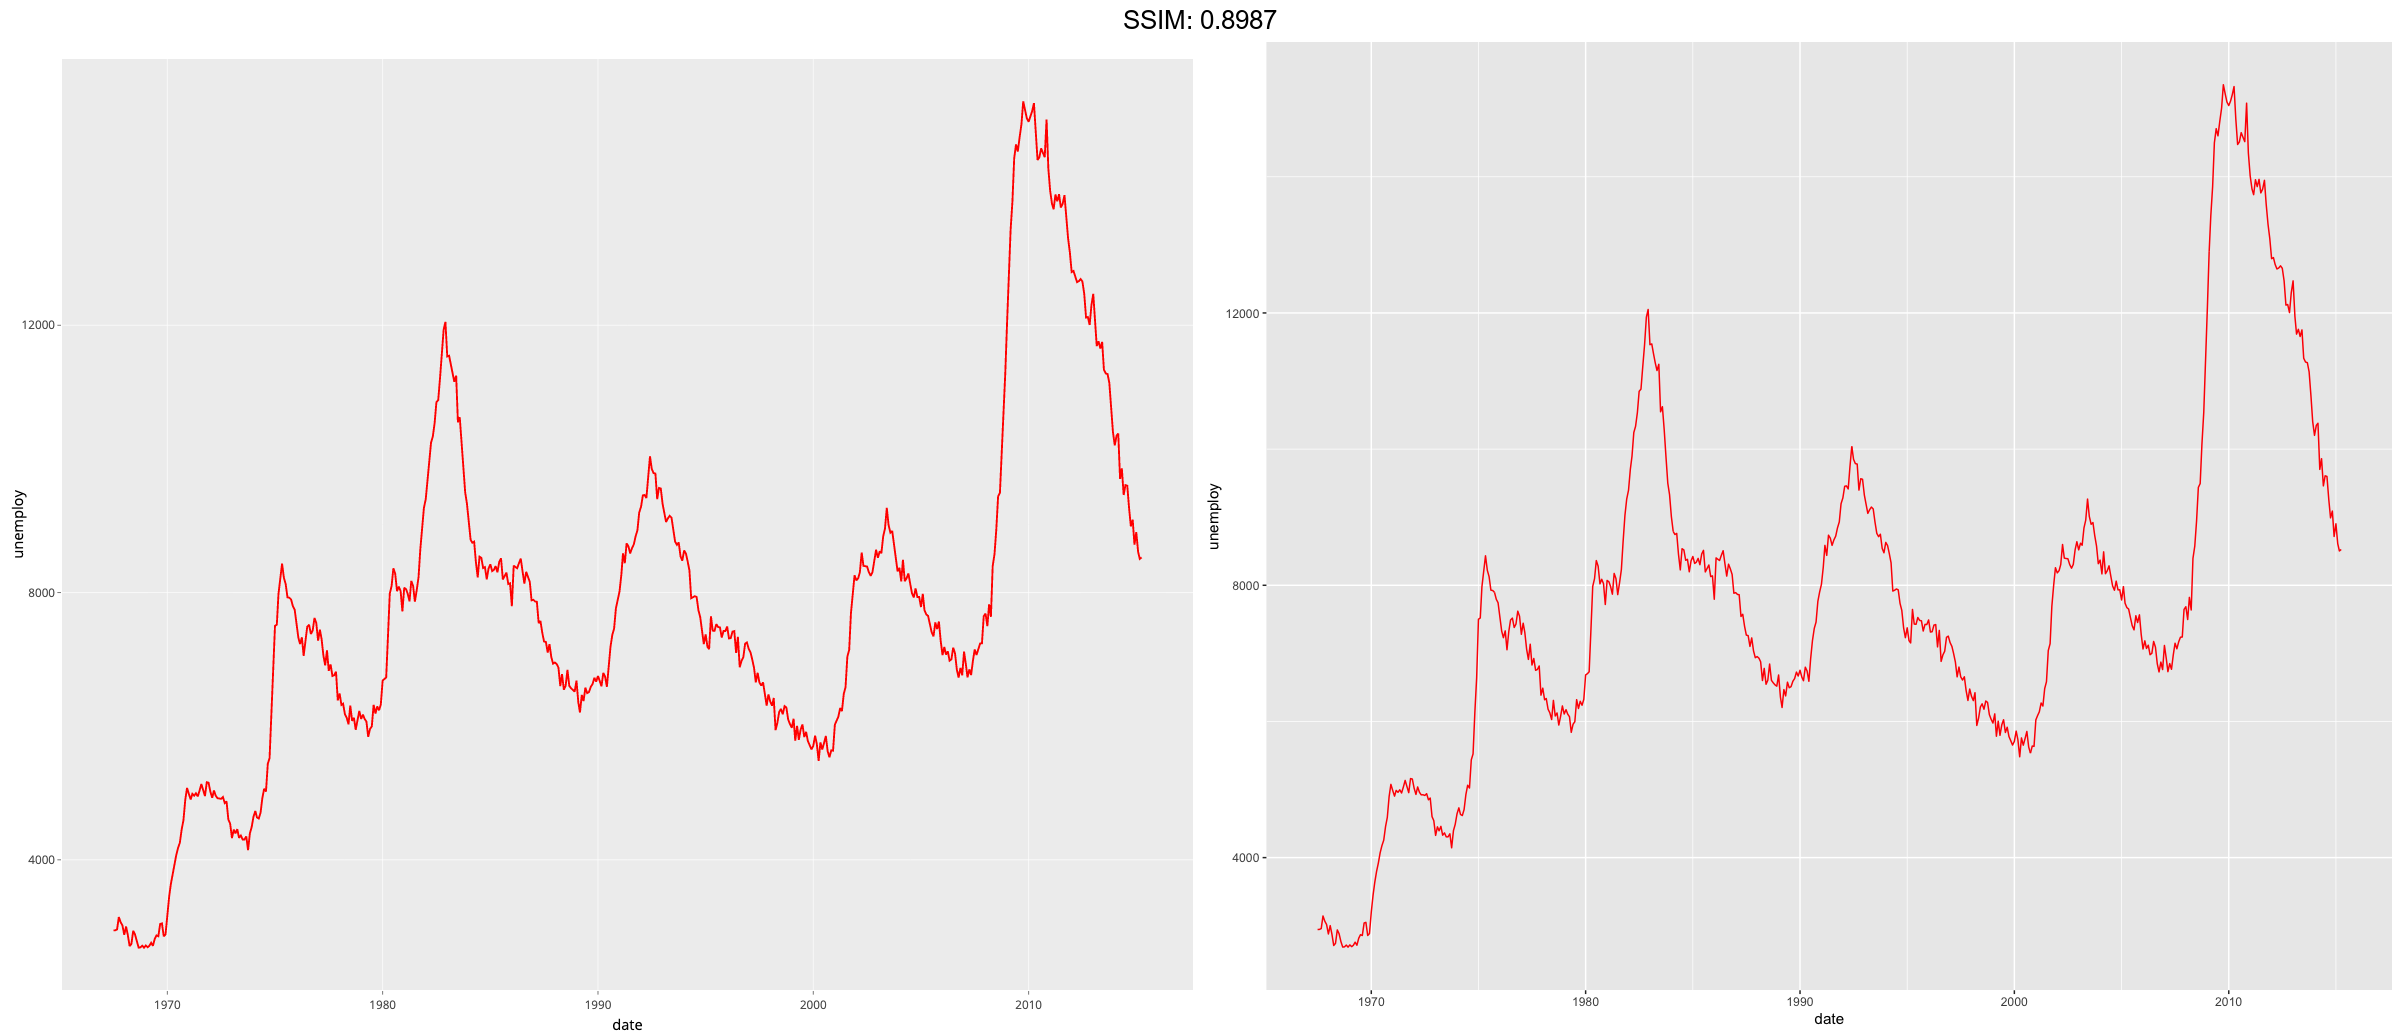
p <- ggplot(economics, aes(date, unemploy)) + geom_line()
plotly::ggplotly(p)


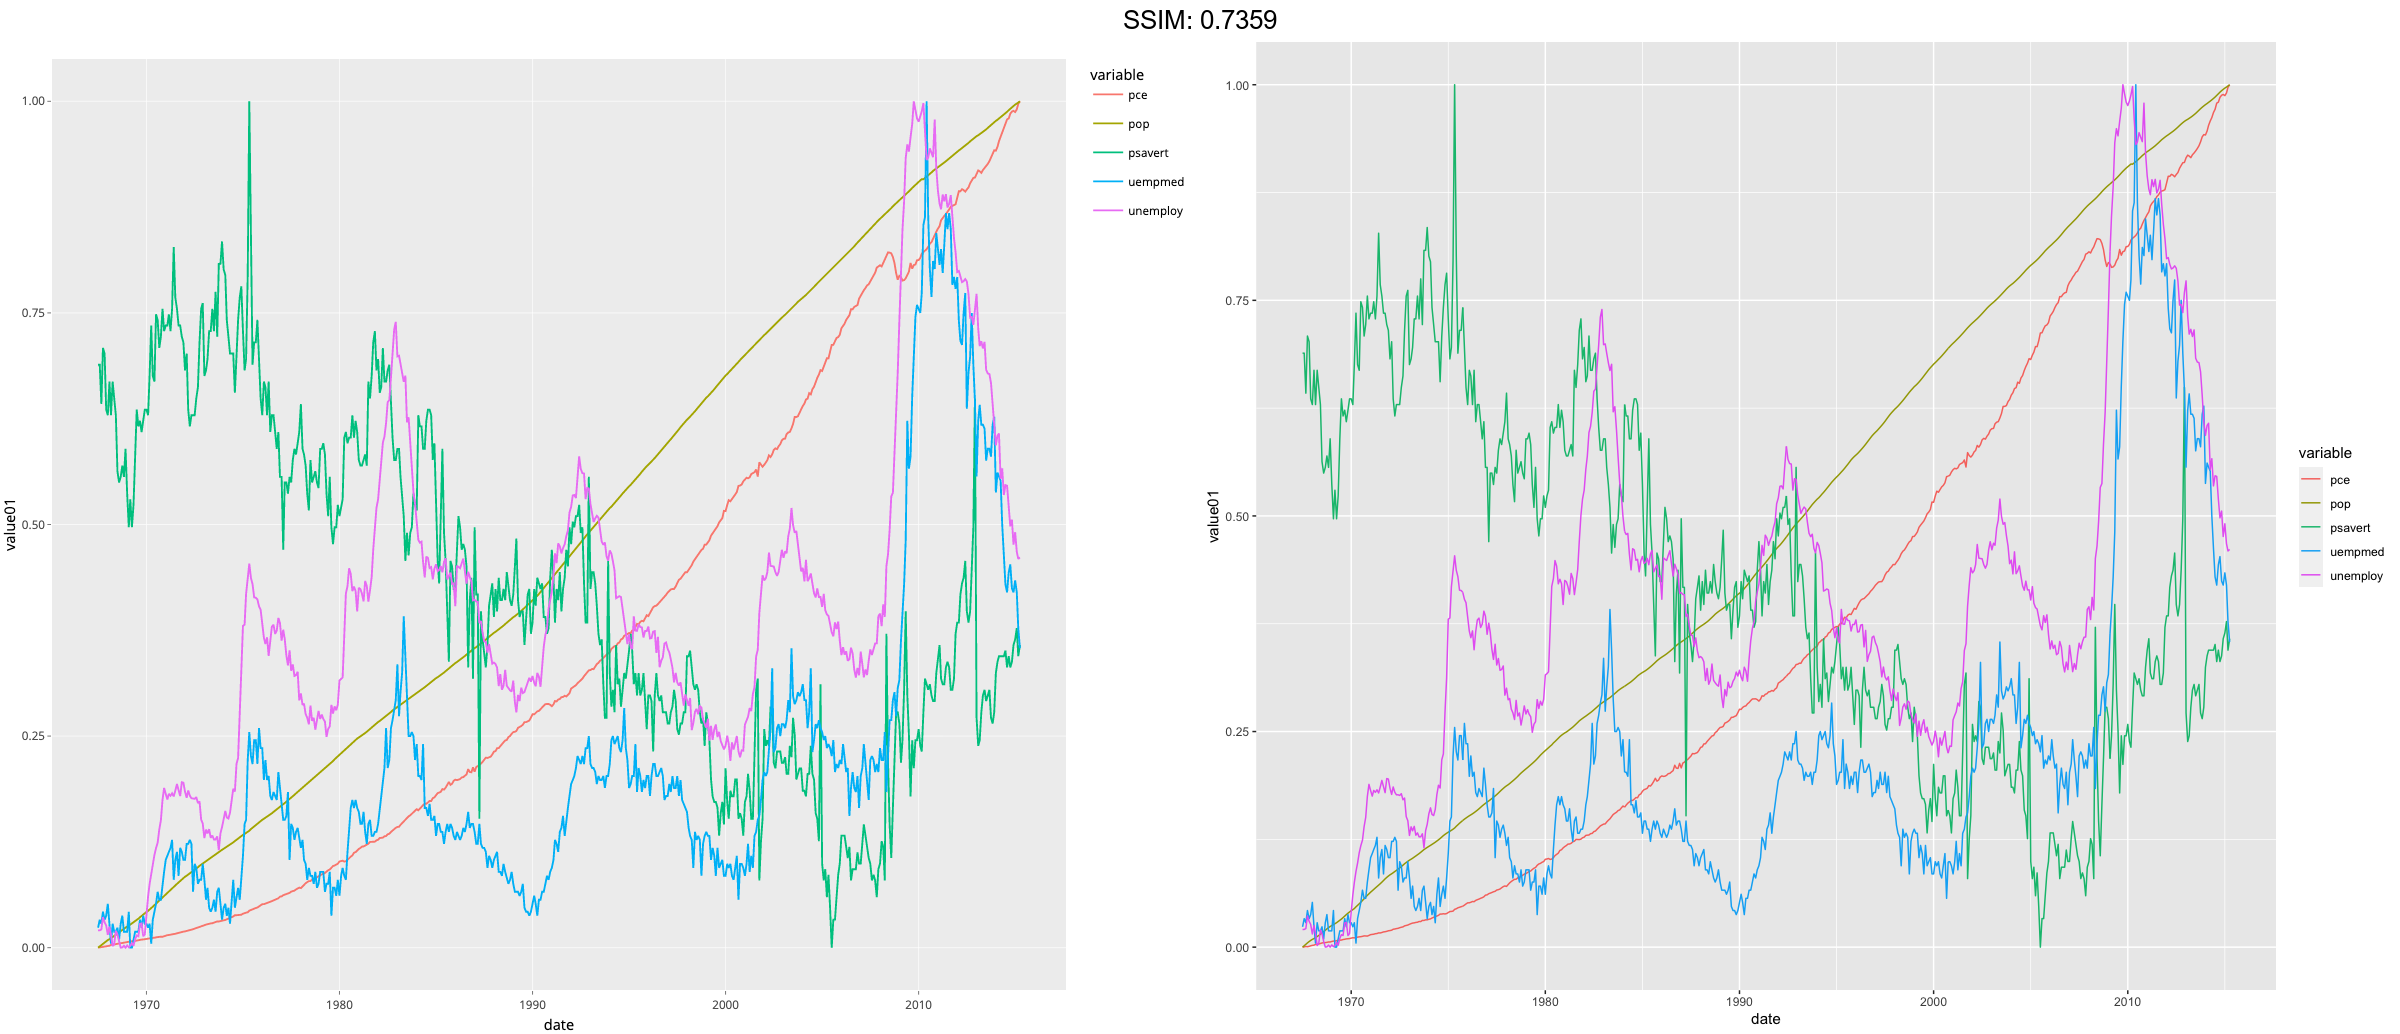
p <-
 ggplot(economics_long, aes(date, value01, colour = variable)) +
  geom_line()
plotly::ggplotly(p)

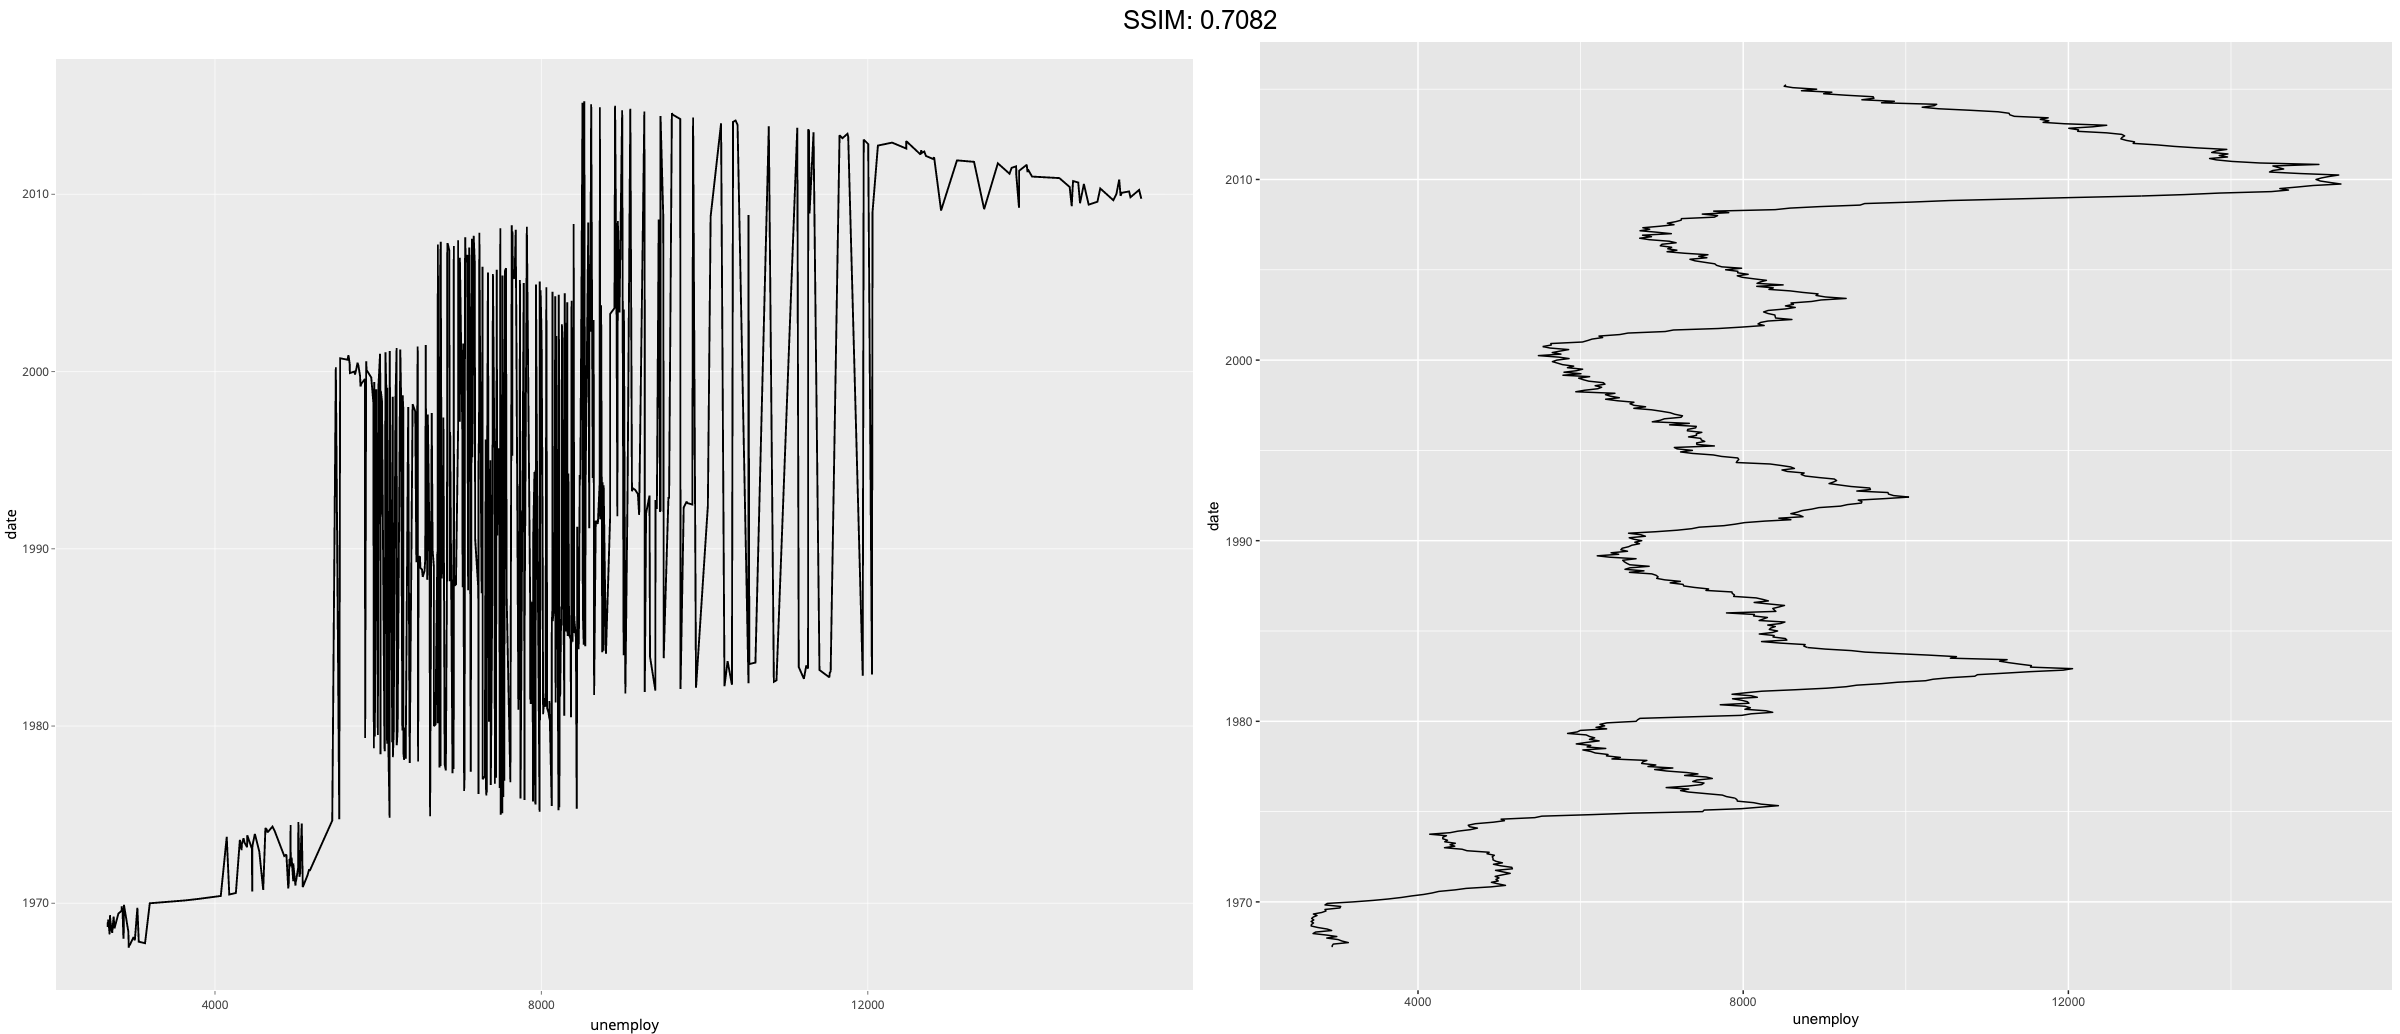
p <- ggplot(economics, aes(unemploy, date)) + geom_line(orientation = "y")
plotly::ggplotly(p)

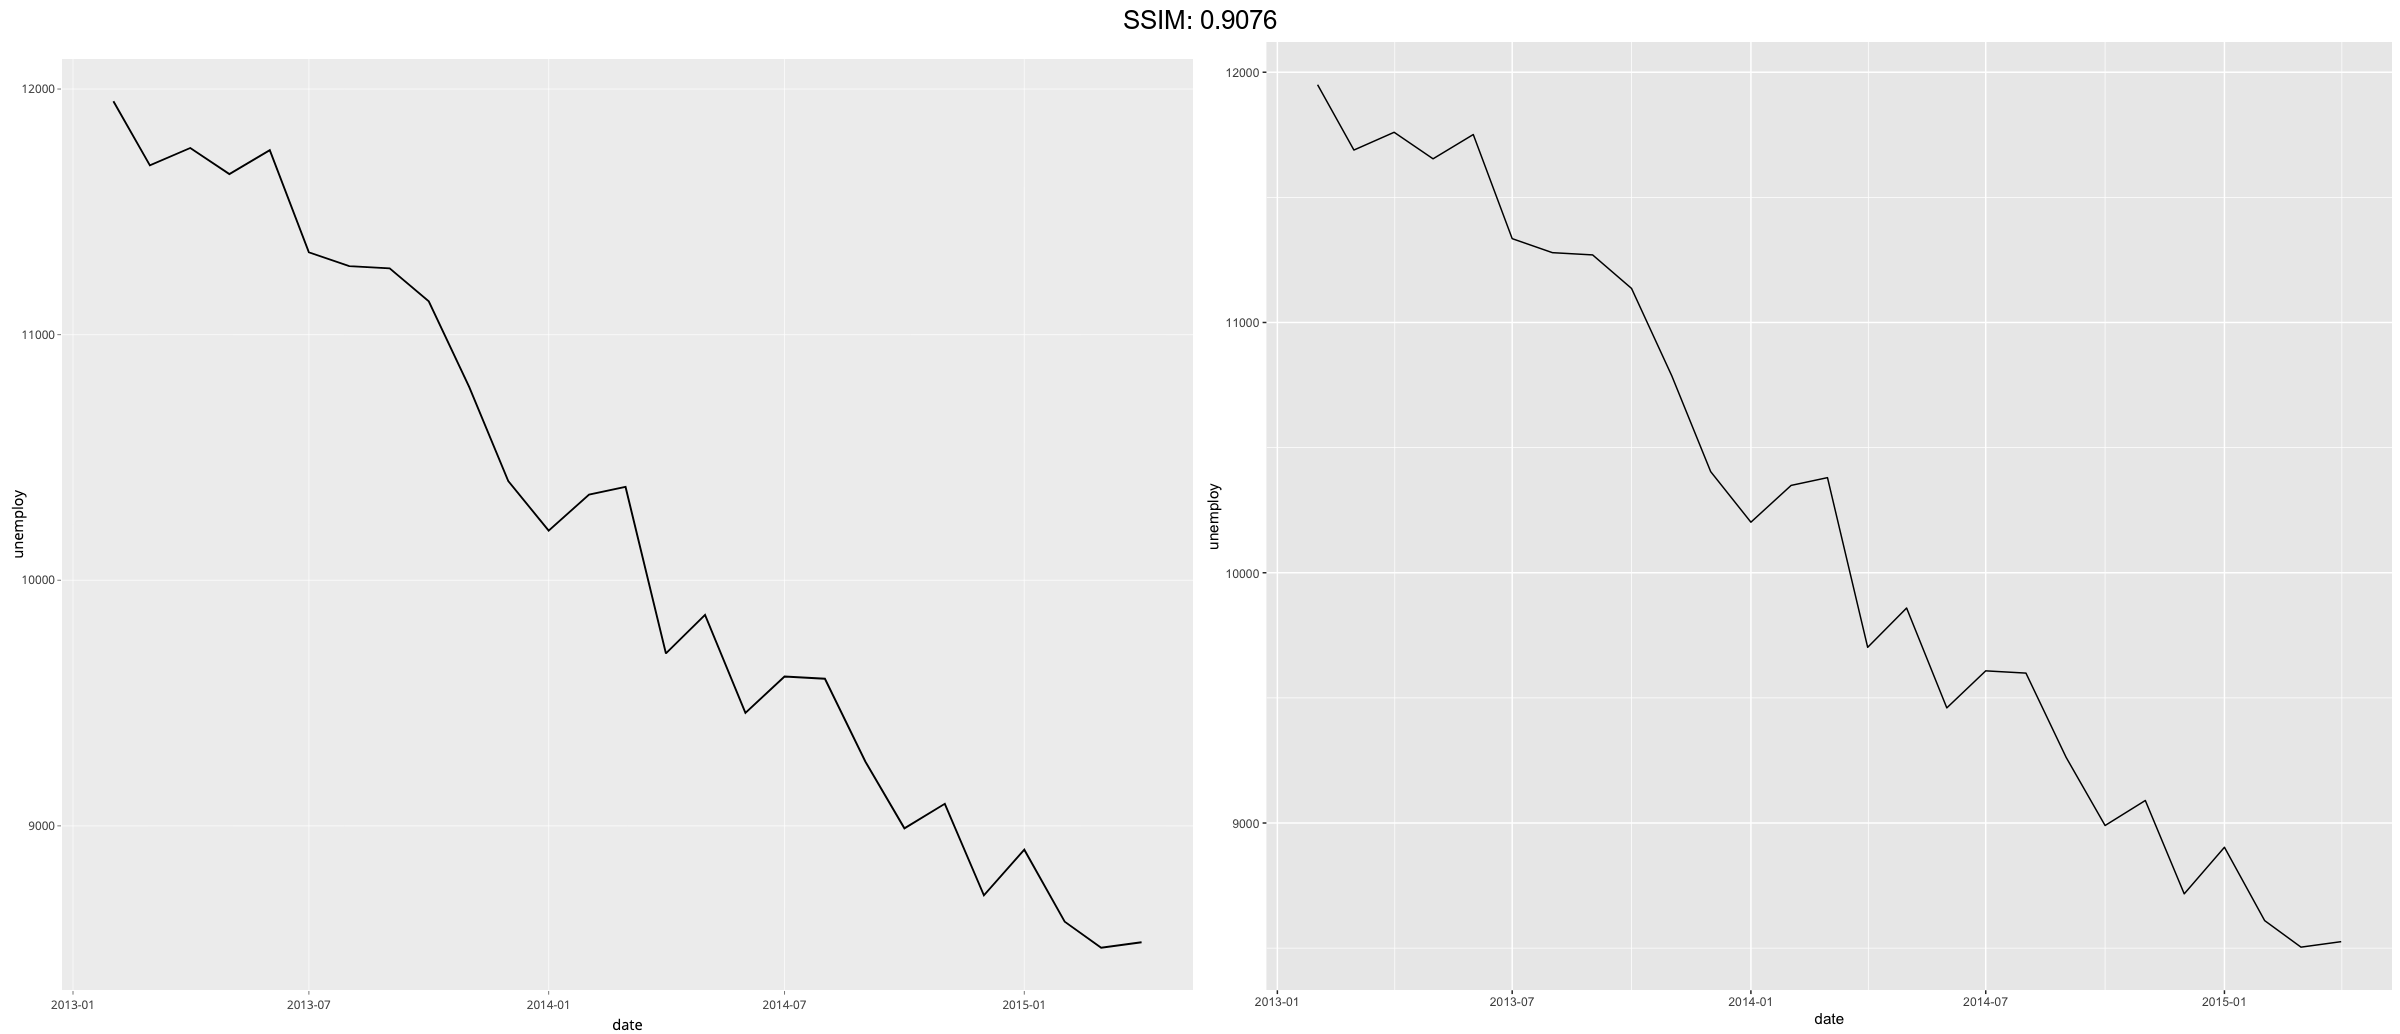
recent <- economics[economics$date > as.Date("2013-01-01"), ]
p <-  ggplot(recent, aes(date, unemploy)) + geom_line()
plotly::ggplotly(p)

recent <- economics[economics$date > as.Date("2013-01-01"), ]
p <-  ggplot(recent, aes(date, unemploy)) + geom_step()
plotly::ggplotly(p)


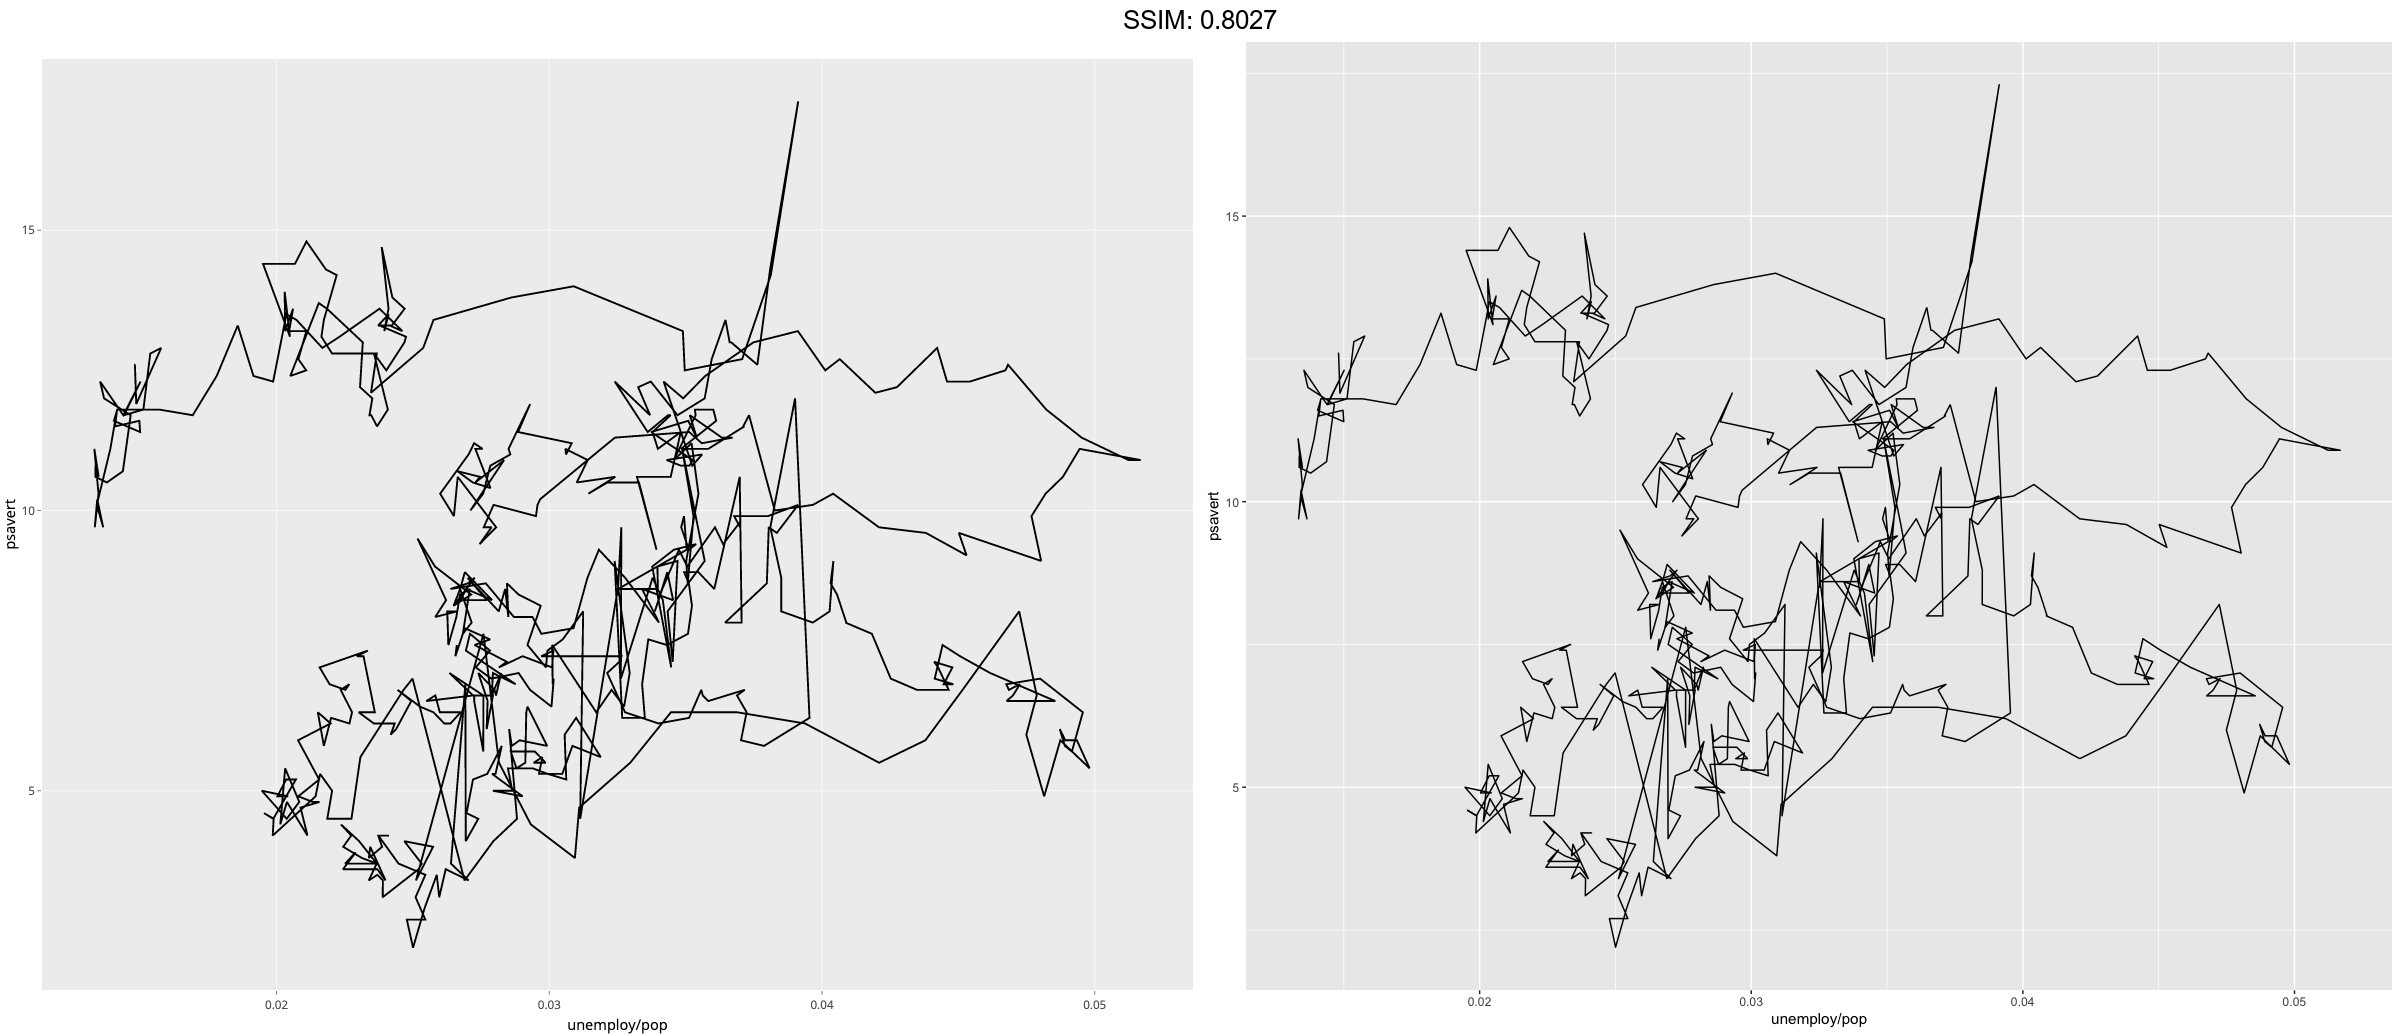
m <- ggplot(economics, aes(unemploy/pop, psavert))
p <-  m + geom_path()
plotly::ggplotly(p)

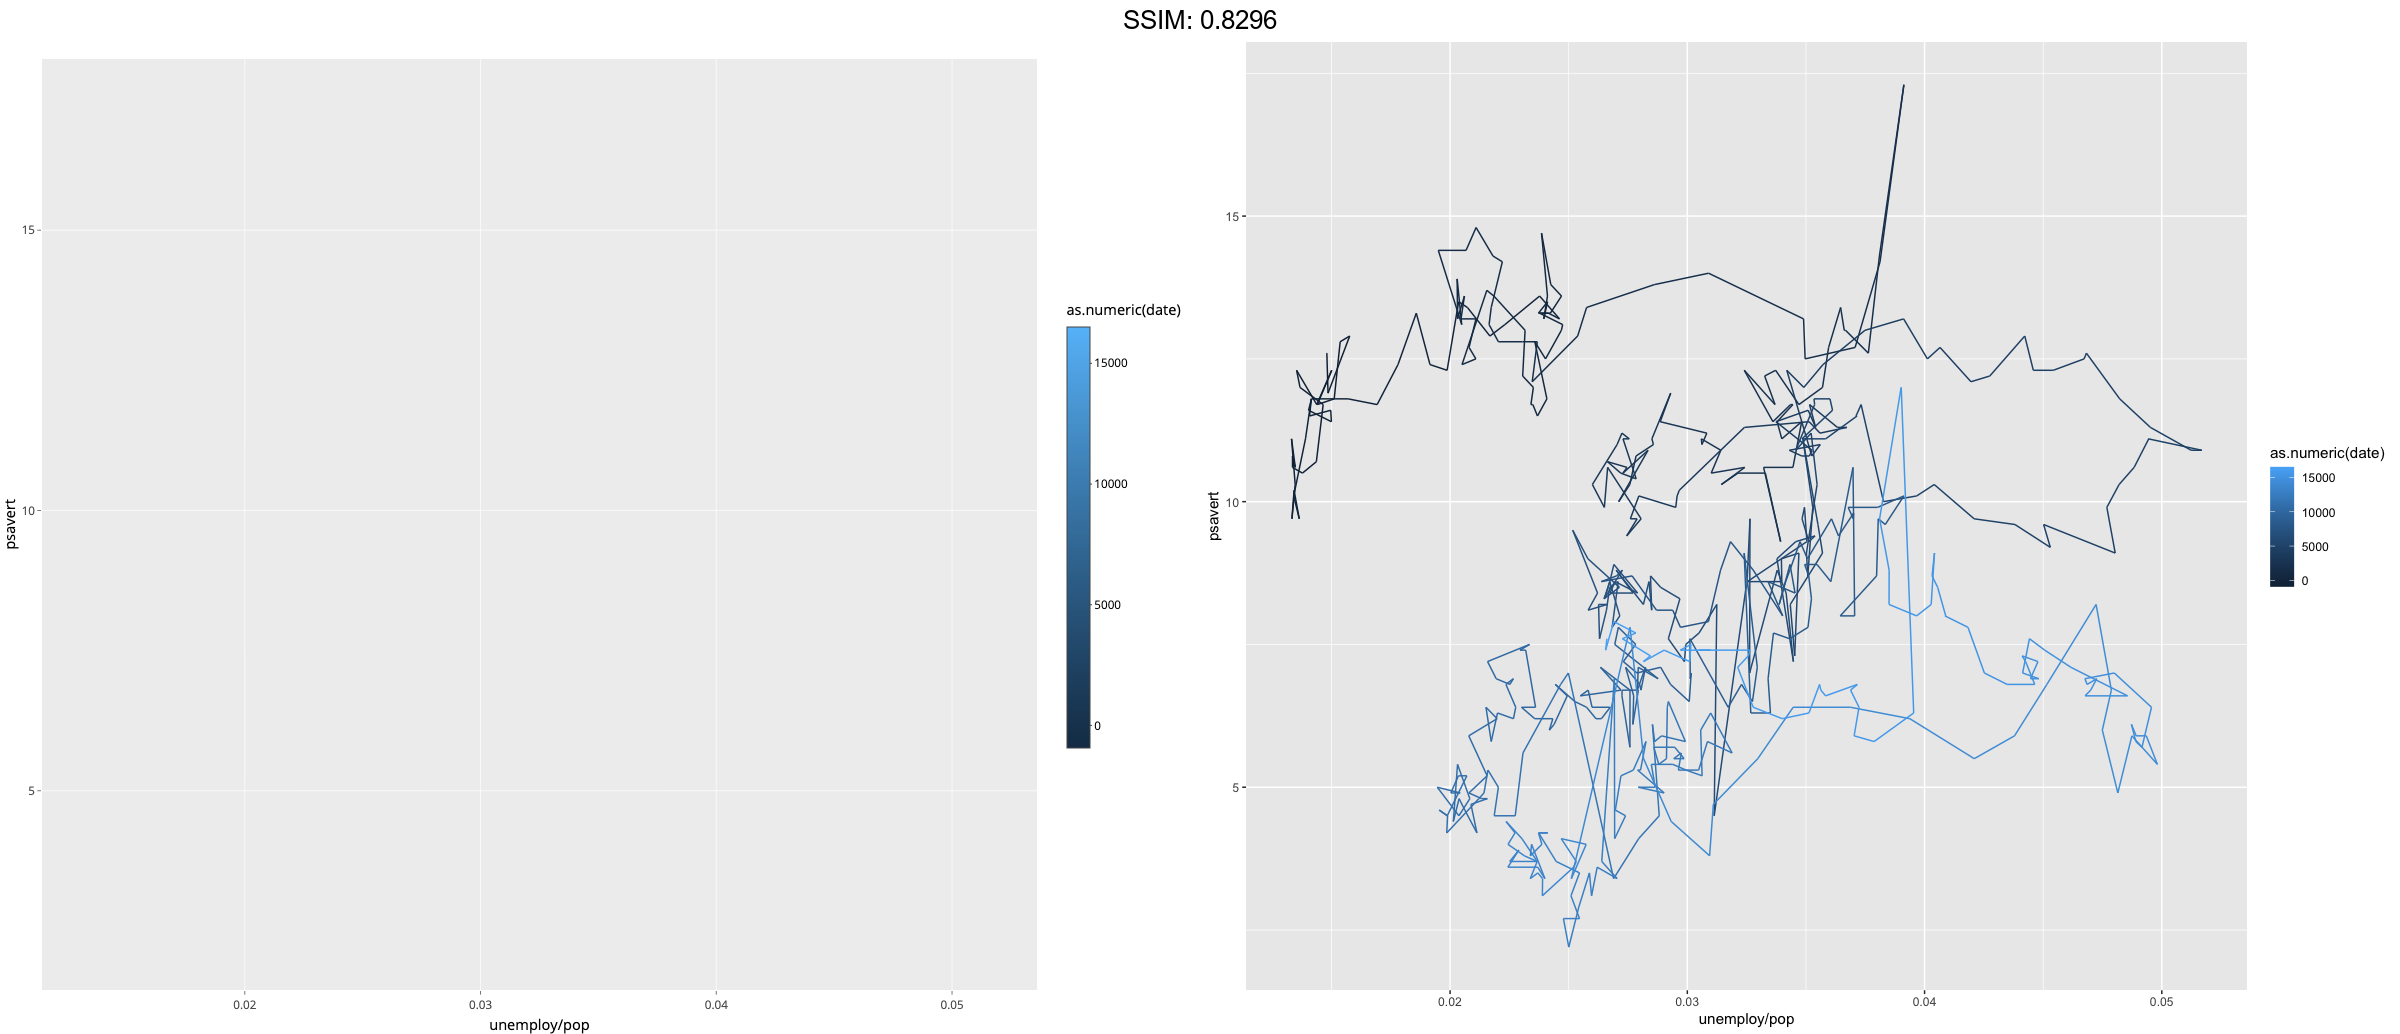
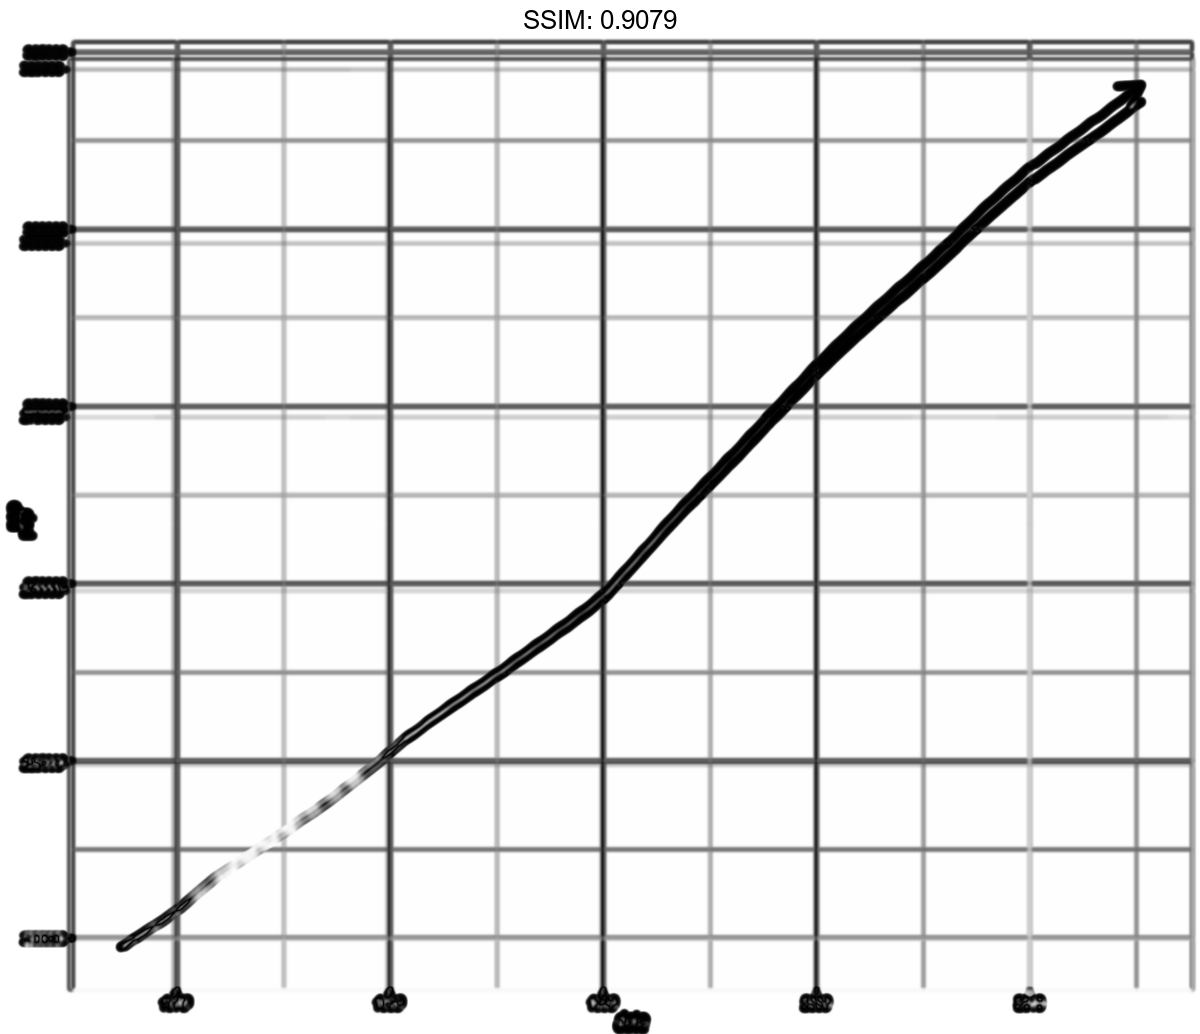
m <- ggplot(economics, aes(unemploy/pop, psavert))
p <-  m + geom_path(aes(colour = as.numeric(date)))
plotly::ggplotly(p)

p <-
 ggplot(economics, aes(date, unemploy)) +
  geom_line(colour = "red")
plotly::ggplotly(p)

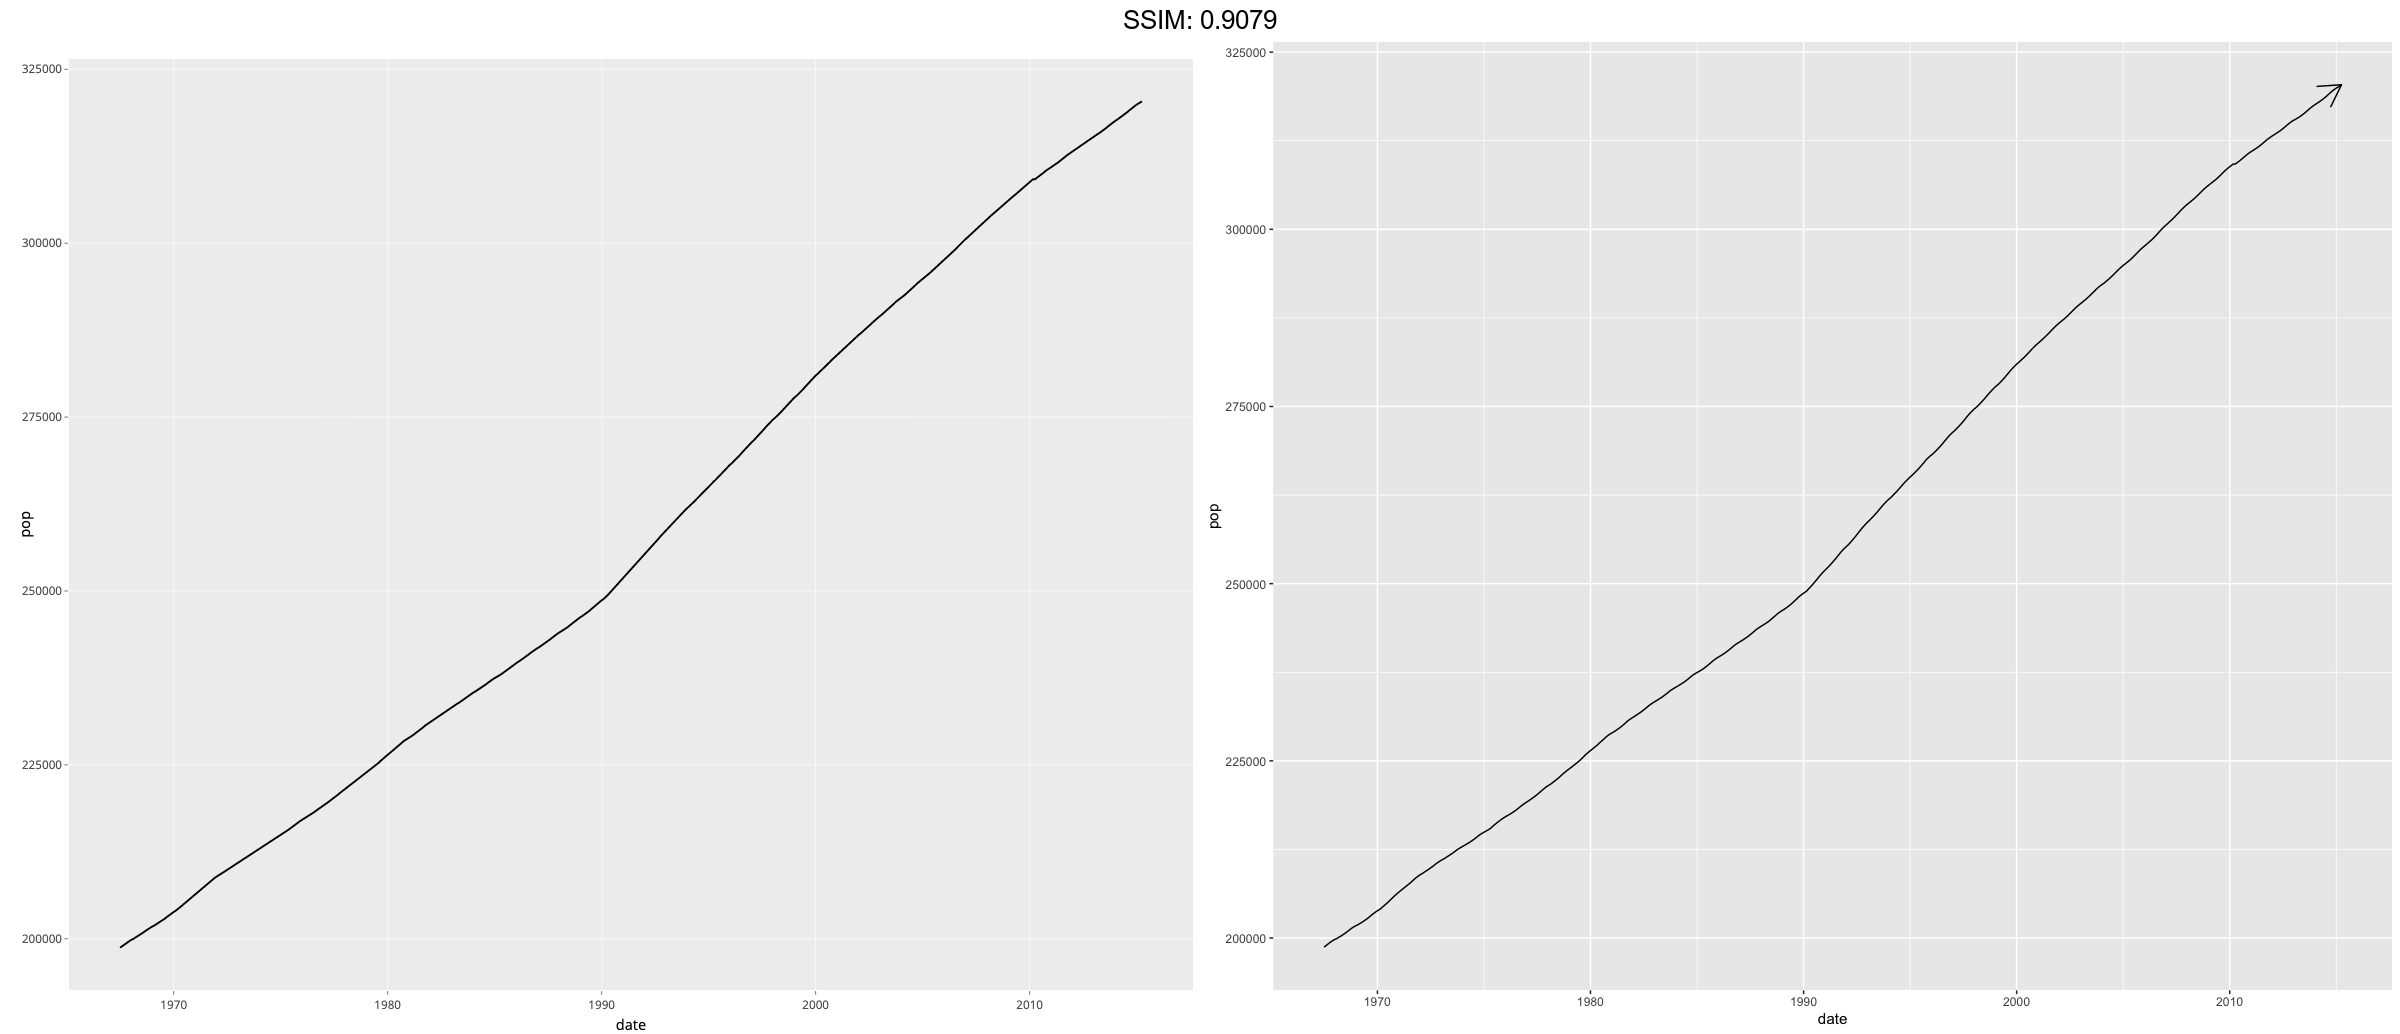
c <- ggplot(economics, aes(x = date, y = pop))
p <-  c + geom_line(arrow = arrow())
plotly::ggplotly(p)
c <- ggplot(economics, aes(x = date, y = pop))
p <-
 c + geom_line(
  arrow = arrow(angle = 15, ends = "both", type = "closed")
)
plotly::ggplotly(p)


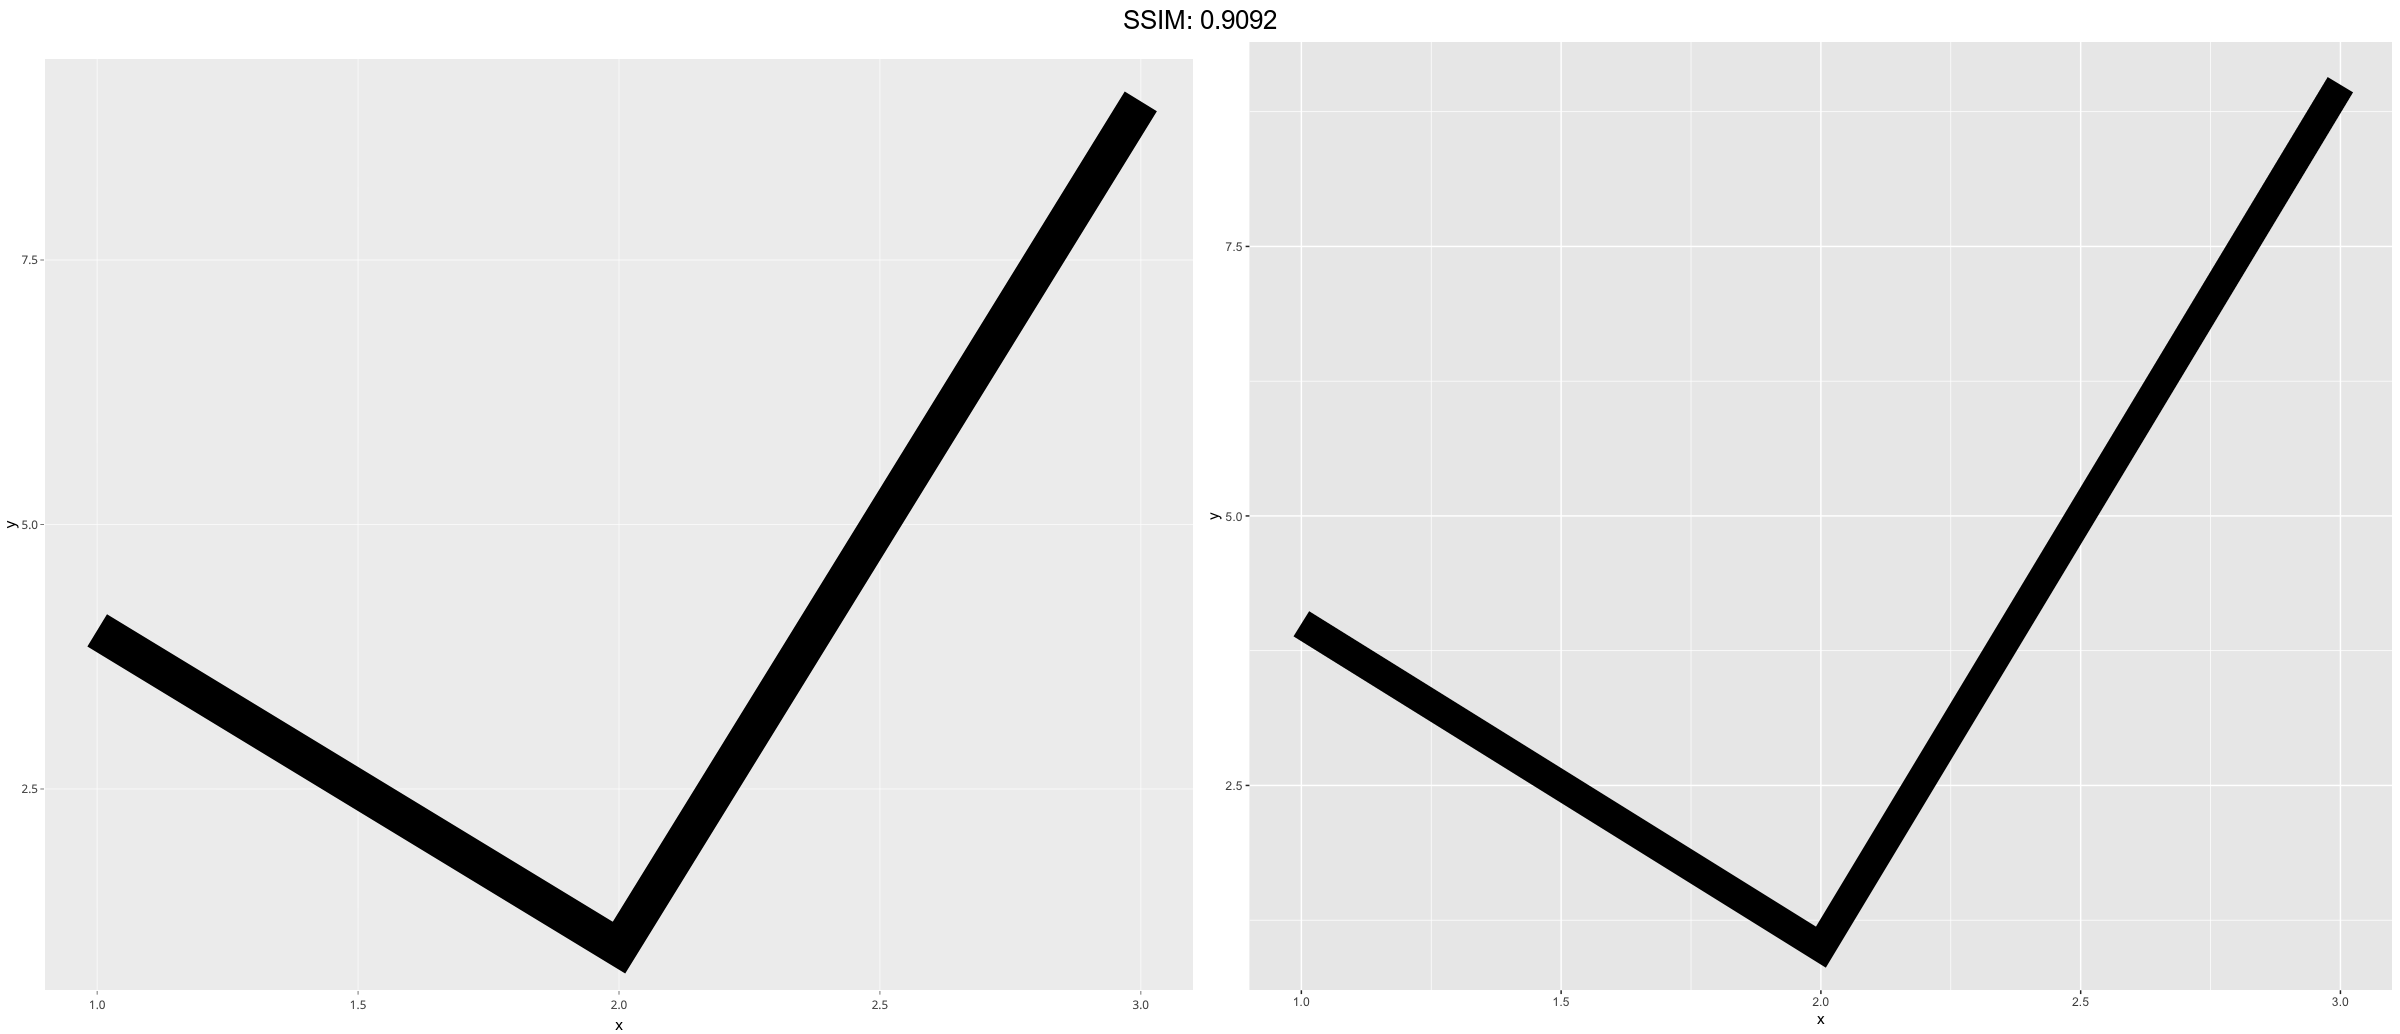
df <- data.frame(x = 1:3, y = c(4, 1, 9))
base <- ggplot(df, aes(x, y))
p <-  base + geom_path(size = 10)
plotly::ggplotly(p)


df <- data.frame(x = 1:3, y = c(4, 1, 9))
base <- ggplot(df, aes(x, y))
p <-  base + geom_path(size = 10, lineend = "round")
plotly::ggplotly(p)

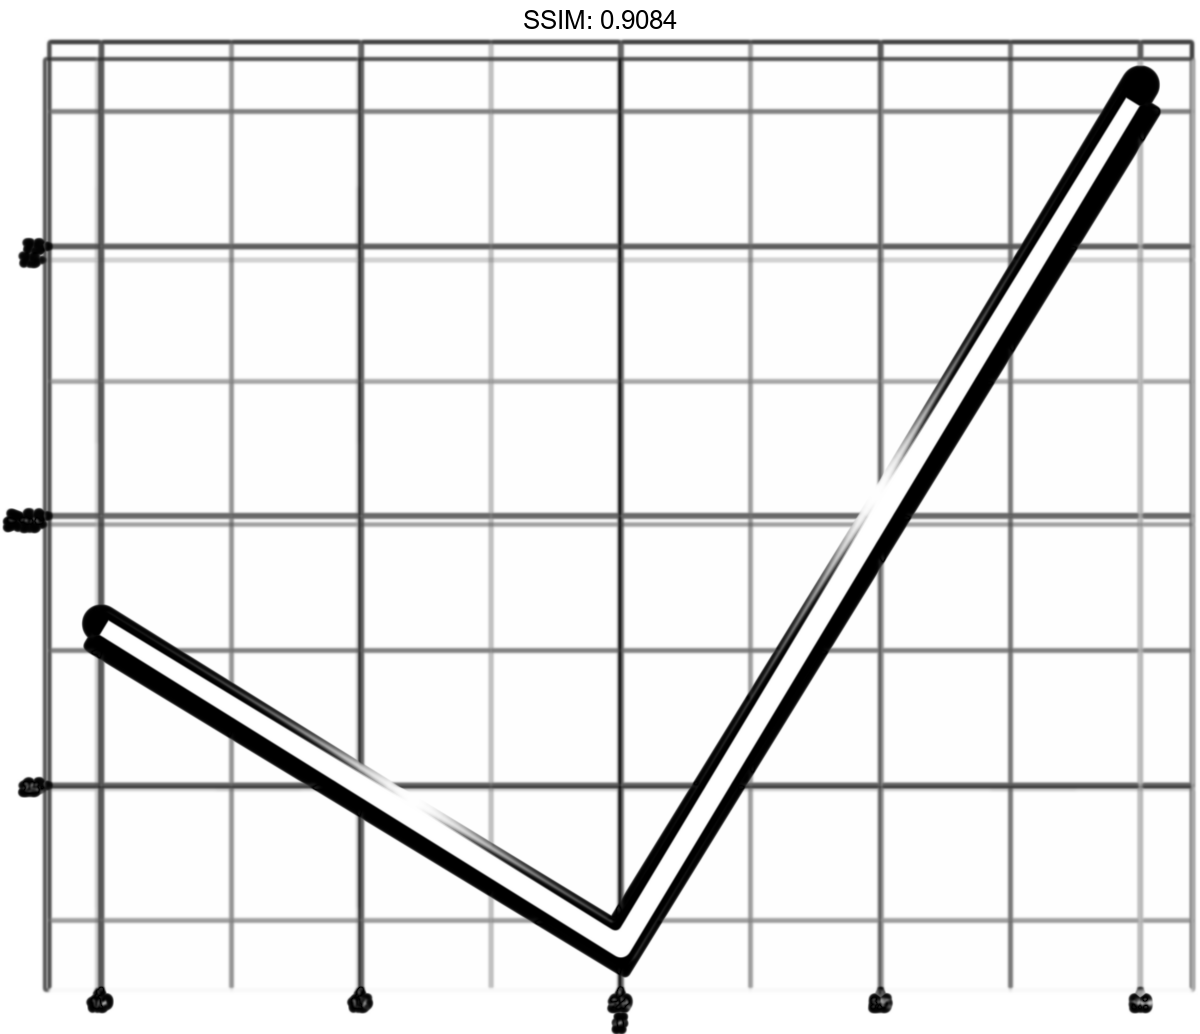
df <- data.frame(x = 1:3, y = c(4, 1, 9))
base <- ggplot(df, aes(x, y))
p <-  base + geom_path(size = 10, linejoin = "mitre", lineend = "butt")
plotly::ggplotly(p)

df <- data.frame(x = 1:5, y = c(1, 2, NA, 4, 5))
p <-  ggplot(df, aes(x, y)) + geom_point() + geom_line()
plotly::ggplotly(p)


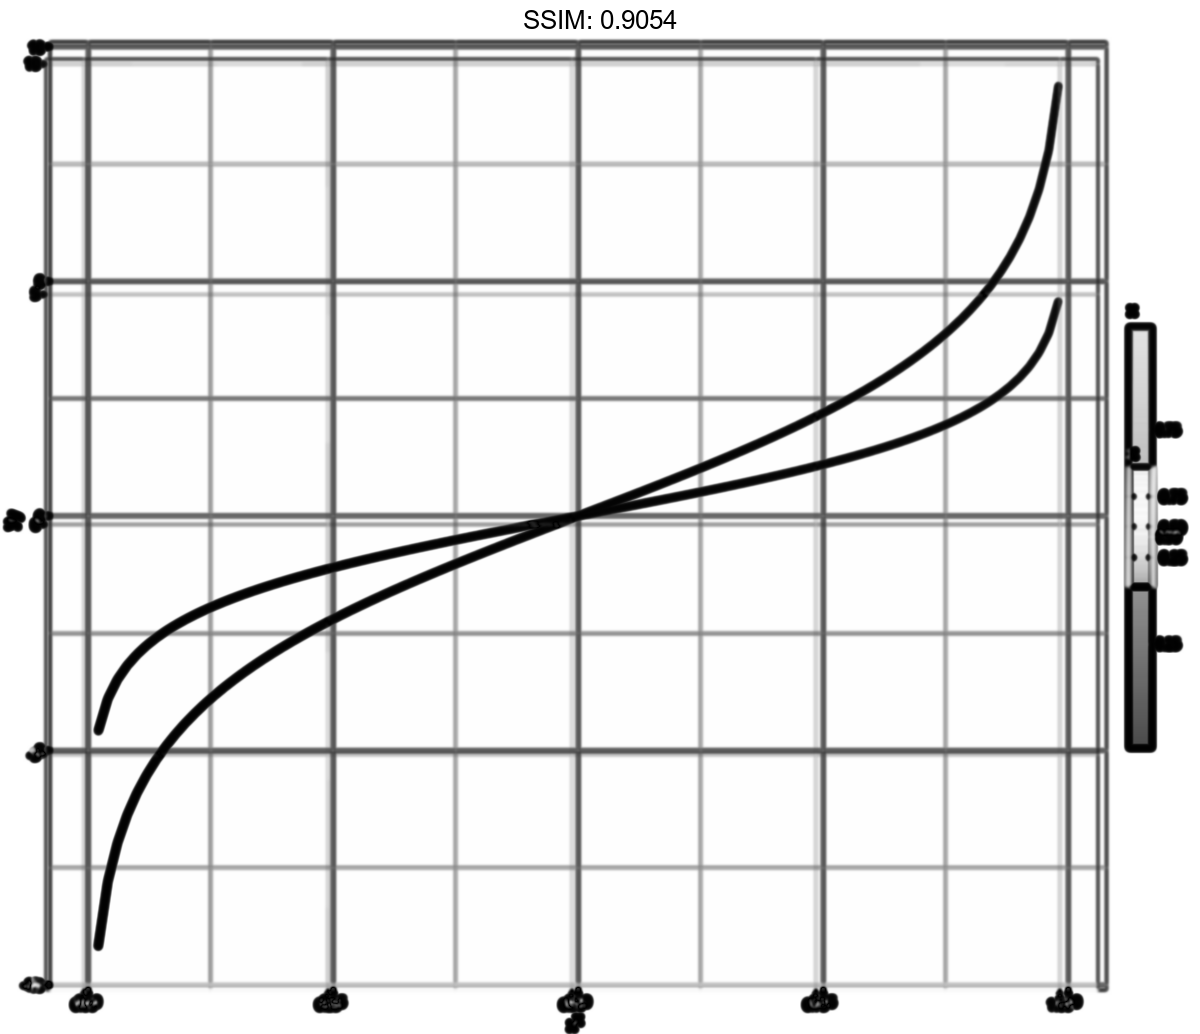
x <- seq(0.01, .99, length.out = 100)
df <- data.frame(
  x = rep(x, 2),
  y = c(qlogis(x), 2 * qlogis(x)),
  group = rep(c("a","b"),
  each = 100)
)
p <- ggplot(df, aes(x=x, y=y, group=group))
p <-  p + geom_line(linetype = 2)
plotly::ggplotly(p)


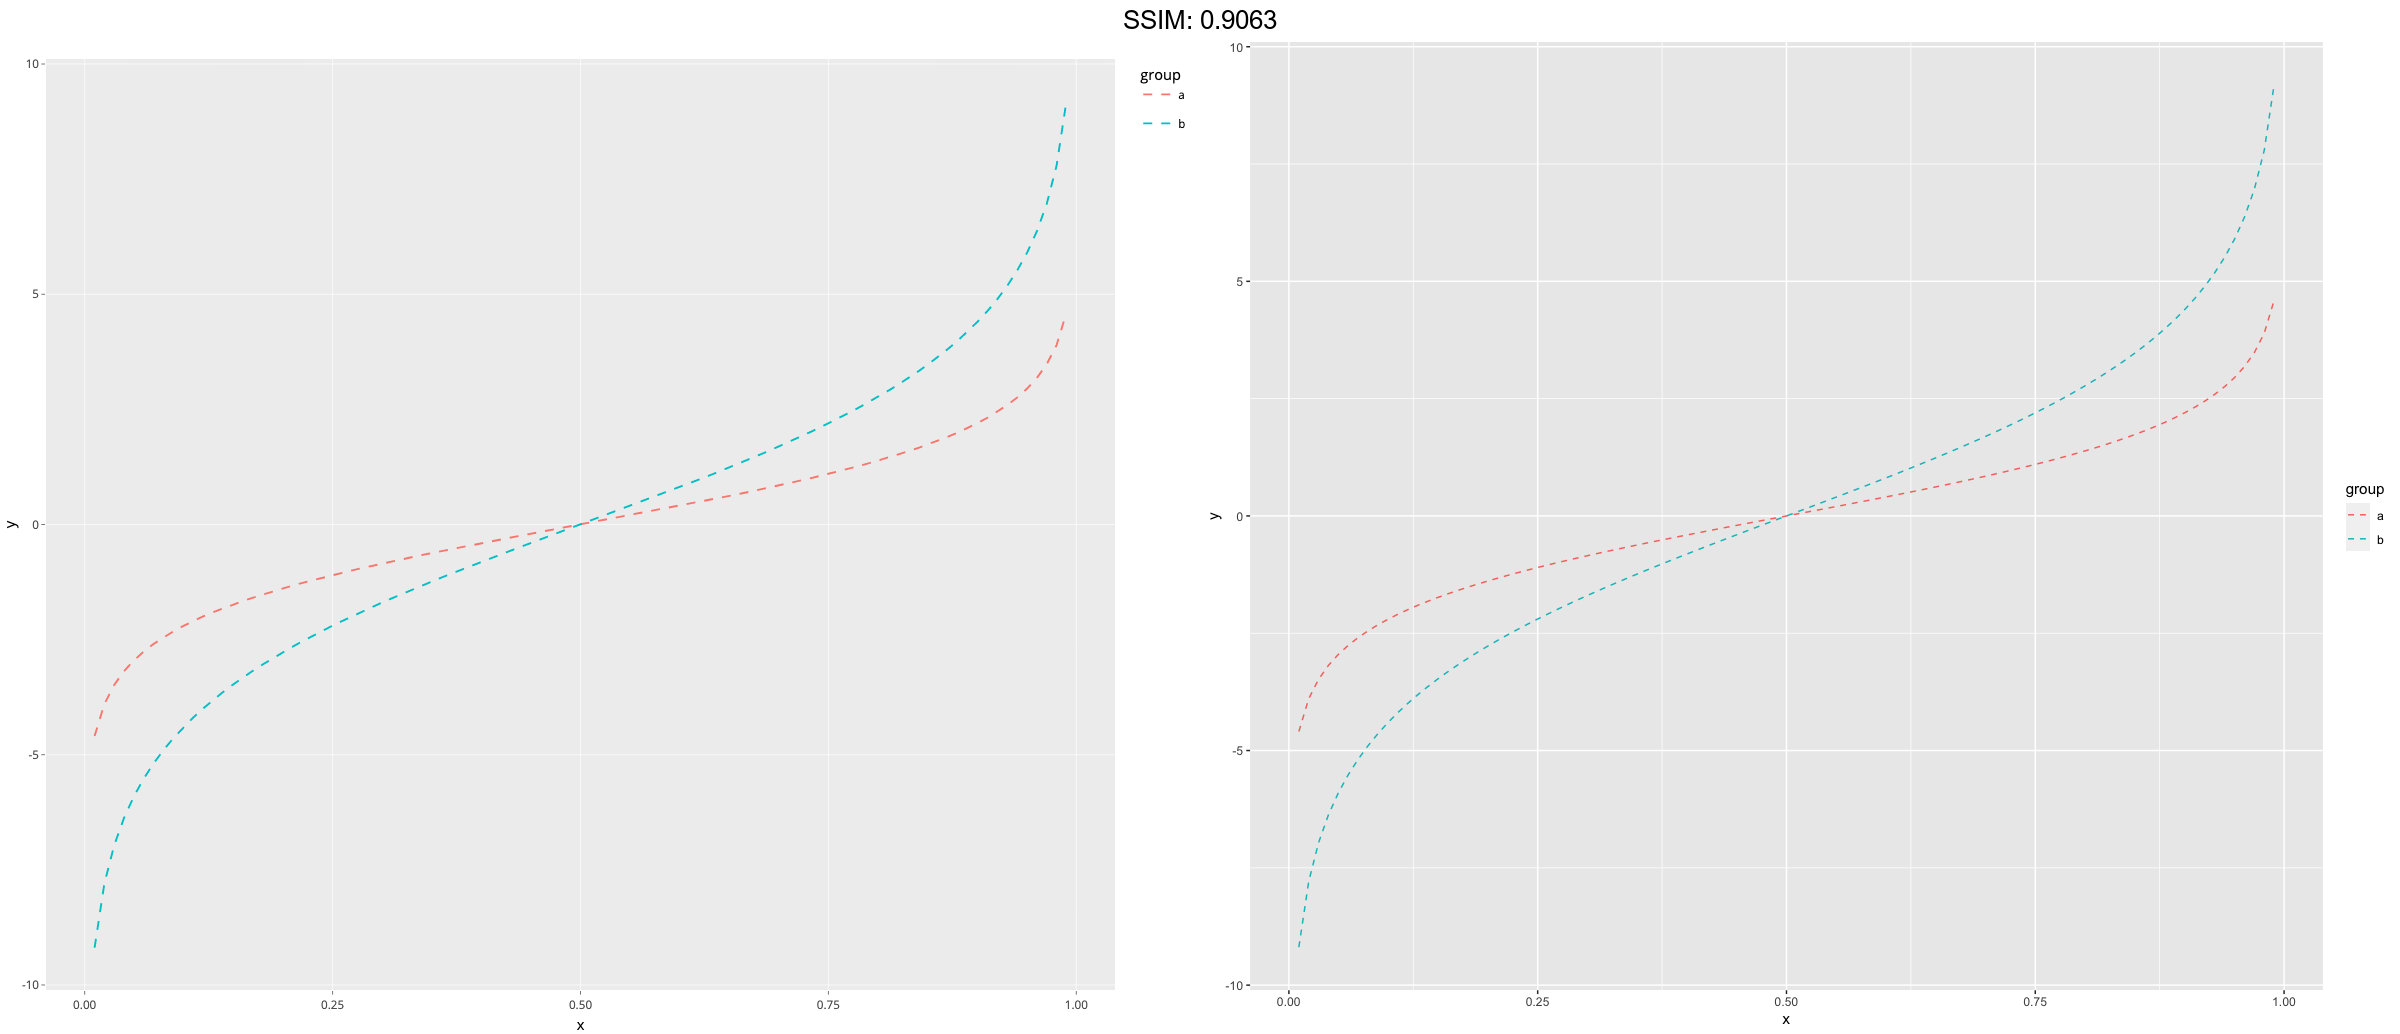
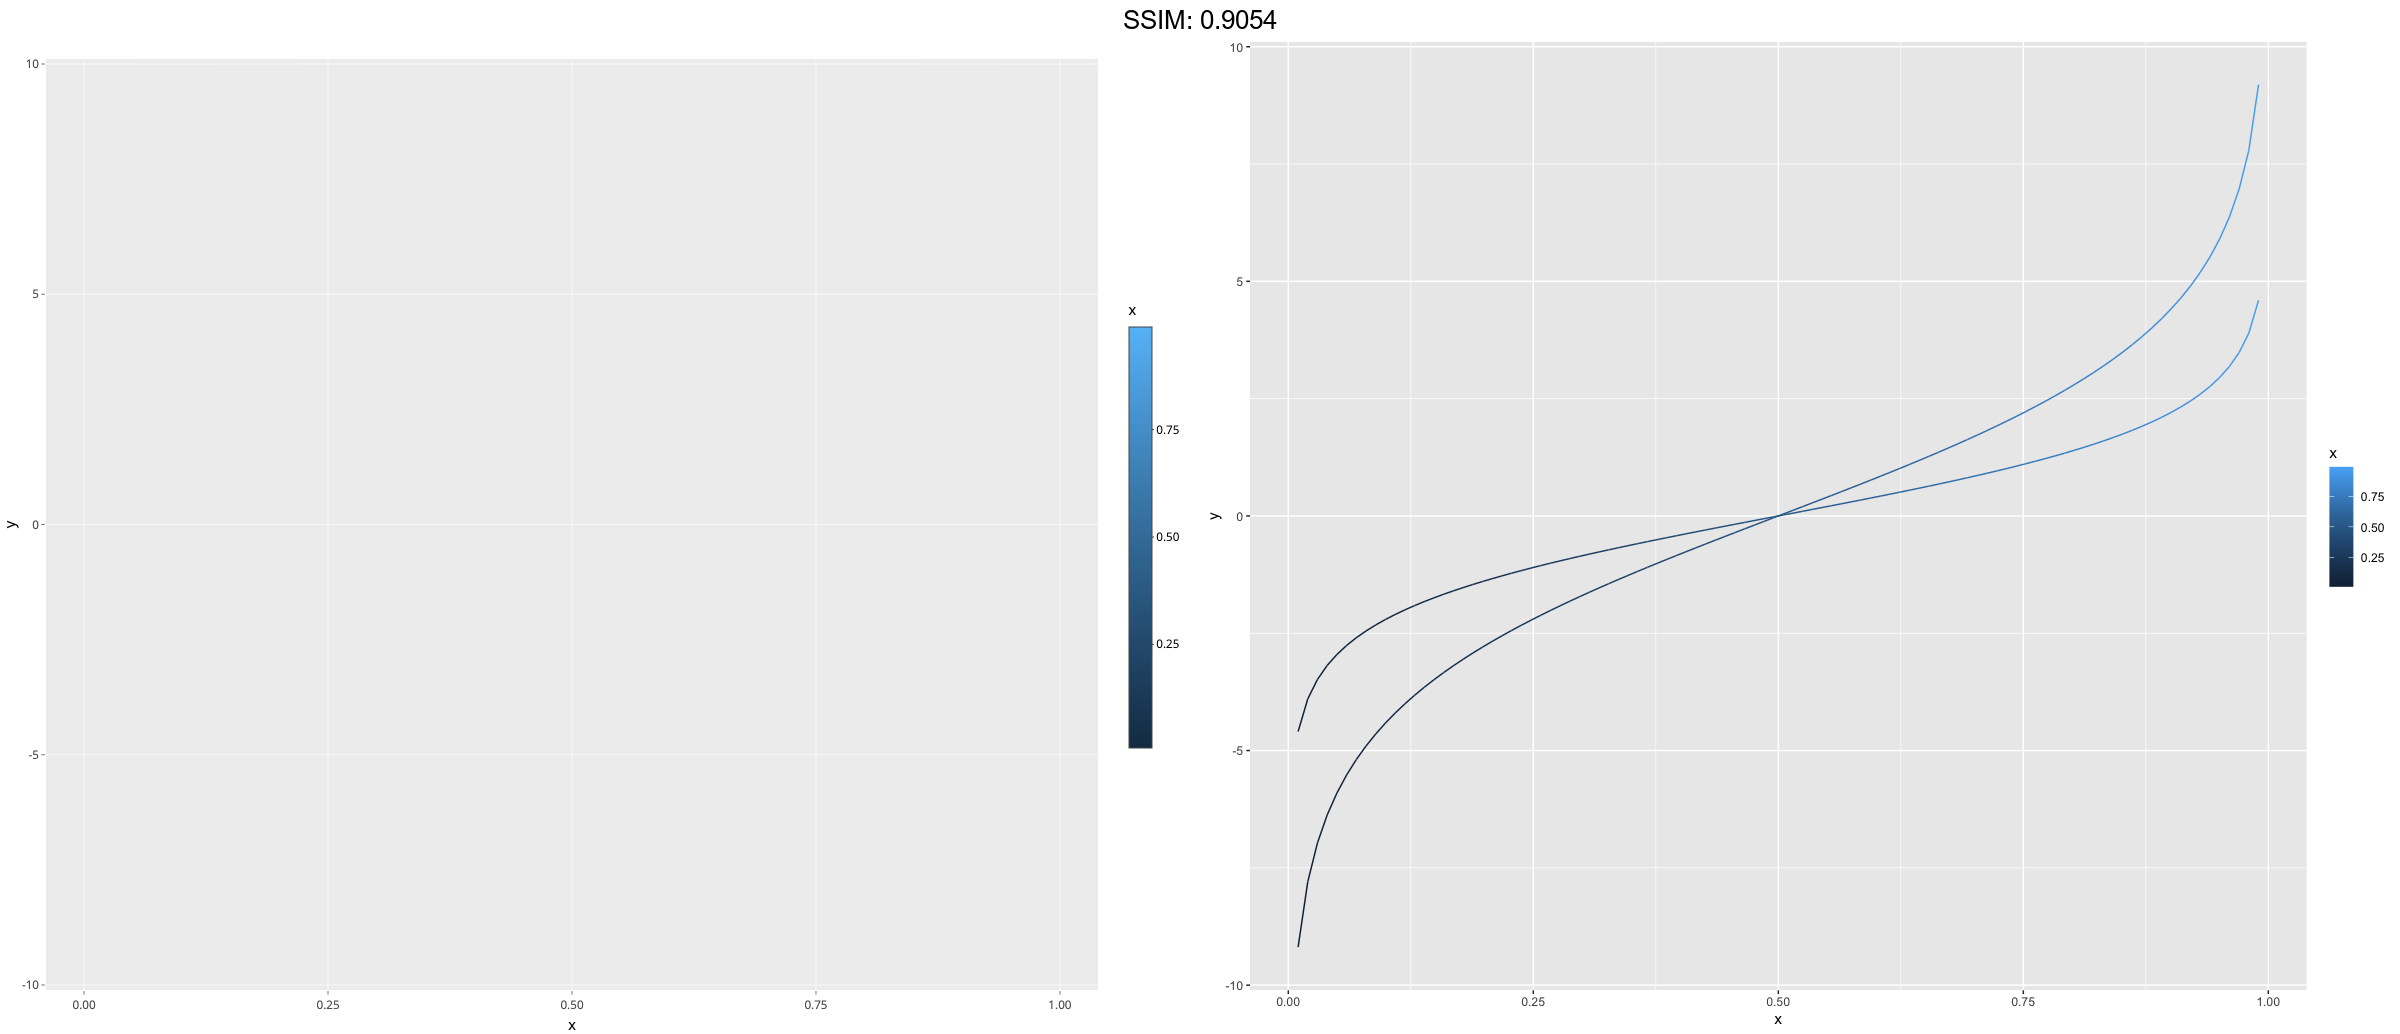
x <- seq(0.01, .99, length.out = 100)
df <- data.frame(
  x = rep(x, 2),
  y = c(qlogis(x), 2 * qlogis(x)),
  group = rep(c("a","b"),
  each = 100)
)
p <- ggplot(df, aes(x=x, y=y, group=group))
p <-  p + geom_line(aes(colour = group), linetype = 2)
plotly::ggplotly(p)
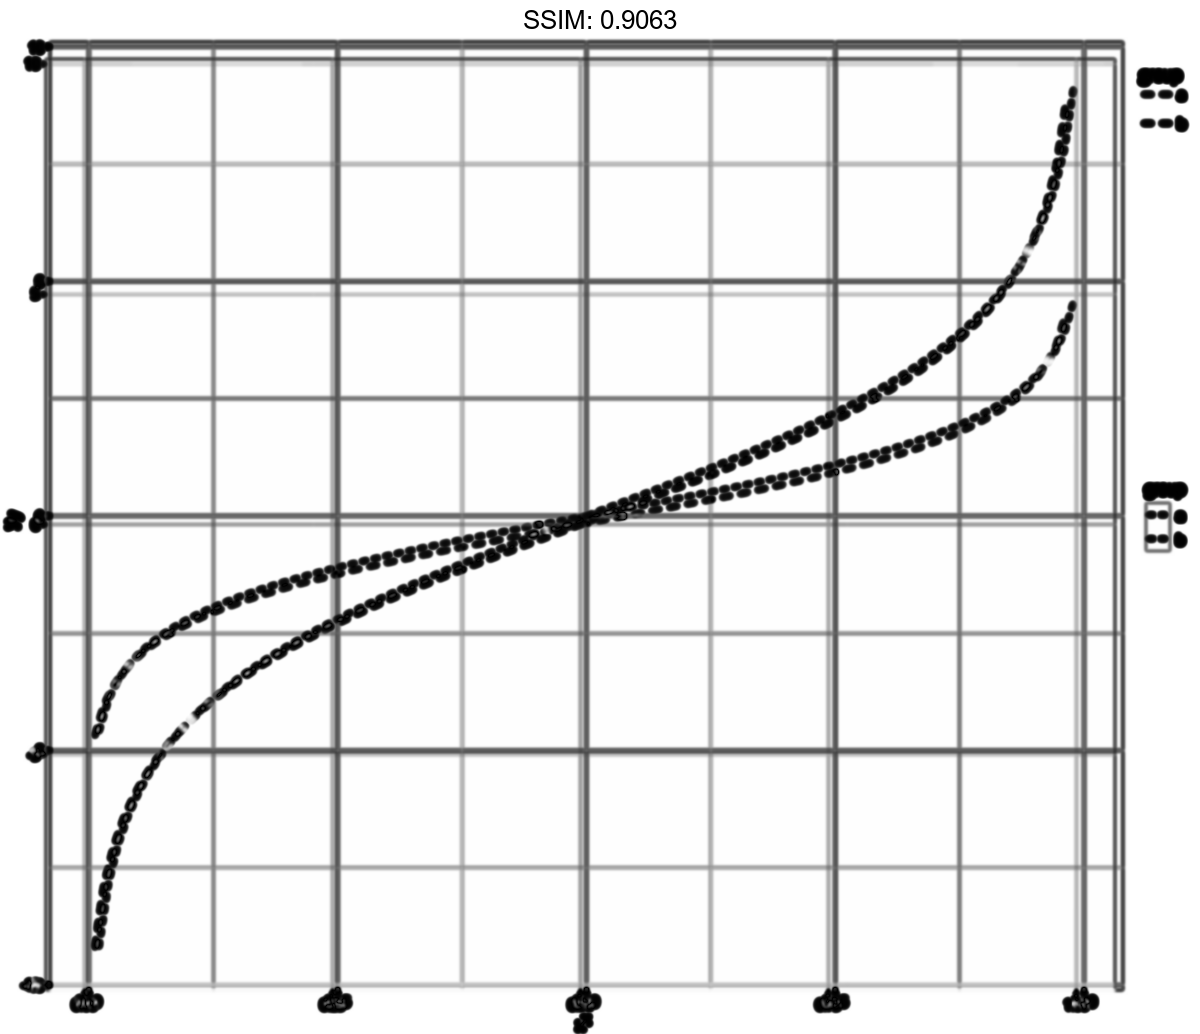
x <- seq(0.01, .99, length.out = 100)
df <- data.frame(
  x = rep(x, 2),
  y = c(qlogis(x), 2 * qlogis(x)),
  group = rep(c("a","b"),
  each = 100)
)
p <- ggplot(df, aes(x=x, y=y, group=group))
p <-  p + geom_line(aes(colour = x))
plotly::ggplotly(p)
x <- seq(0.01, .99, length.out = 100)
df <- data.frame(
  x = rep(x, 2),
  y = c(qlogis(x), 2 * qlogis(x)),
  group = rep(c("a","b"),
  each = 100)
)
p <- ggplot(df, aes(x=x, y=y, group=group))
p <-  should_stop(p + geom_line(aes(colour = x), linetype=2))
plotly::ggplotly(p)
## Error in UseMethod("api_create"): no applicable method for 'api_create' applied to an object of class "shiny.tag"