GGPLOT - geom_map
Create polygons from a reference map and then convert them with ggplotly
ids <- factor(c("1.1", "2.1", "1.2", "2.2", "1.3", "2.3"))

values <- data.frame(
  id = ids,
  value = c(3, 3.1, 3.1, 3.2, 3.15, 3.5)
)

positions <- data.frame(
  id = rep(ids, each = 4),
  x = c(2, 1, 1.1, 2.2, 1, 0, 0.3, 1.1, 2.2, 1.1, 1.2, 2.5, 1.1, 0.3,
  0.5, 1.2, 2.5, 1.2, 1.3, 2.7, 1.2, 0.5, 0.6, 1.3),
  y = c(-0.5, 0, 1, 0.5, 0, 0.5, 1.5, 1, 0.5, 1, 2.1, 1.7, 1, 1.5,
  2.2, 2.1, 1.7, 2.1, 3.2, 2.8, 2.1, 2.2, 3.3, 3.2)
)
p <-
 ggplot(values) +
  geom_map(aes(map_id = id), map = positions) +
  expand_limits(positions)
plotly::ggplotly(p)

ids <- factor(c("1.1", "2.1", "1.2", "2.2", "1.3", "2.3"))
values <- data.frame(
id = ids,
value = c(3, 3.1, 3.1, 3.2, 3.15, 3.5)
)
positions <- data.frame(
id = rep(ids, each = 4),
x = c(2, 1, 1.1, 2.2, 1, 0, 0.3, 1.1, 2.2, 1.1, 1.2, 2.5, 1.1, 0.3,
0.5, 1.2, 2.5, 1.2, 1.3, 2.7, 1.2, 0.5, 0.6, 1.3),
y = c(-0.5, 0, 1, 0.5, 0, 0.5, 1.5, 1, 0.5, 1, 2.1, 1.7, 1, 1.5,
2.2, 2.1, 1.7, 2.1, 3.2, 2.8, 2.1, 2.2, 3.3, 3.2)
)
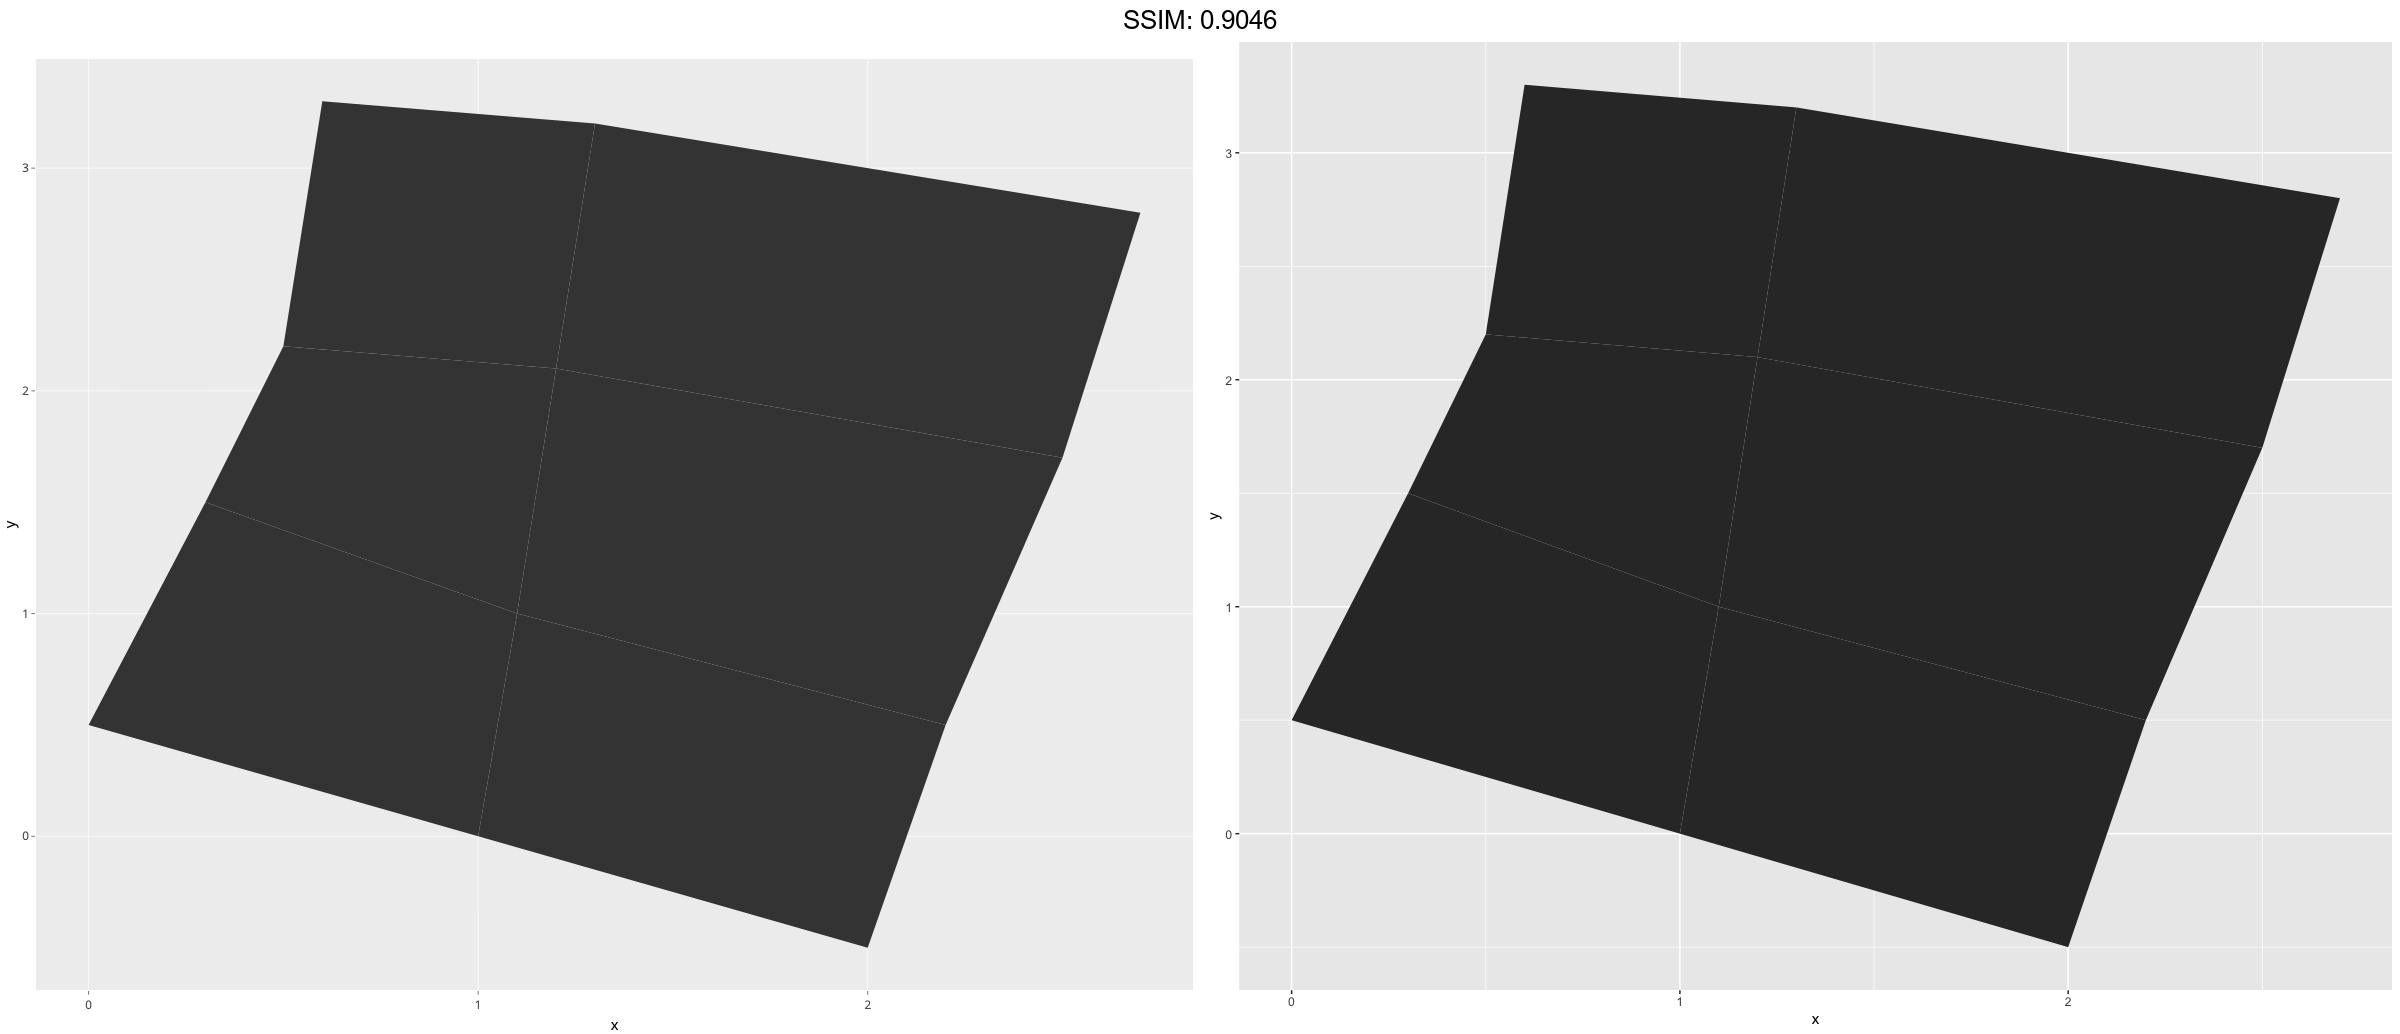
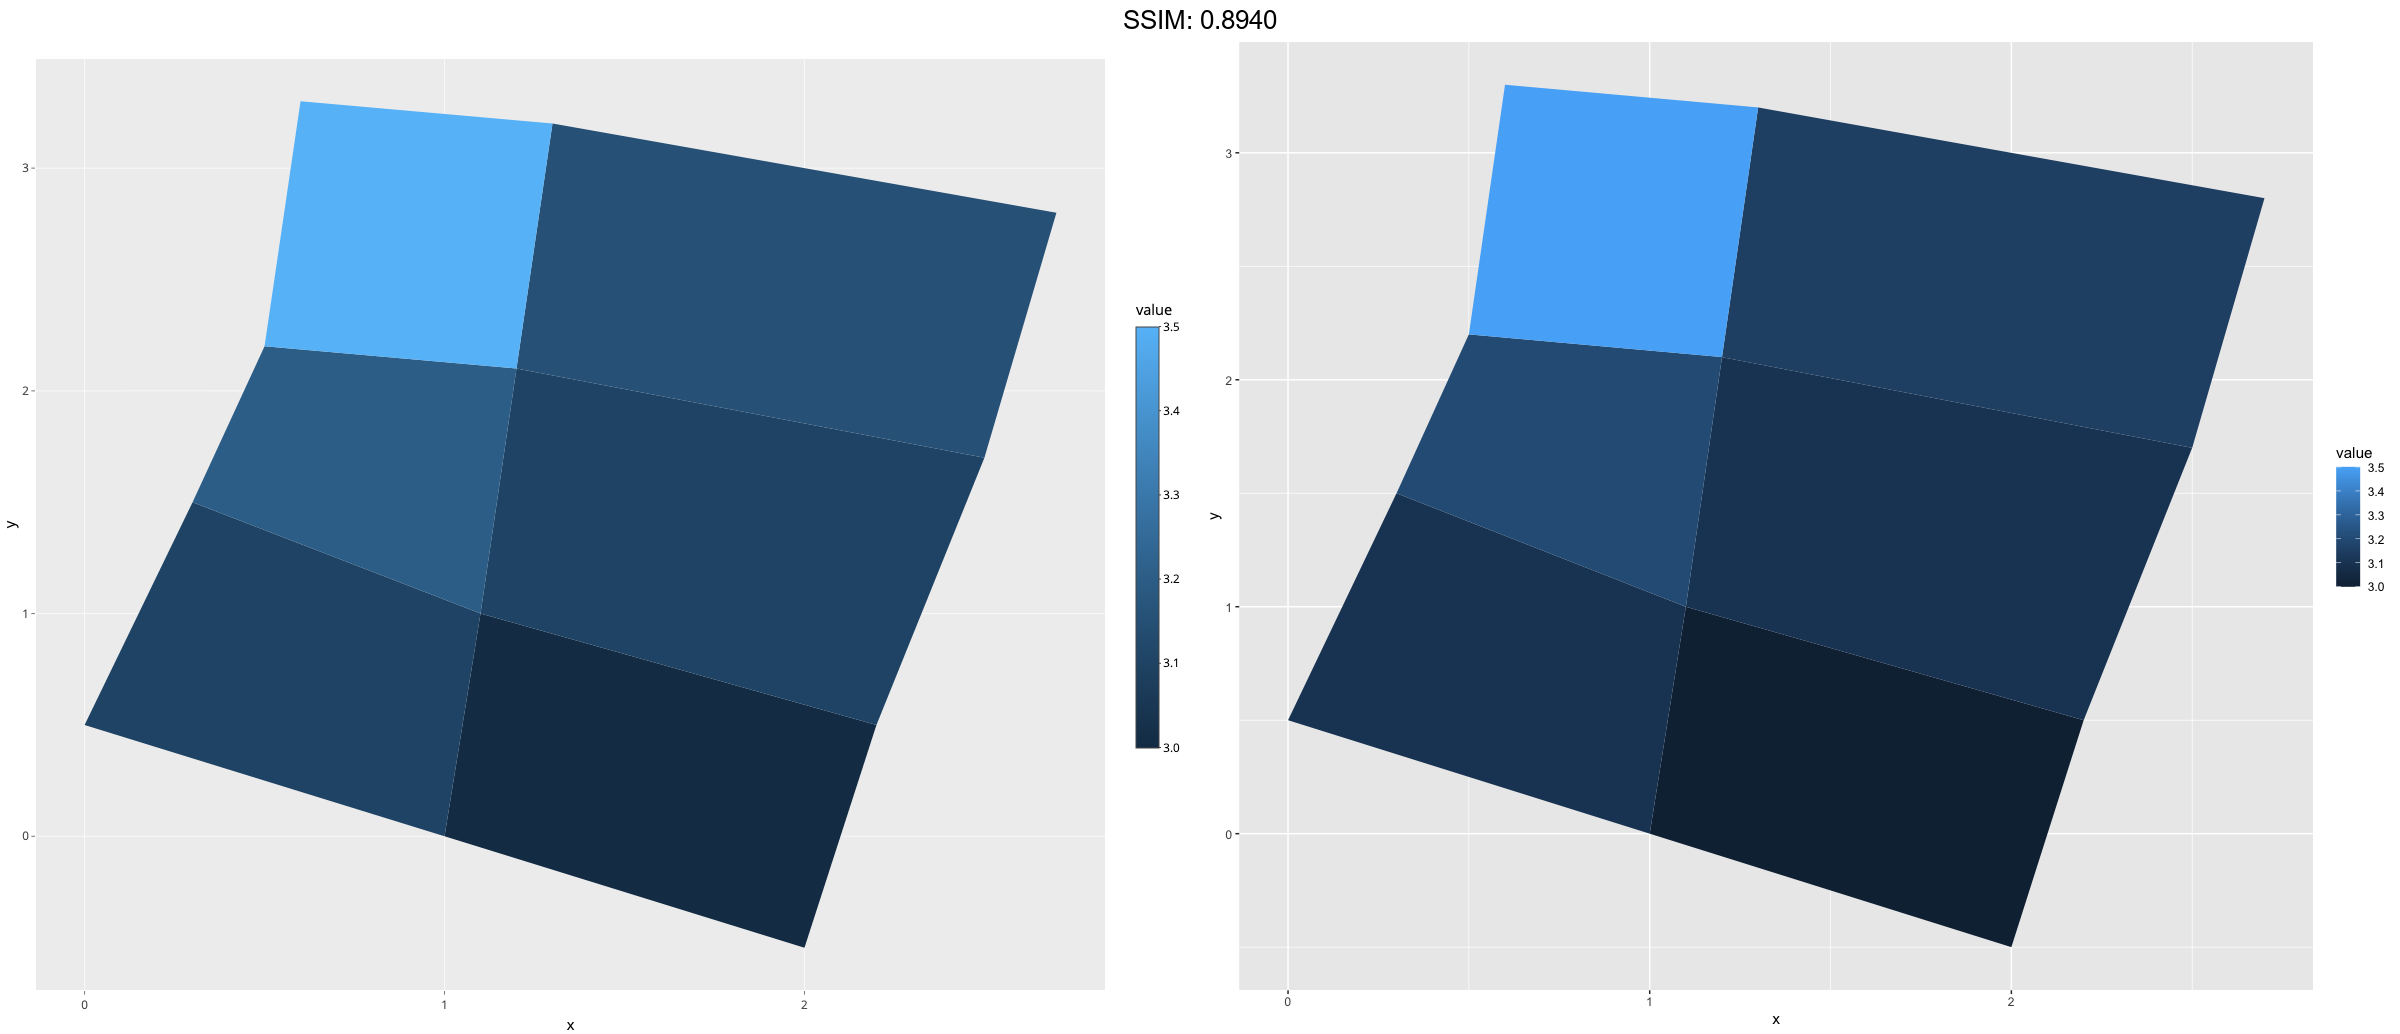
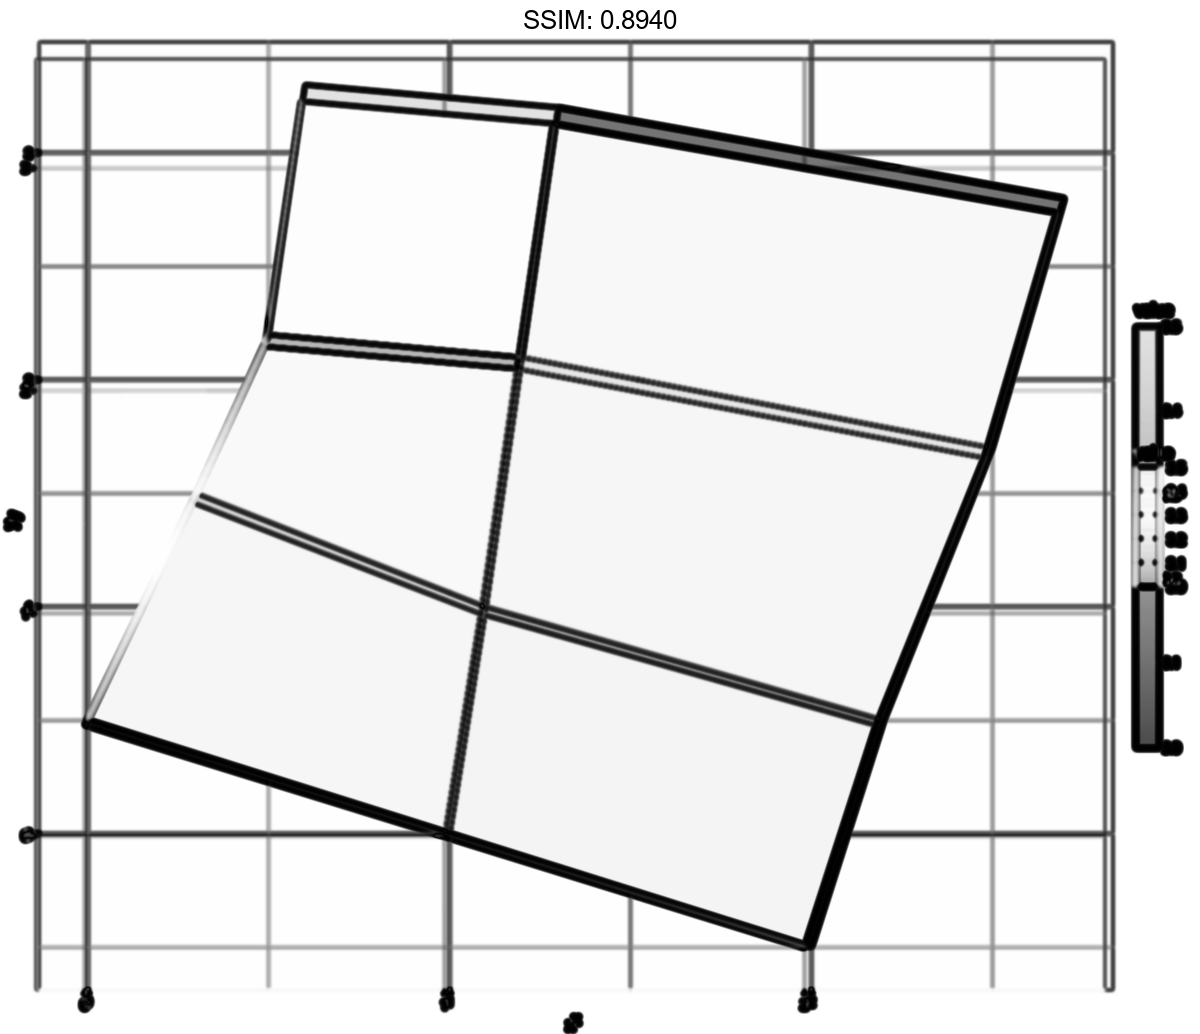
p <-
ggplot(values, aes(fill = value)) +
geom_map(aes(map_id = id), map = positions) +
expand_limits(positions)
plotly::ggplotly(p)
ids <- factor(c("1.1", "2.1", "1.2", "2.2", "1.3", "2.3"))
values <- data.frame(
id = ids,
value = c(3, 3.1, 3.1, 3.2, 3.15, 3.5)
)
positions <- data.frame(
id = rep(ids, each = 4),
x = c(2, 1, 1.1, 2.2, 1, 0, 0.3, 1.1, 2.2, 1.1, 1.2, 2.5, 1.1, 0.3,
0.5, 1.2, 2.5, 1.2, 1.3, 2.7, 1.2, 0.5, 0.6, 1.3),
y = c(-0.5, 0, 1, 0.5, 0, 0.5, 1.5, 1, 0.5, 1, 2.1, 1.7, 1, 1.5,
2.2, 2.1, 1.7, 2.1, 3.2, 2.8, 2.1, 2.2, 3.3, 3.2)
)
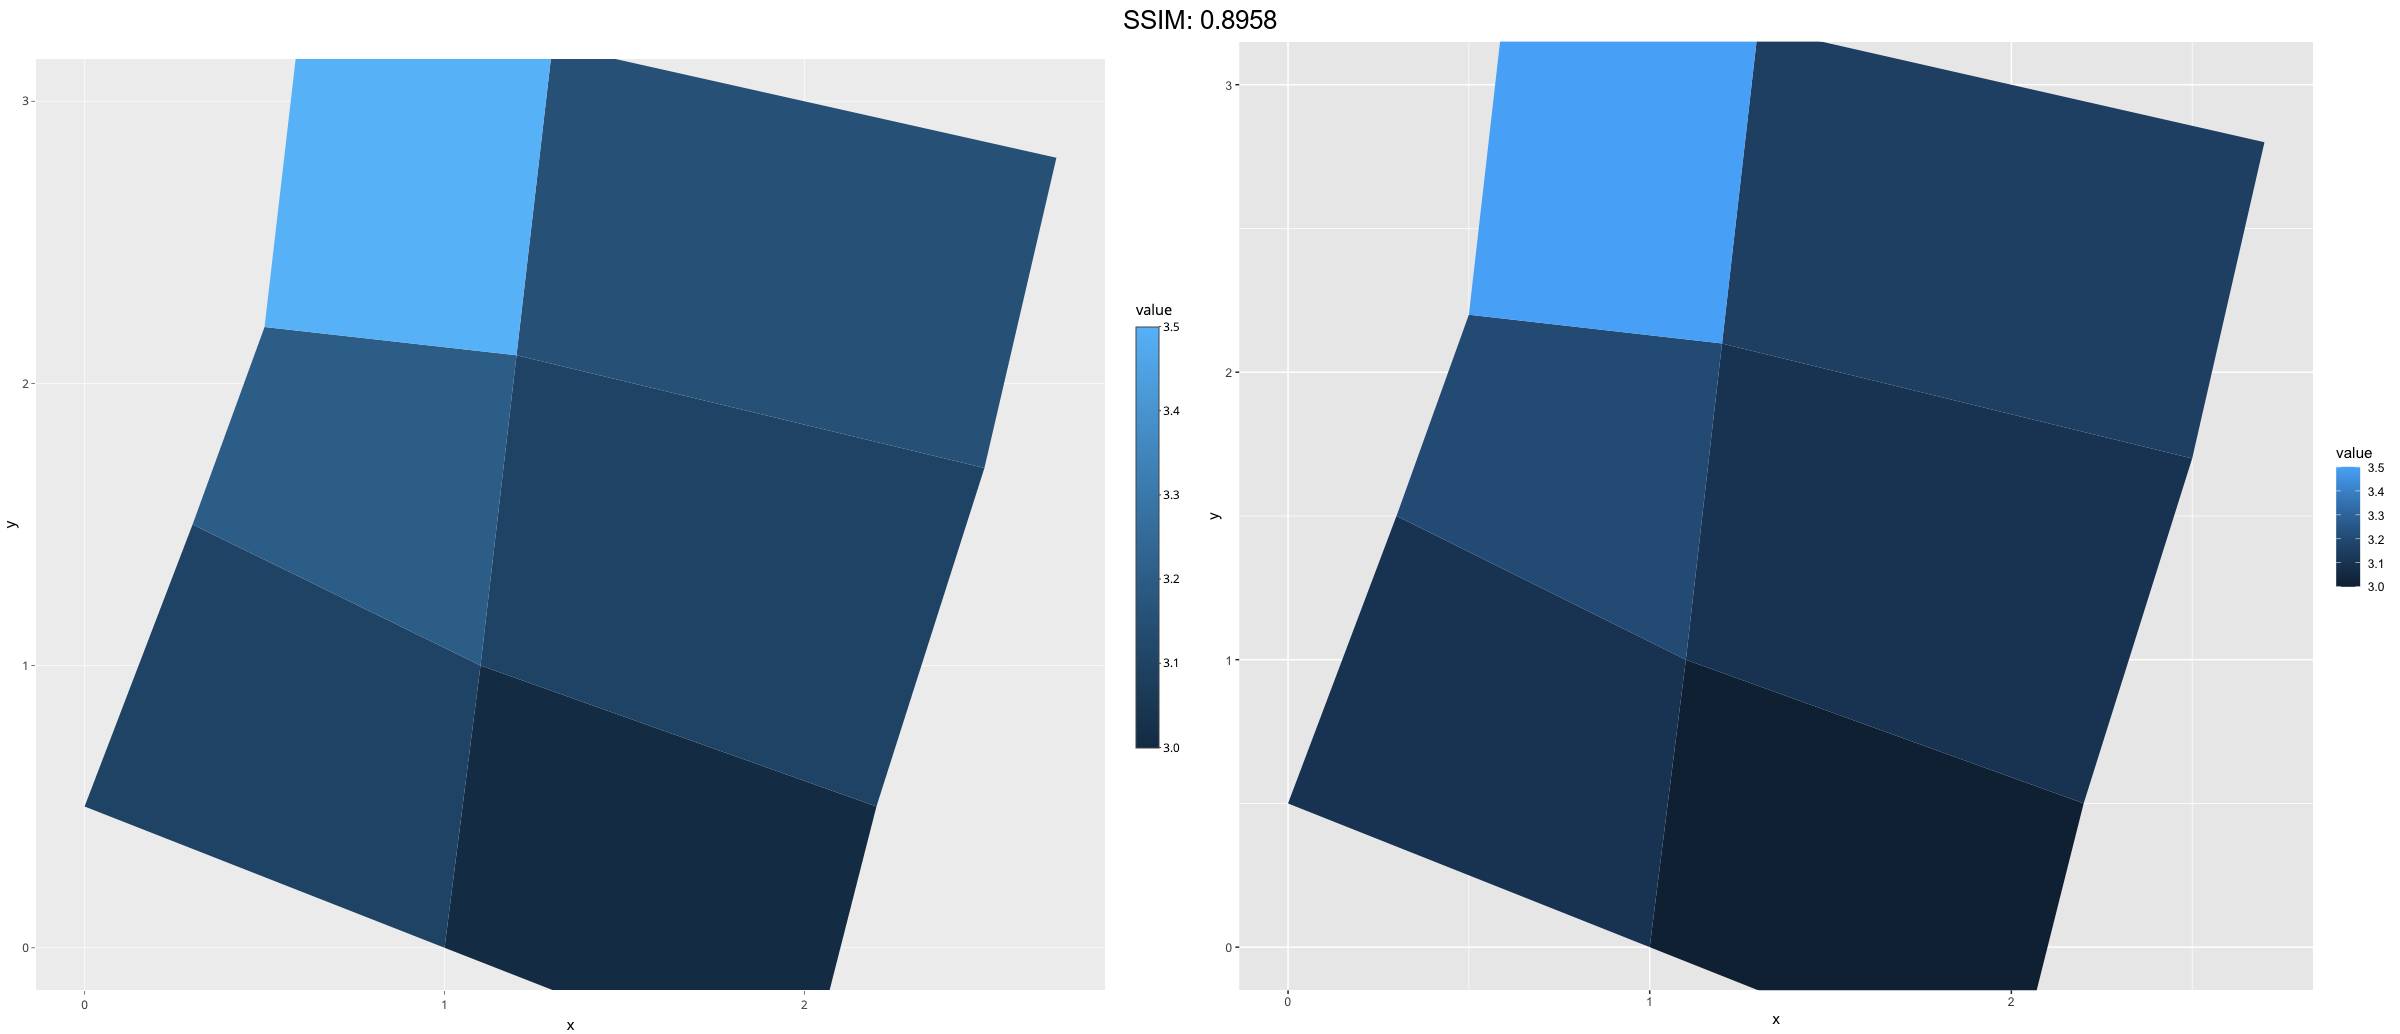
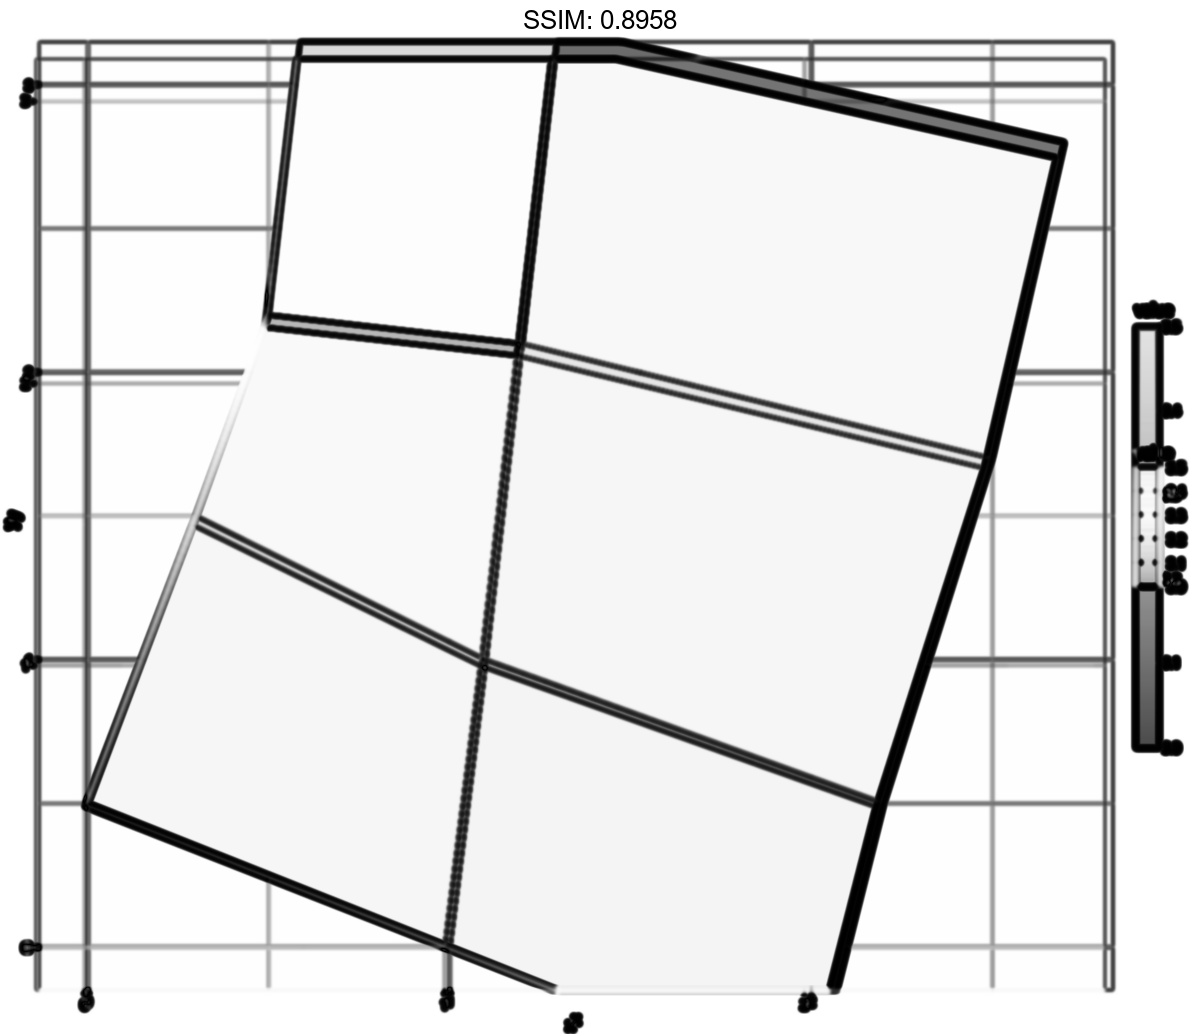
p <-
ggplot(values, aes(fill = value)) +
geom_map(aes(map_id = id), map = positions) +
expand_limits(positions) + ylim(0, 3)
plotly::ggplotly(p)
ids <- factor(c("1.1", "2.1", "1.2", "2.2", "1.3", "2.3"))
values <- data.frame(
id = ids,
value = c(3, 3.1, 3.1, 3.2, 3.15, 3.5)
)
positions <- data.frame(
id = rep(ids, each = 4),
x = c(2, 1, 1.1, 2.2, 1, 0, 0.3, 1.1, 2.2, 1.1, 1.2, 2.5, 1.1, 0.3,
0.5, 1.2, 2.5, 1.2, 1.3, 2.7, 1.2, 0.5, 0.6, 1.3),
y = c(-0.5, 0, 1, 0.5, 0, 0.5, 1.5, 1, 0.5, 1, 2.1, 1.7, 1, 1.5,
2.2, 2.1, 1.7, 2.1, 3.2, 2.8, 2.1, 2.2, 3.3, 3.2)
)
p <-
if (require(maps)) {
crimes <- data.frame(state = tolower(rownames(USArrests)), USArrests)
# Equivalent to crimes %>% tidyr::pivot_longer(Murder:Rape)
vars <- lapply(names(crimes)[-1], function(j) {
data.frame(state = crimes$state, variable = j, value = crimes[[j]])
})
crimes_long <- do.call("rbind", vars)
states_map <- map_data("state")
ggplot(crimes, aes(map_id = state)) +
geom_map(aes(fill = Murder), map = states_map) +
expand_limits(x = states_map$long, y = states_map$lat)
last_plot() + coord_map()
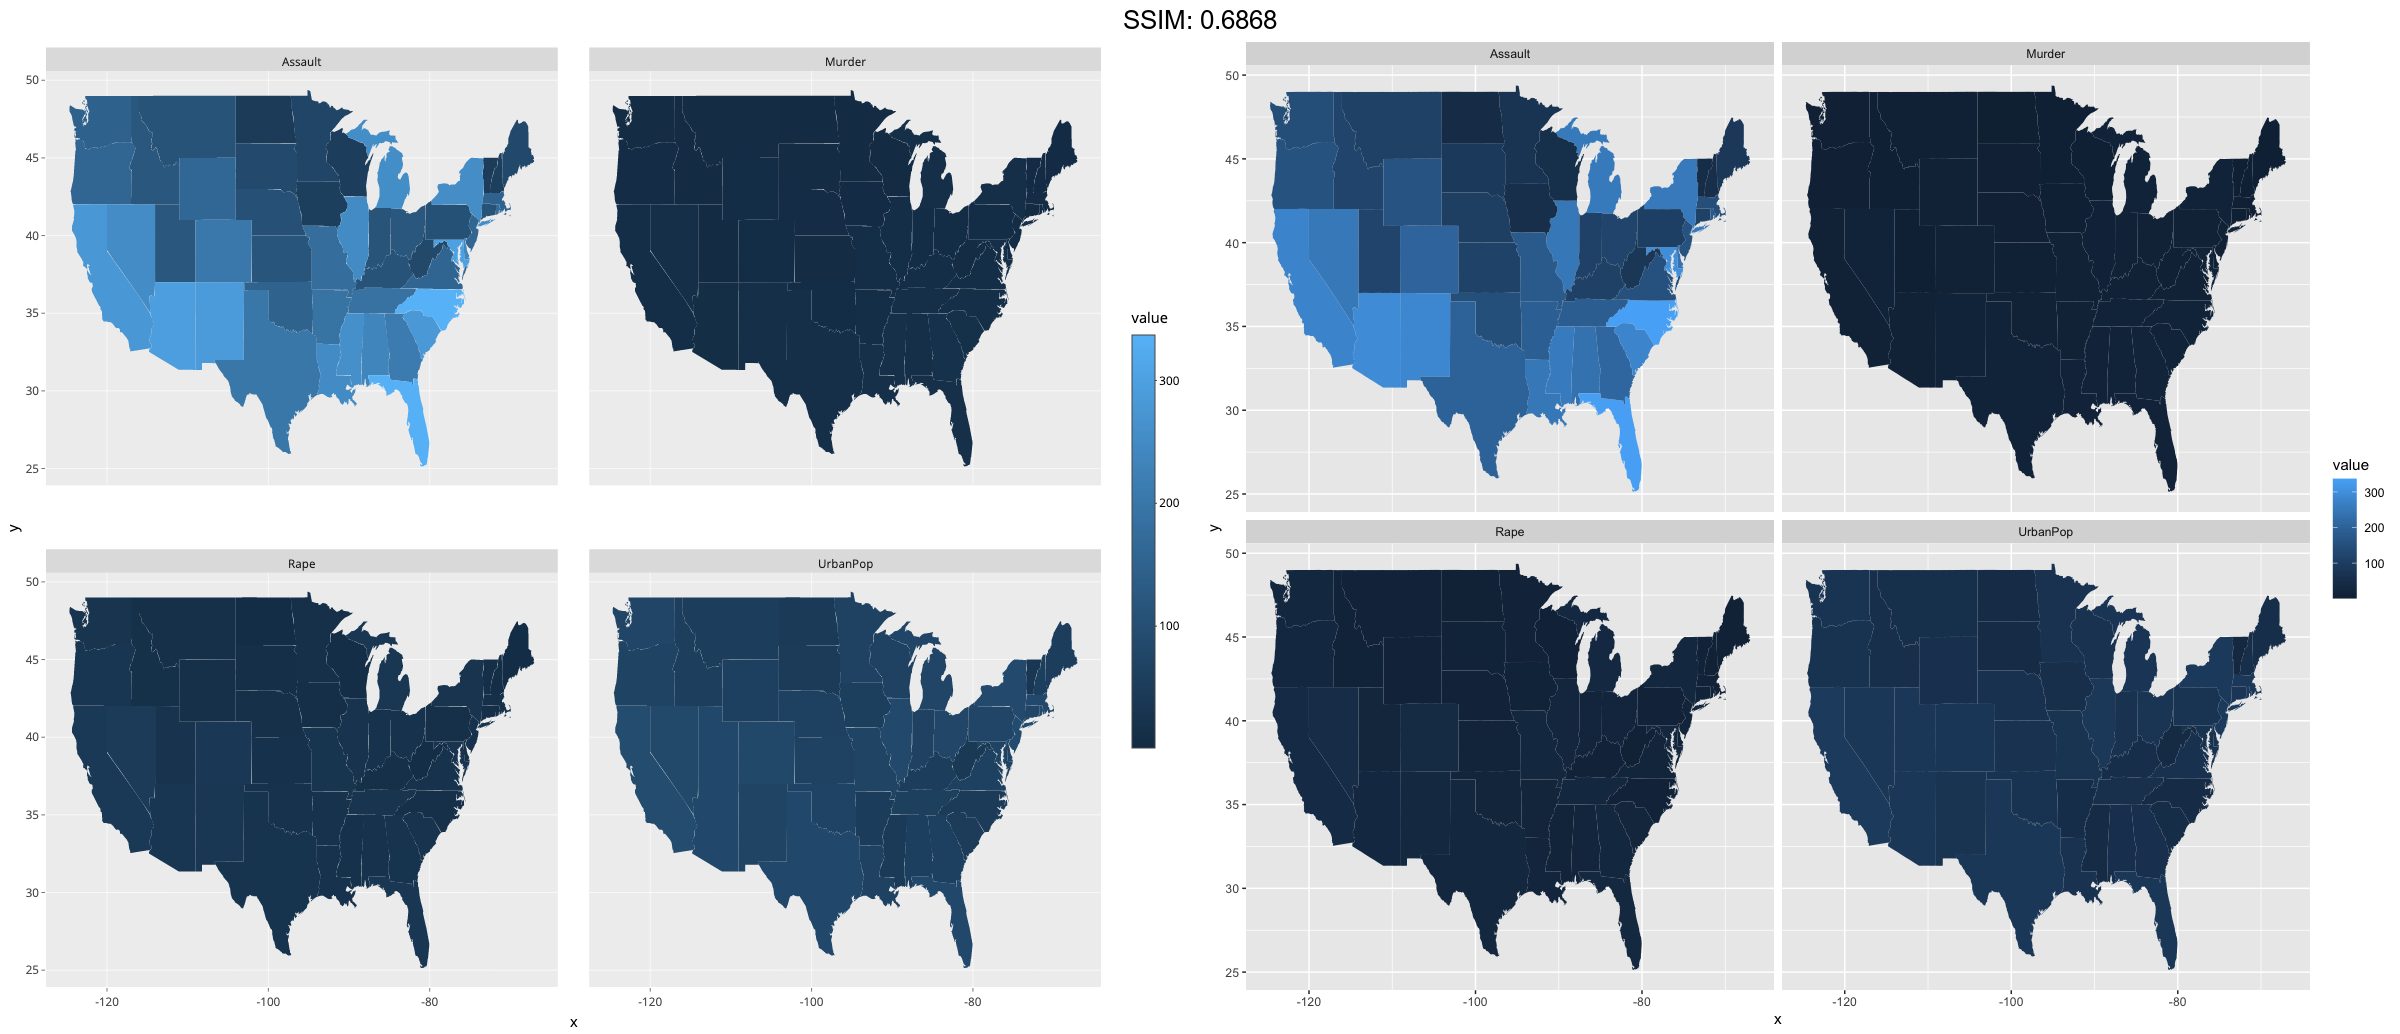
ggplot(crimes_long, aes(map_id = state)) +
geom_map(aes(fill = value), map = states_map) +
expand_limits(x = states_map$long, y = states_map$lat) +
facet_wrap( ~ variable)
}
plotly::ggplotly(p)