GGPLOT - geom_function
Computes and draws a function as a continuous curve and then convert them with ggplotly.
set.seed(1492)
p <-
 ggplot(data.frame(x = rnorm(100)), aes(x)) +
  geom_density() +
  geom_function(fun = dnorm, colour = "red")
plotly::ggplotly(p)
## Warning in geom2trace.default(dots[[1L]][[1L]], dots[[2L]][[1L]], dots[[3L]][[1L]]): geom_GeomFunction() has yet to be implemented in plotly.
##   If you'd like to see this geom implemented,
##   Please open an issue with your example code at
##   https://github.com/ropensci/plotly/issues


set.seed(1492)
base <-
  ggplot() +
  xlim(-5, 5)
p <-  base + geom_function(fun = dnorm)
plotly::ggplotly(p)
## Warning in geom2trace.default(dots[[1L]][[1L]], dots[[2L]][[1L]], dots[[3L]][[1L]]): geom_GeomFunction() has yet to be implemented in plotly.
##   If you'd like to see this geom implemented,
##   Please open an issue with your example code at
##   https://github.com/ropensci/plotly/issues


set.seed(1492)
base <-
  ggplot() +
  xlim(-5, 5)
p <-  base + geom_function(fun = dnorm, args = list(mean = 2, sd = .5))
plotly::ggplotly(p)
## Warning in geom2trace.default(dots[[1L]][[1L]], dots[[2L]][[1L]], dots[[3L]][[1L]]): geom_GeomFunction() has yet to be implemented in plotly.
##   If you'd like to see this geom implemented,
##   Please open an issue with your example code at
##   https://github.com/ropensci/plotly/issues


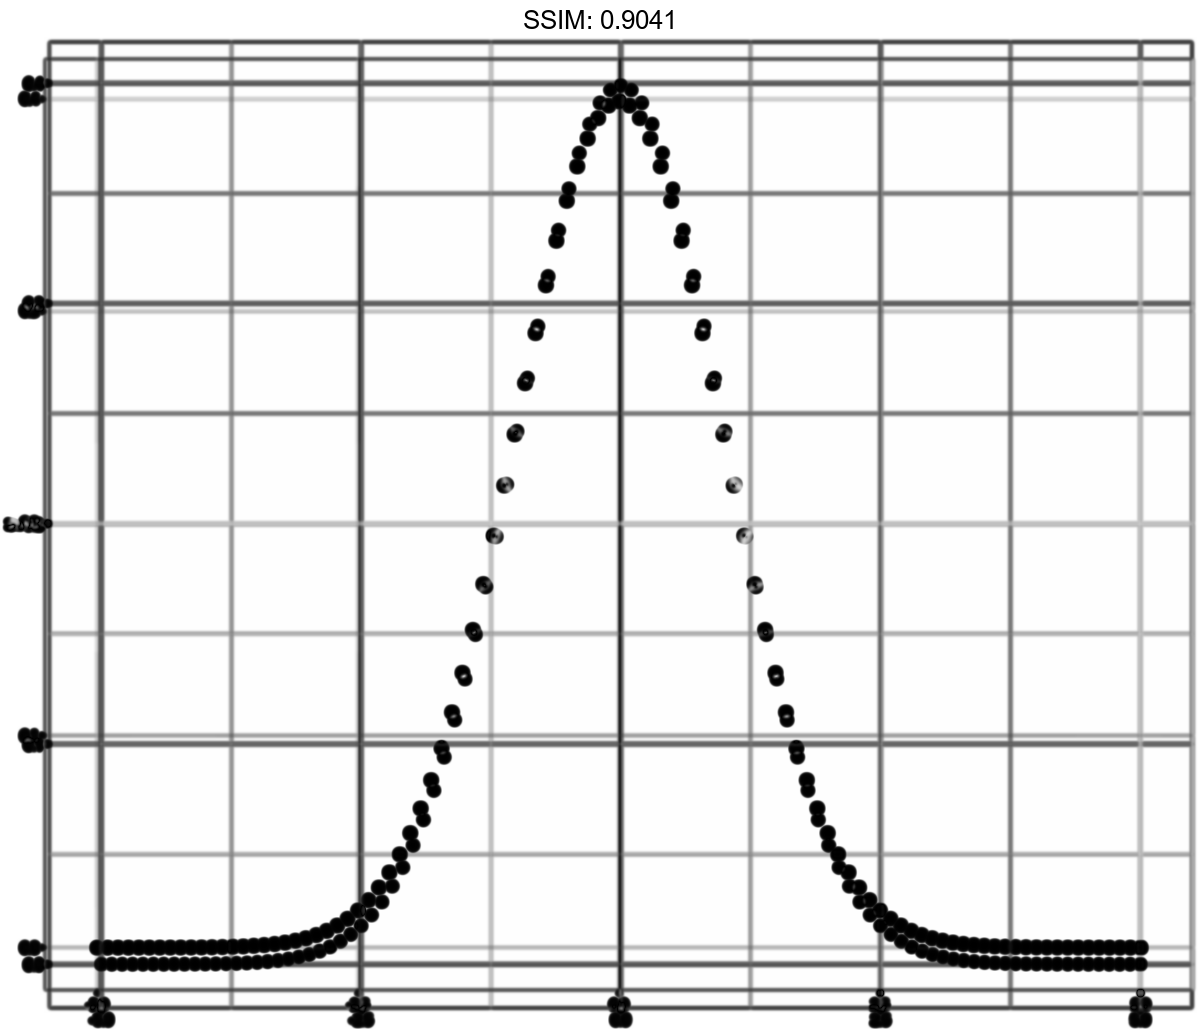
set.seed(1492)
base <-
  ggplot() +
  xlim(-5, 5)
p <-  base + stat_function(fun = dnorm, geom = "point")
plotly::ggplotly(p)

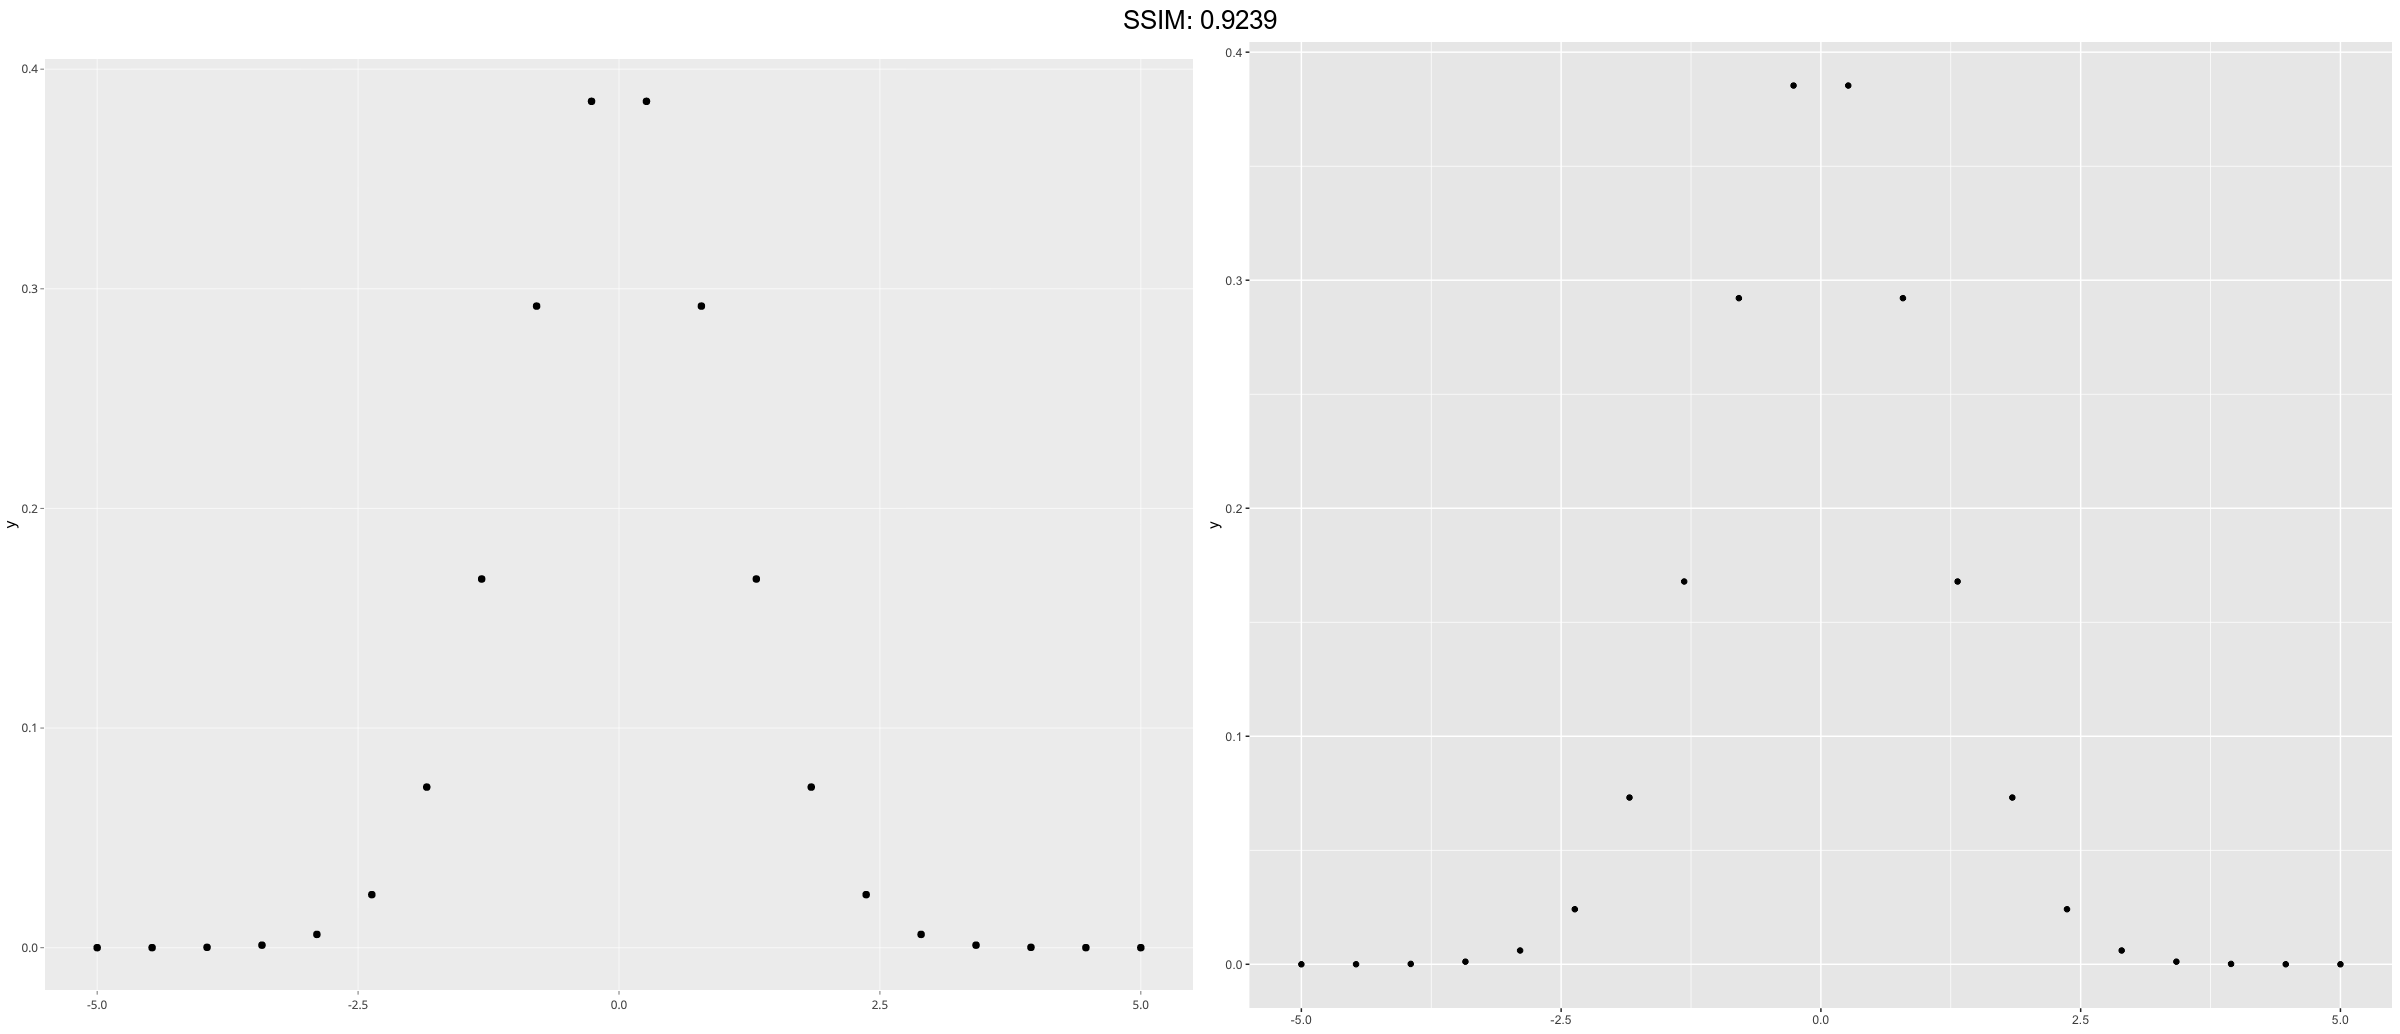
set.seed(1492)
base <-
  ggplot() +
  xlim(-5, 5)
p <-  base + stat_function(fun = dnorm, geom = "point", n = 20)
plotly::ggplotly(p)
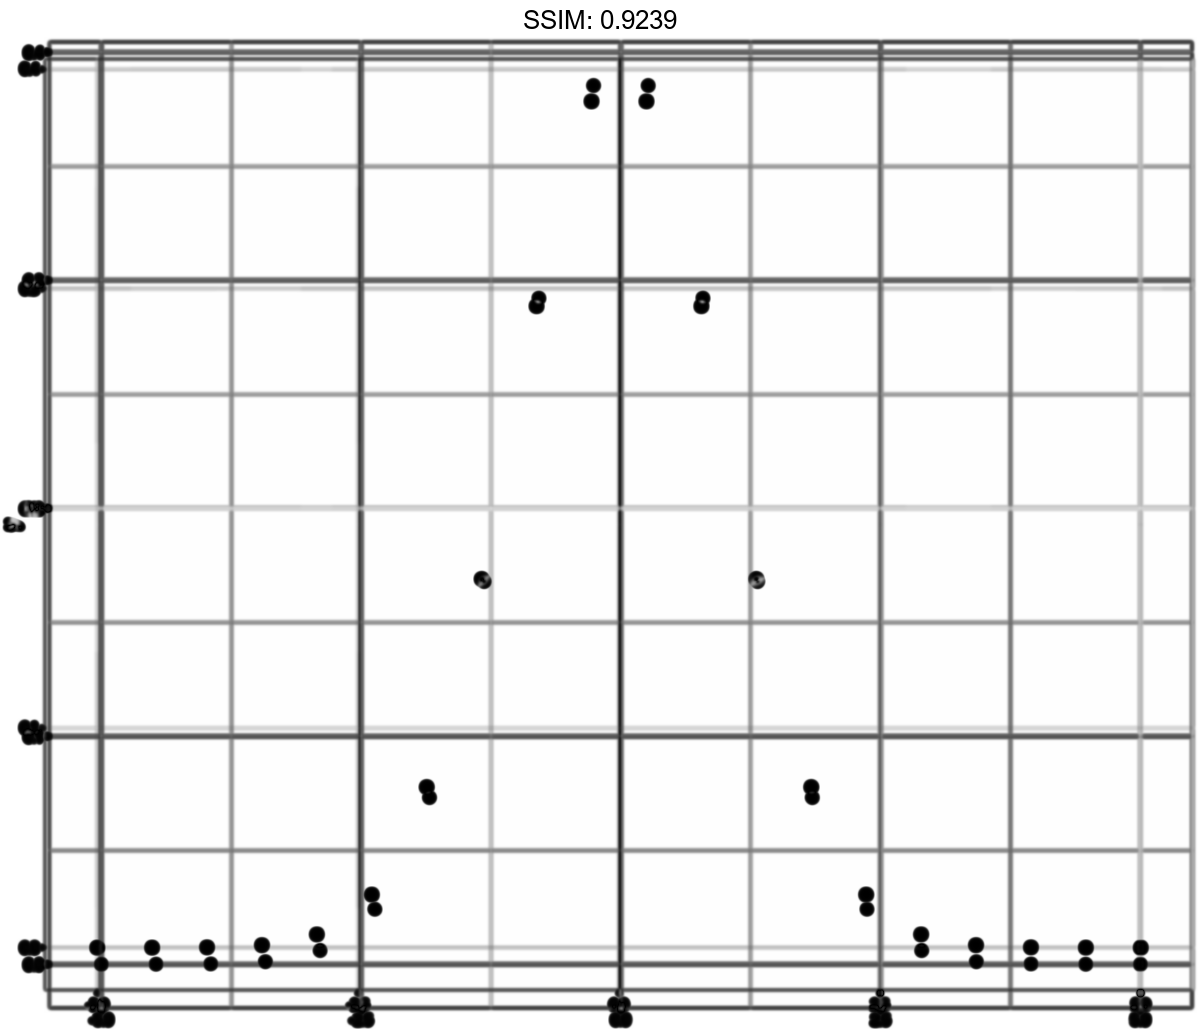
set.seed(1492)
base <-
  ggplot() +
  xlim(-5, 5)
p <-  base + geom_function(fun = dnorm, n = 20)
plotly::ggplotly(p)
## Warning in geom2trace.default(dots[[1L]][[1L]], dots[[2L]][[1L]], dots[[3L]][[1L]]): geom_GeomFunction() has yet to be implemented in plotly.
##   If you'd like to see this geom implemented,
##   Please open an issue with your example code at
##   https://github.com/ropensci/plotly/issues


set.seed(1492)
base <-
  ggplot() +
  xlim(-5, 5)
p <-
 base +
  geom_function(aes(colour = "normal"), fun = dnorm) +
  geom_function(aes(colour = "t, df = 1"), fun = dt, args = list(df = 1))
plotly::ggplotly(p)
## Warning in geom2trace.default(dots[[1L]][[1L]], dots[[2L]][[1L]], dots[[3L]][[1L]]): geom_GeomFunction() has yet to be implemented in plotly.
##   If you'd like to see this geom implemented,
##   Please open an issue with your example code at
##   https://github.com/ropensci/plotly/issues

## Warning in geom2trace.default(dots[[1L]][[1L]], dots[[2L]][[1L]], dots[[3L]][[1L]]): geom_GeomFunction() has yet to be implemented in plotly.
##   If you'd like to see this geom implemented,
##   Please open an issue with your example code at
##   https://github.com/ropensci/plotly/issues


set.seed(1492)
base <-
  ggplot() +
  xlim(-5, 5)
p <-  base + geom_function(fun = function(x) 0.5*exp(-abs(x)))
plotly::ggplotly(p)
## Warning in geom2trace.default(dots[[1L]][[1L]], dots[[2L]][[1L]], dots[[3L]][[1L]]): geom_GeomFunction() has yet to be implemented in plotly.
##   If you'd like to see this geom implemented,
##   Please open an issue with your example code at
##   https://github.com/ropensci/plotly/issues


set.seed(1492)
base <-
  ggplot() +
  xlim(-5, 5)
p <-  base + geom_function(fun = ~ 0.5*exp(-abs(.x)))
plotly::ggplotly(p)
## Warning in geom2trace.default(dots[[1L]][[1L]], dots[[2L]][[1L]], dots[[3L]][[1L]]): geom_GeomFunction() has yet to be implemented in plotly.
##   If you'd like to see this geom implemented,
##   Please open an issue with your example code at
##   https://github.com/ropensci/plotly/issues


set.seed(1492)
f <- function(x) 0.5*exp(-abs(x))
p <-  base + geom_function(fun = f)
plotly::ggplotly(p)
## Warning in geom2trace.default(dots[[1L]][[1L]], dots[[2L]][[1L]], dots[[3L]][[1L]]): geom_GeomFunction() has yet to be implemented in plotly.
##   If you'd like to see this geom implemented,
##   Please open an issue with your example code at
##   https://github.com/ropensci/plotly/issues

