GGPLOT - geom_dotplot
Creates dotplot and then convert them with ggplotly.
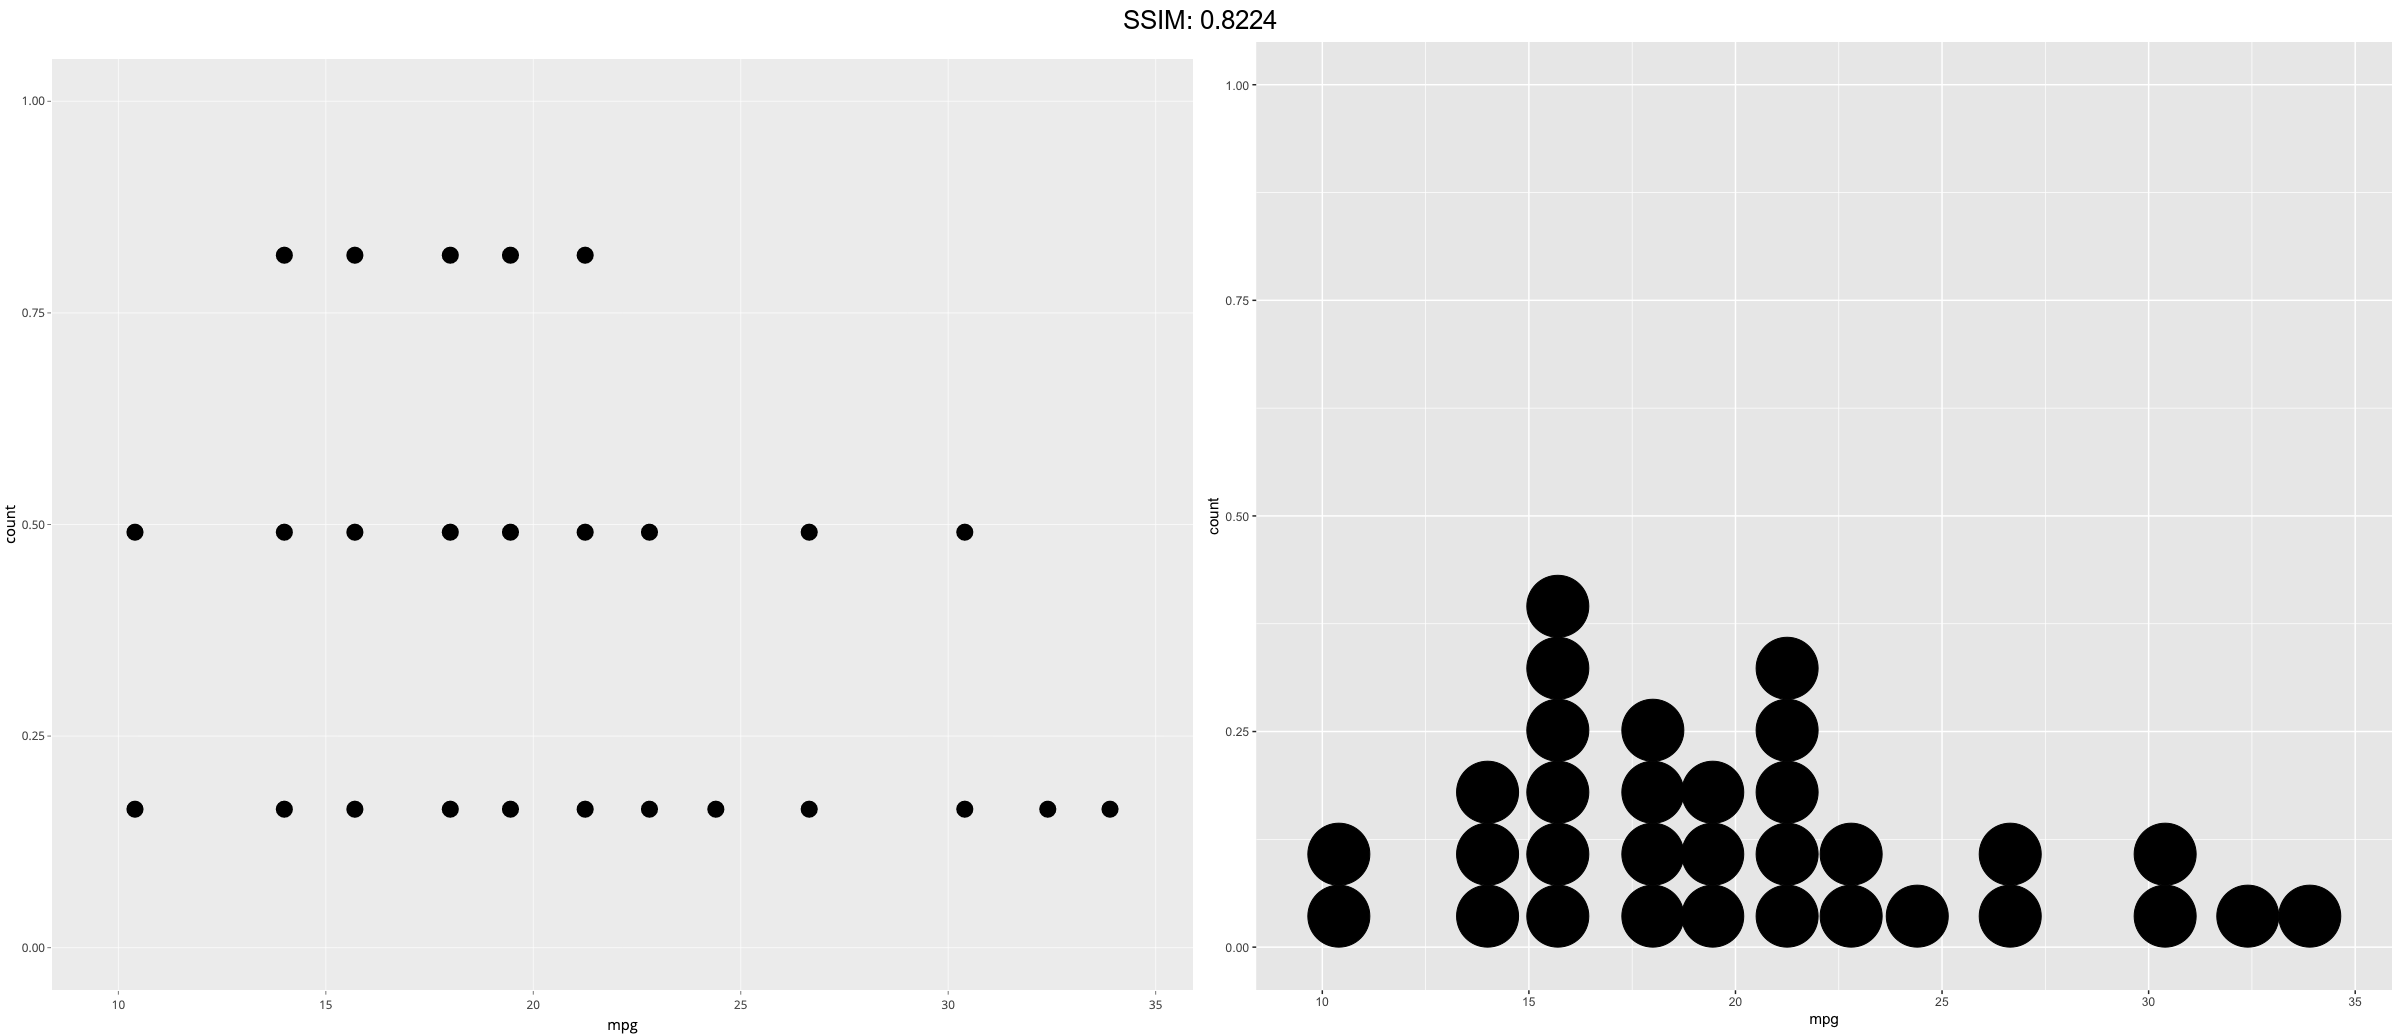
p <-
 ggplot(mtcars, aes(x = mpg)) +
  geom_dotplot()
plotly::ggplotly(p)
## Bin width defaults to 1/30 of the range of the data. Pick better value with `binwidth`.


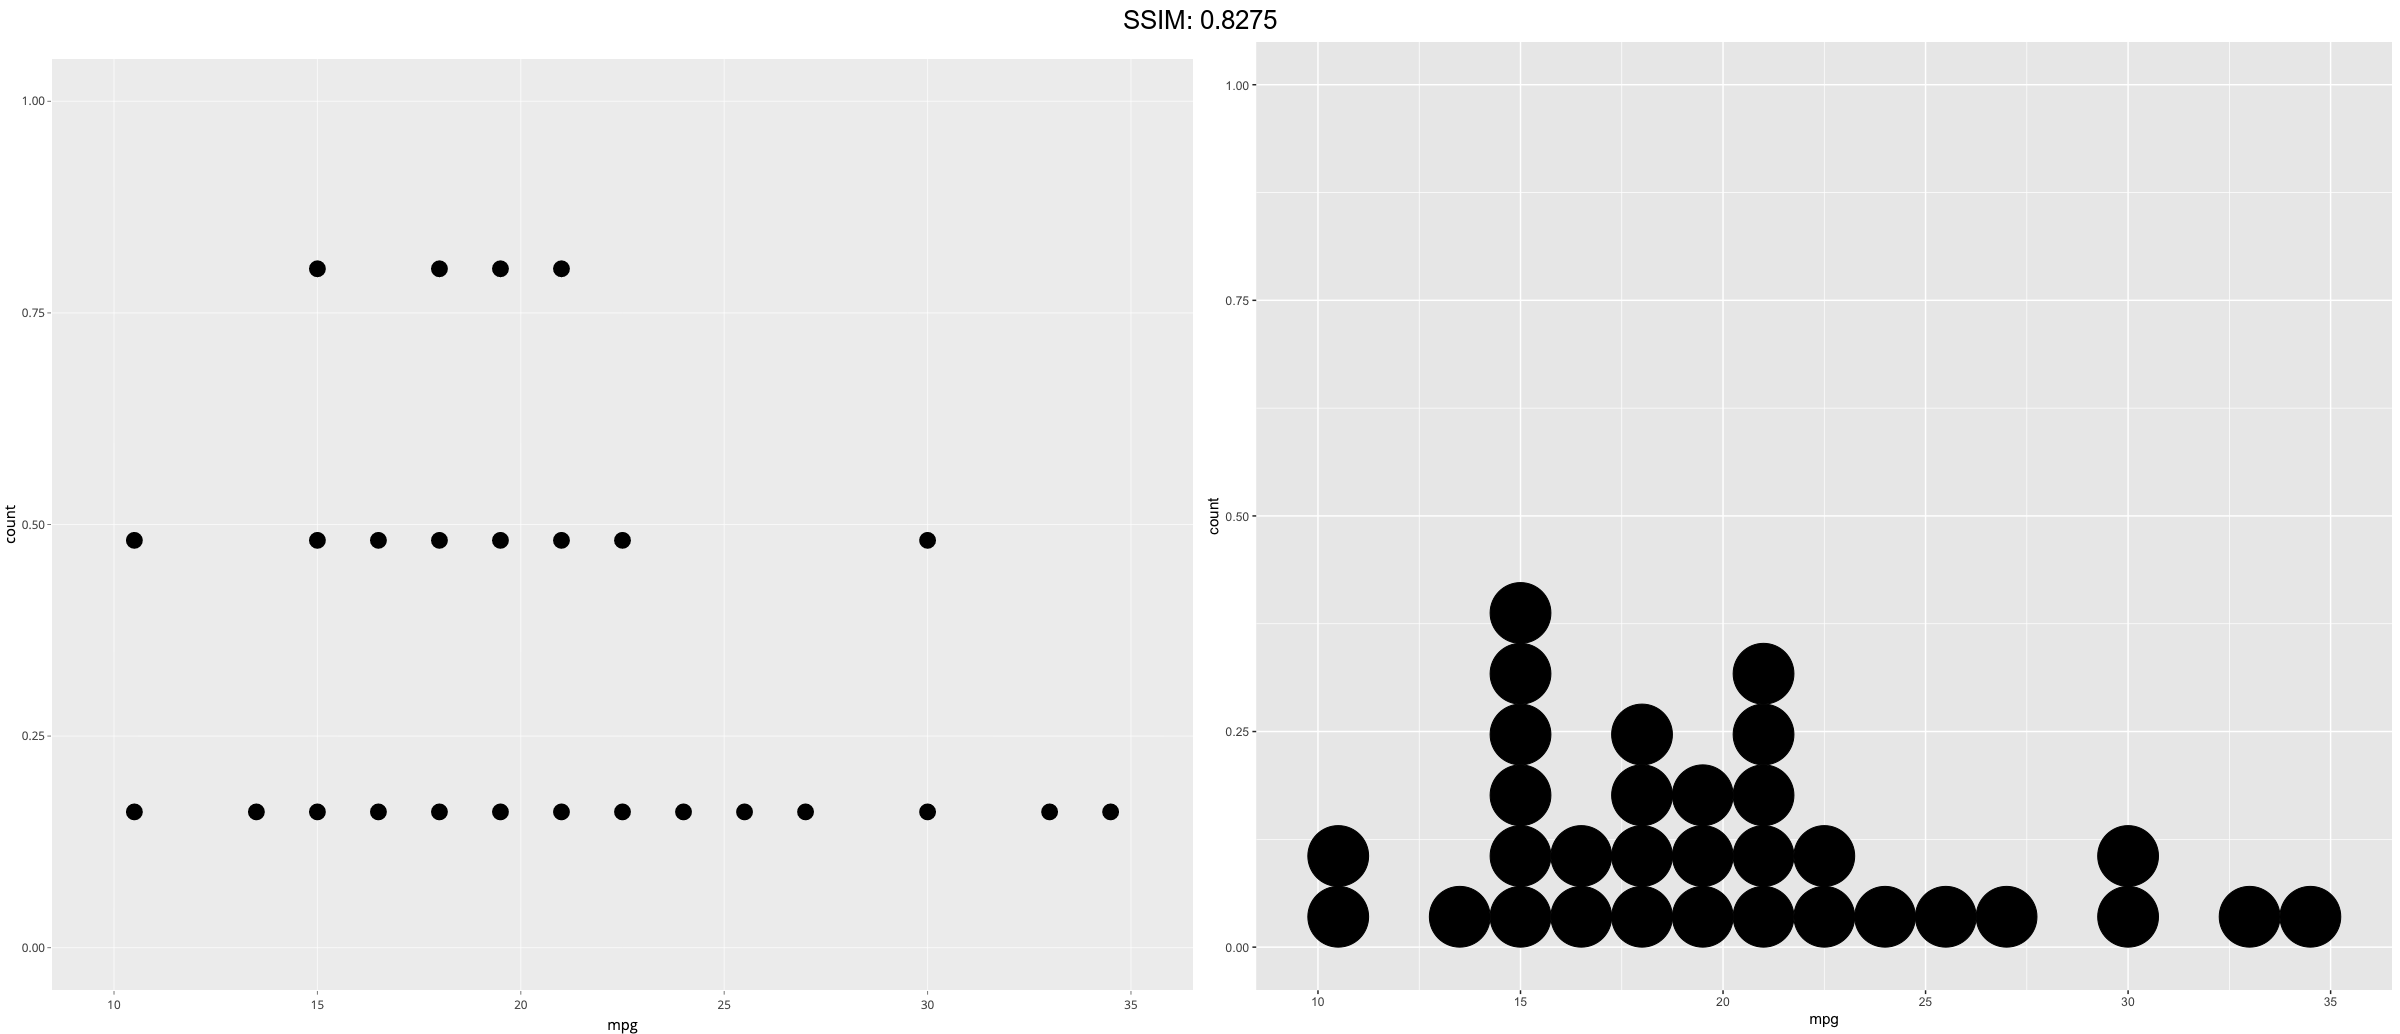
p <-
 ggplot(mtcars, aes(x = mpg)) +
  geom_dotplot(binwidth = 1.5)
plotly::ggplotly(p)

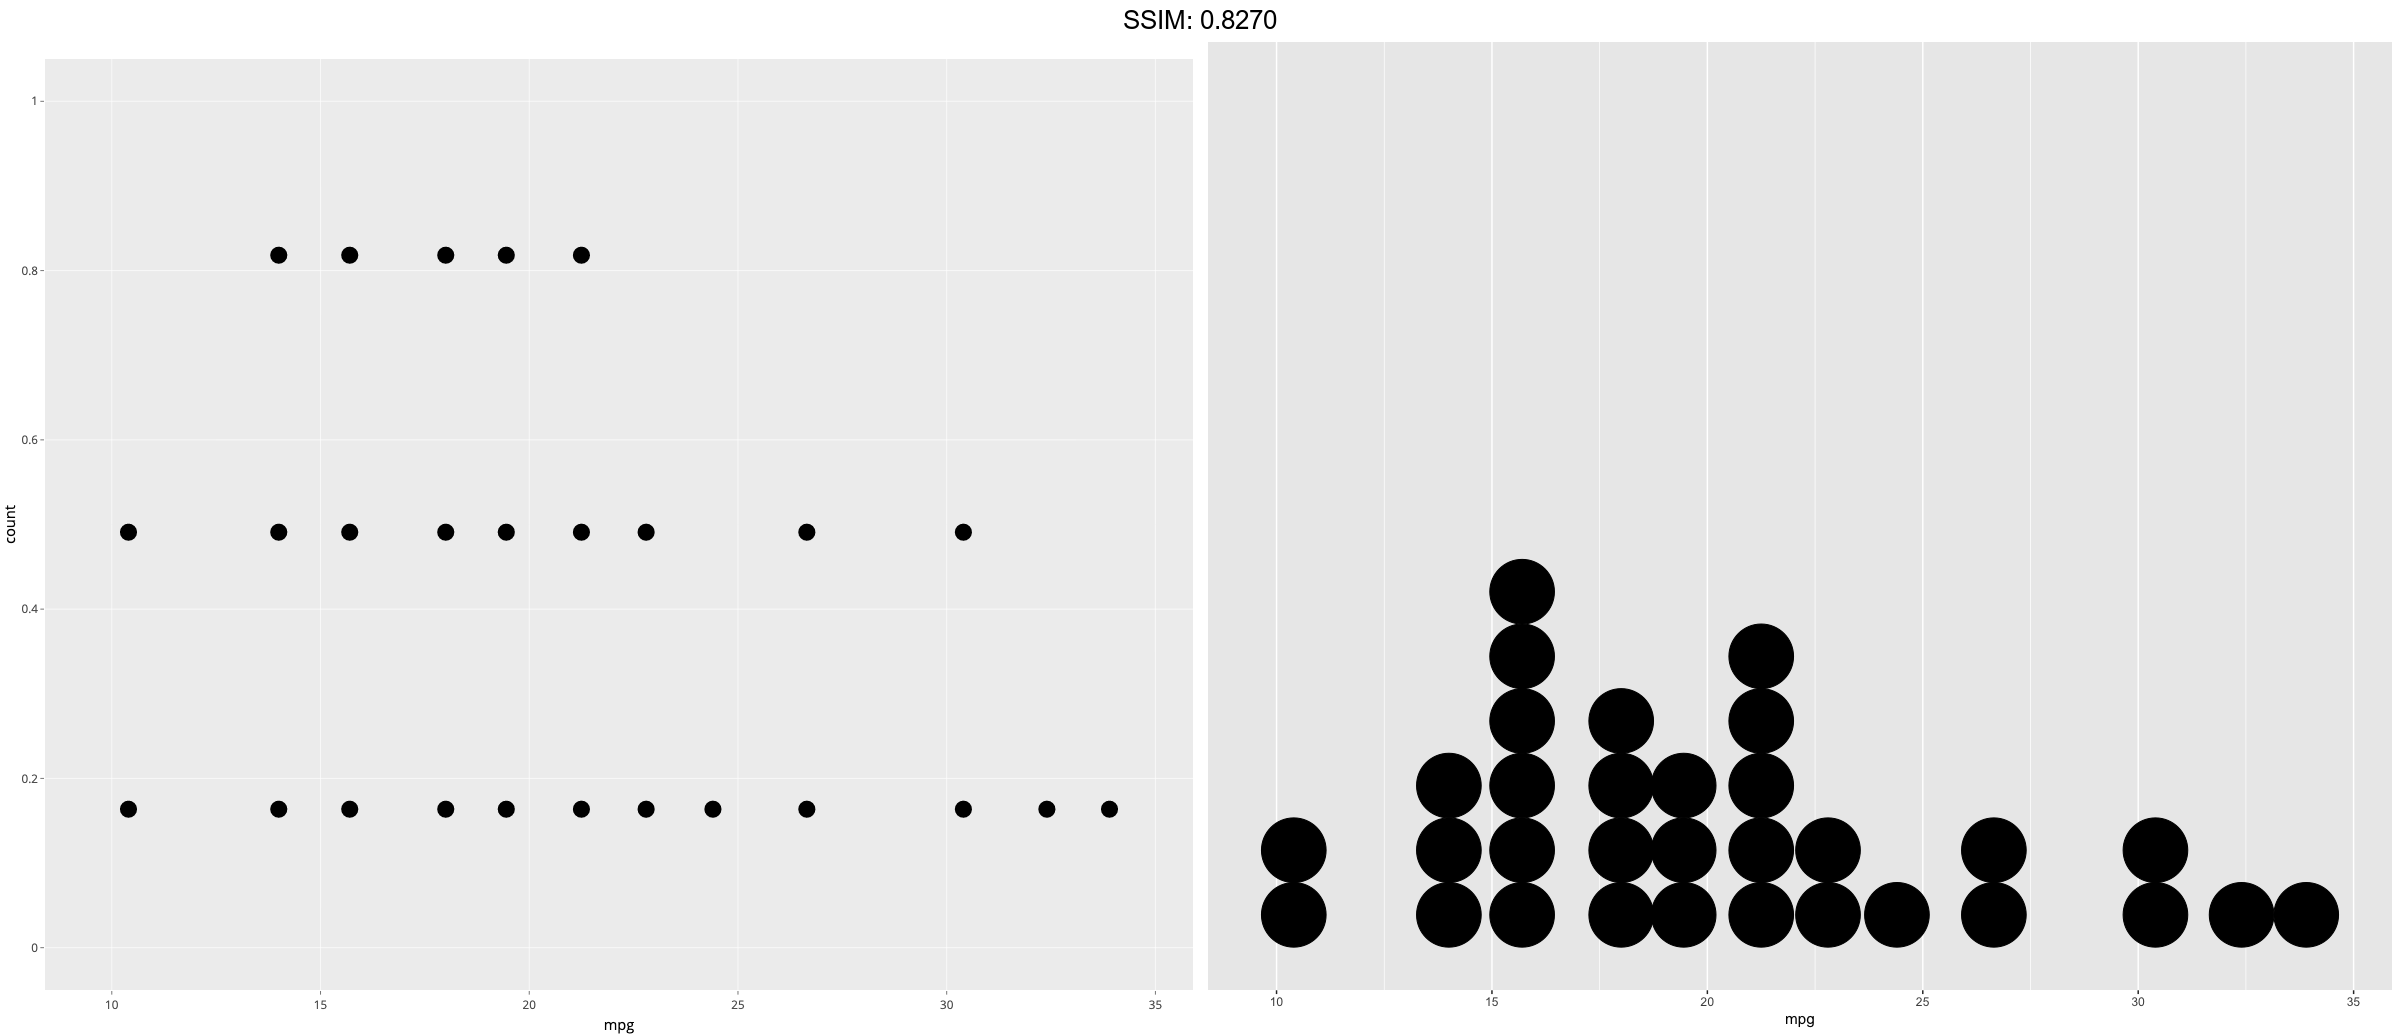
p <-
 ggplot(mtcars, aes(x = mpg)) +
  geom_dotplot(method="histodot", binwidth = 1.5)
plotly::ggplotly(p)

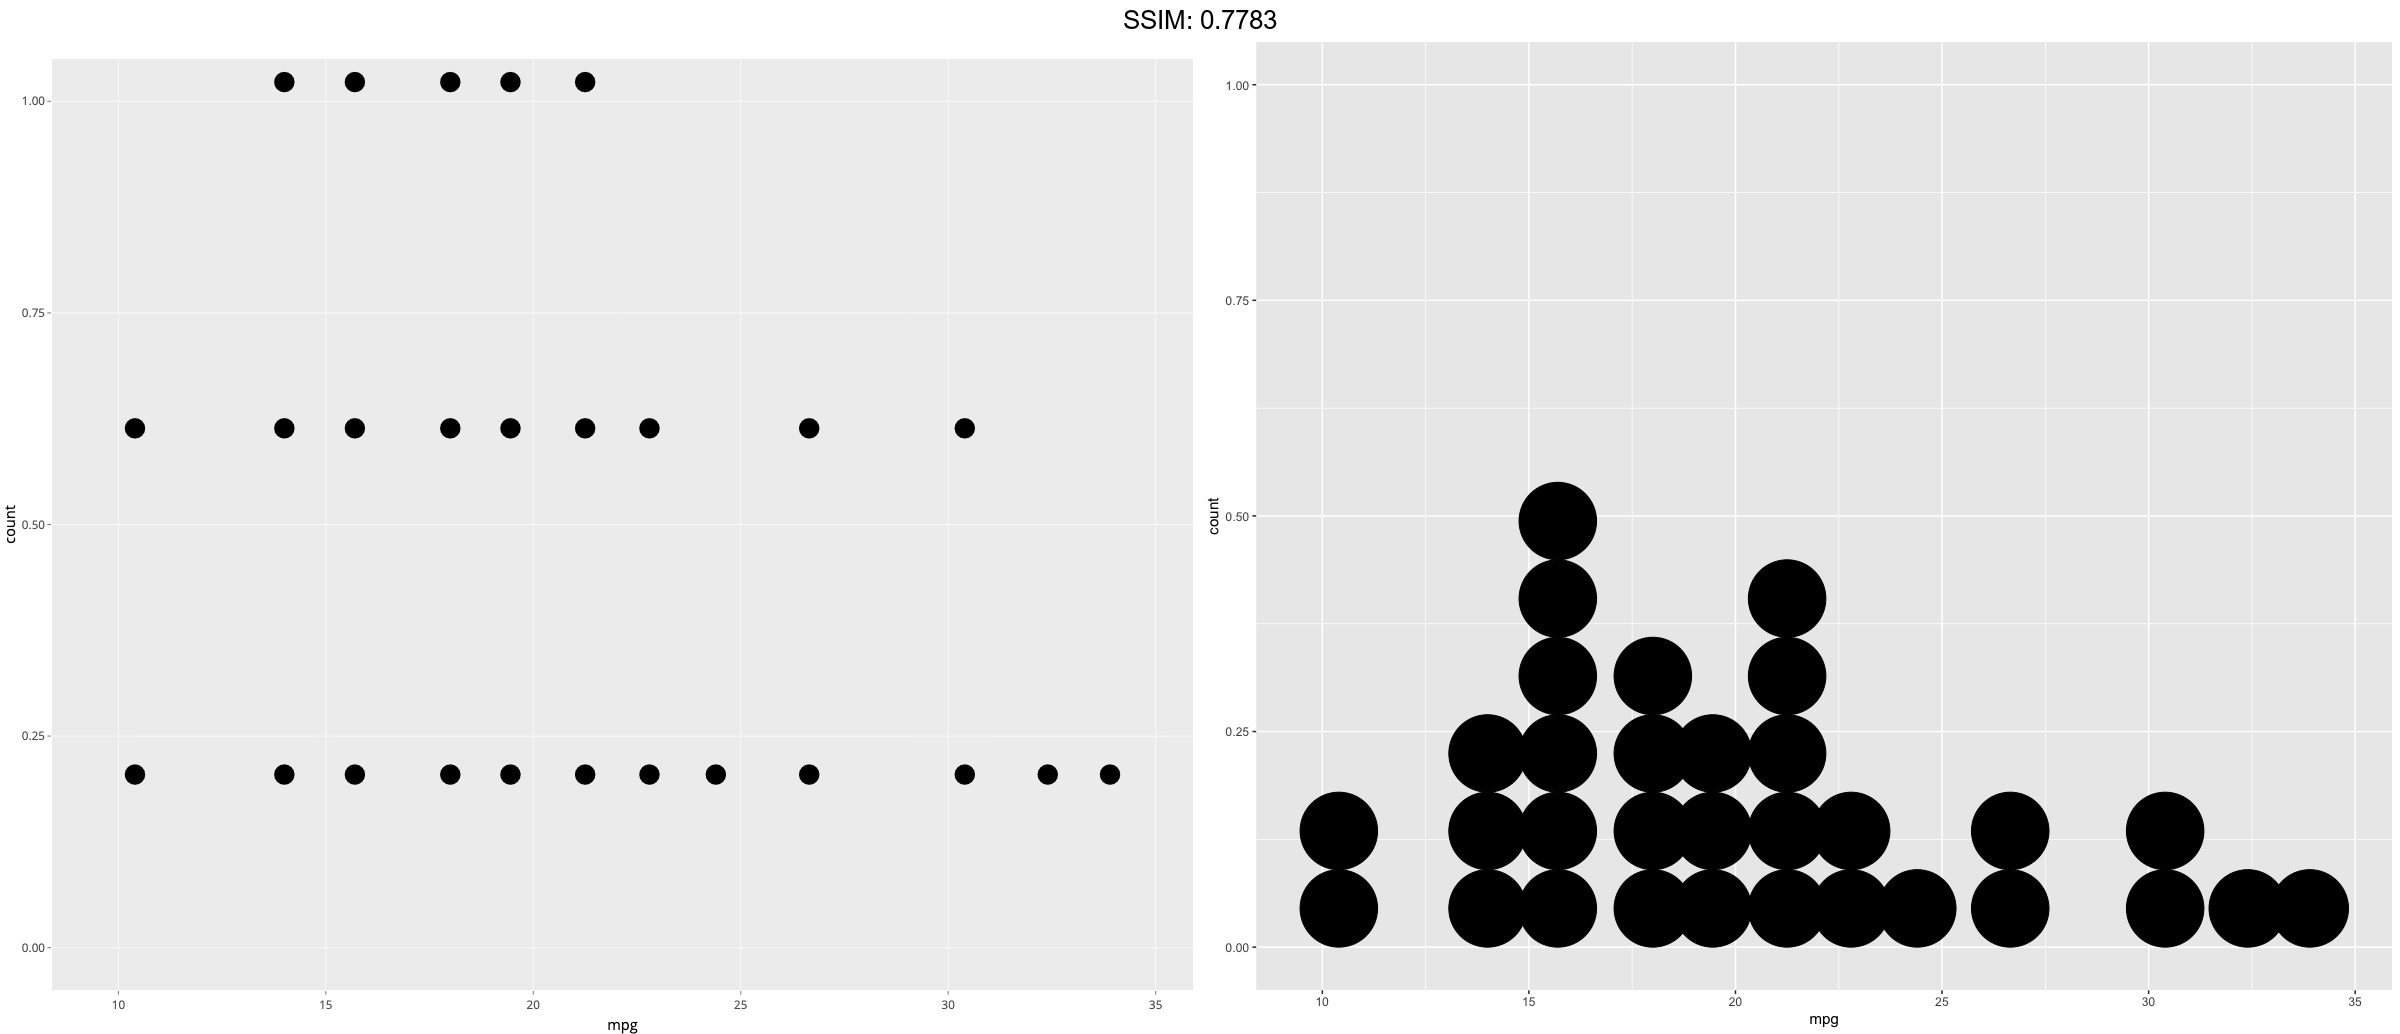
p <-
 ggplot(mtcars, aes(x = mpg)) +
  geom_dotplot(binwidth = 1.5, stackdir = "center")
plotly::ggplotly(p)


p <-
 ggplot(mtcars, aes(x = mpg)) +
  geom_dotplot(binwidth = 1.5, stackdir = "centerwhole")
plotly::ggplotly(p)


p <-
 ggplot(mtcars, aes(x = mpg)) + geom_dotplot(binwidth = 1.5) +
  scale_y_continuous(NULL, breaks = NULL)
plotly::ggplotly(p)

p <-
 ggplot(mtcars, aes(x = mpg)) +
  geom_dotplot(binwidth = 1.5, stackratio = .7)
plotly::ggplotly(p)


p <-
 ggplot(mtcars, aes(x = mpg)) +
  geom_dotplot(binwidth = 1.5, dotsize = 1.25)
plotly::ggplotly(p)

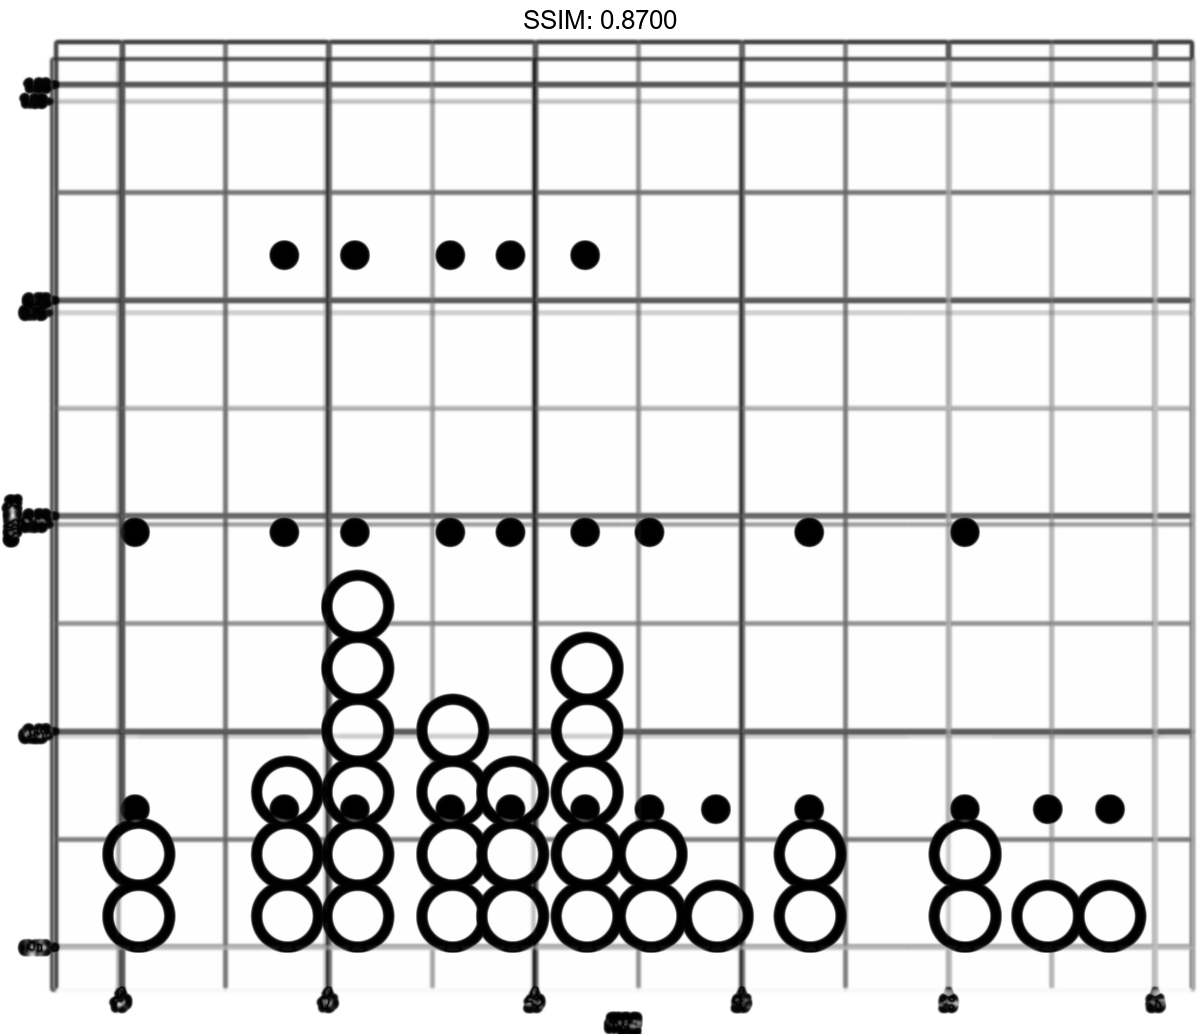
p <-
 ggplot(mtcars, aes(x = mpg)) +
  geom_dotplot(binwidth = 1.5, fill = "white", stroke = 2)
plotly::ggplotly(p)

p <-
 ggplot(mtcars, aes(x = 1, y = mpg)) +
  geom_dotplot(binaxis = "y", stackdir = "center")
plotly::ggplotly(p)
## Bin width defaults to 1/30 of the range of the data. Pick better value with `binwidth`.


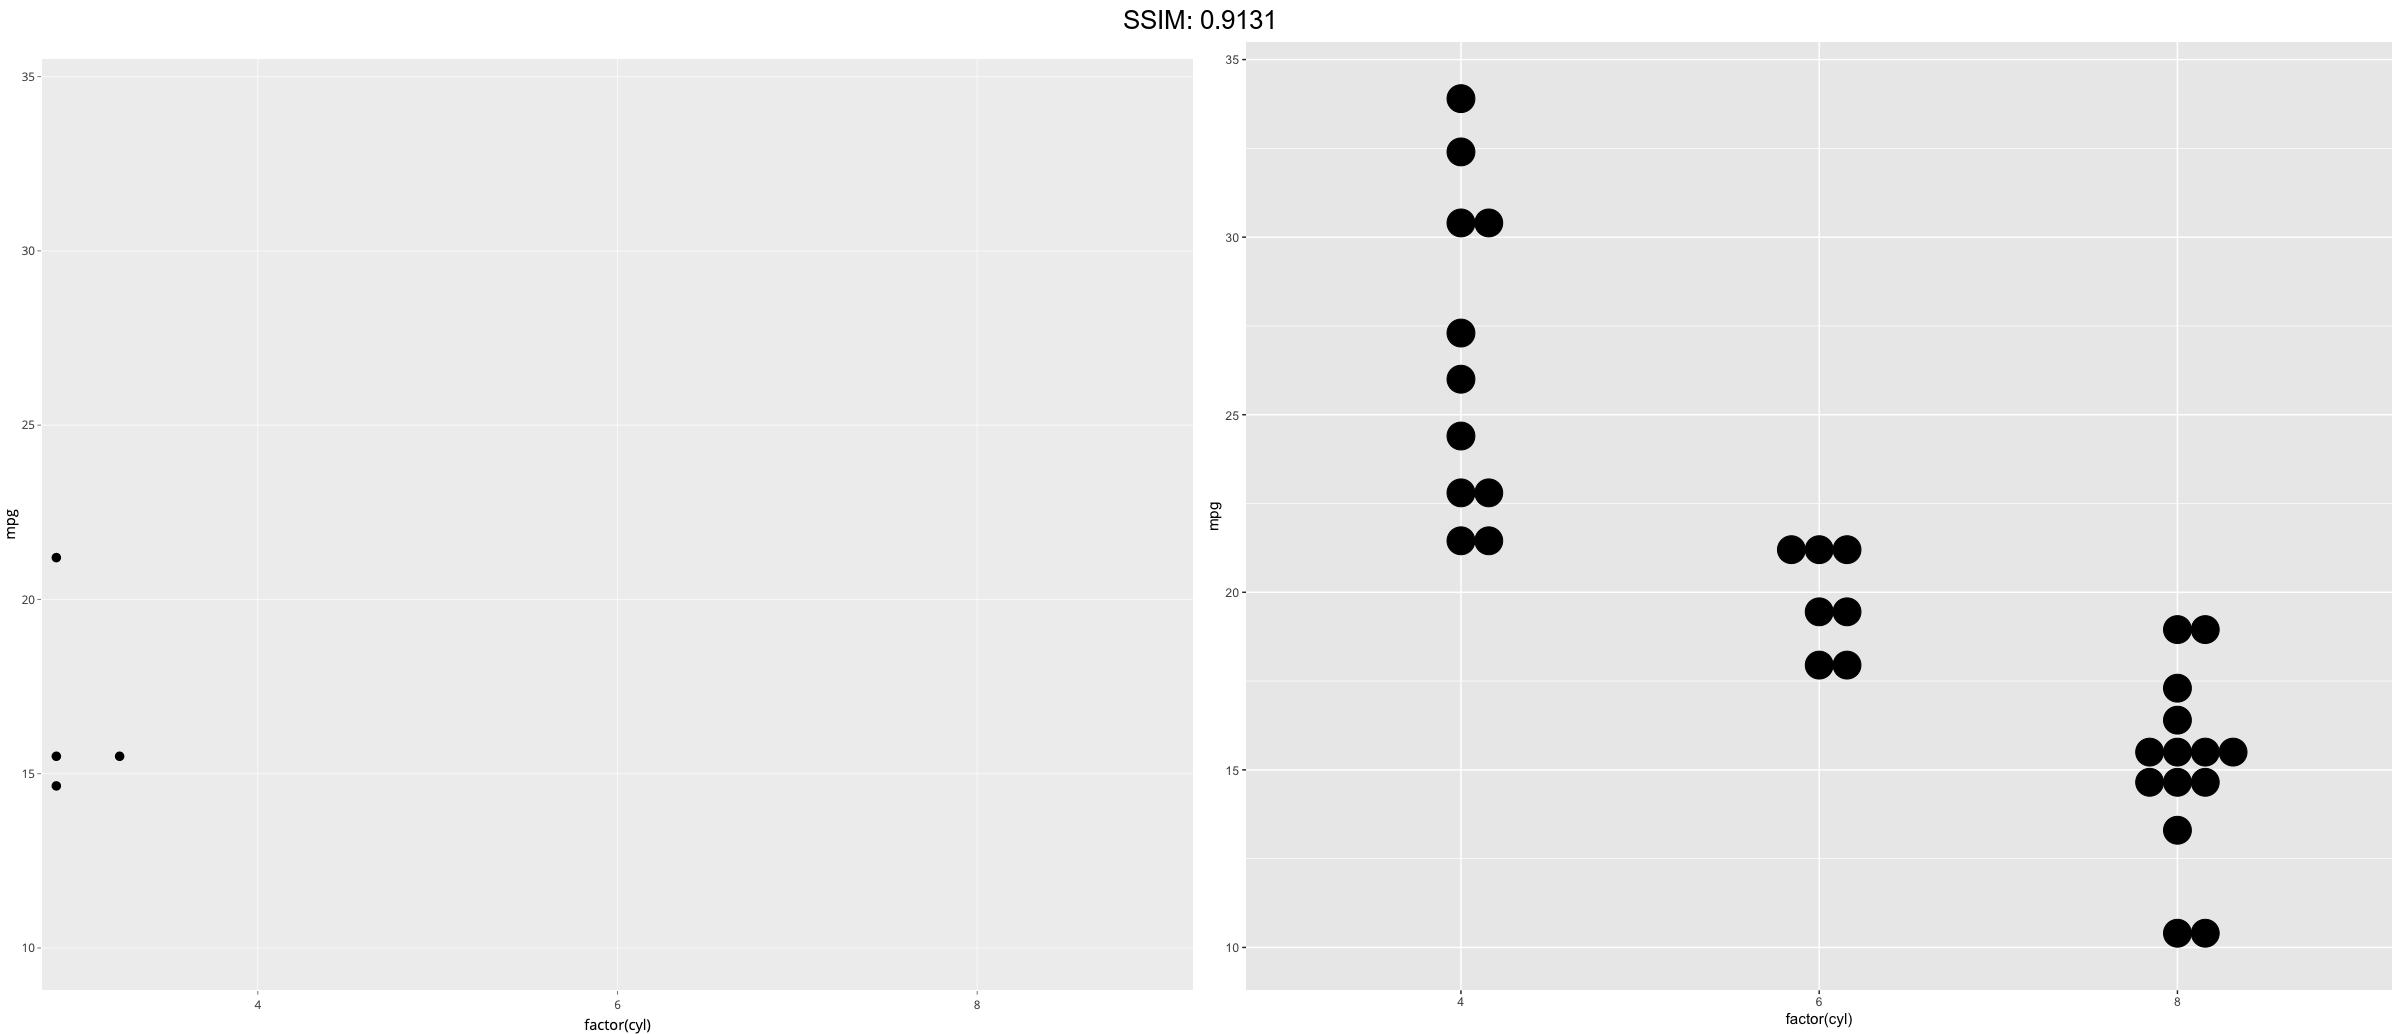
p <-
 ggplot(mtcars, aes(x = factor(cyl), y = mpg)) +
  geom_dotplot(binaxis = "y", stackdir = "center")
plotly::ggplotly(p)
## Bin width defaults to 1/30 of the range of the data. Pick better value with `binwidth`.


p <-
 ggplot(mtcars, aes(x = factor(cyl), y = mpg)) +
  geom_dotplot(binaxis = "y", stackdir = "centerwhole")
plotly::ggplotly(p)
## Bin width defaults to 1/30 of the range of the data. Pick better value with `binwidth`.

p <-
 ggplot(mtcars, aes(x = factor(vs), fill = factor(cyl), y = mpg)) +
  geom_dotplot(binaxis = "y", stackdir = "center", position = "dodge")
plotly::ggplotly(p)
## Bin width defaults to 1/30 of the range of the data. Pick better value with `binwidth`.


p <-
 ggplot(mtcars, aes(x = factor(am), y = mpg)) +
  geom_dotplot(binaxis = "y", stackdir = "center", binpositions="all")
plotly::ggplotly(p)
## Bin width defaults to 1/30 of the range of the data. Pick better value with `binwidth`.


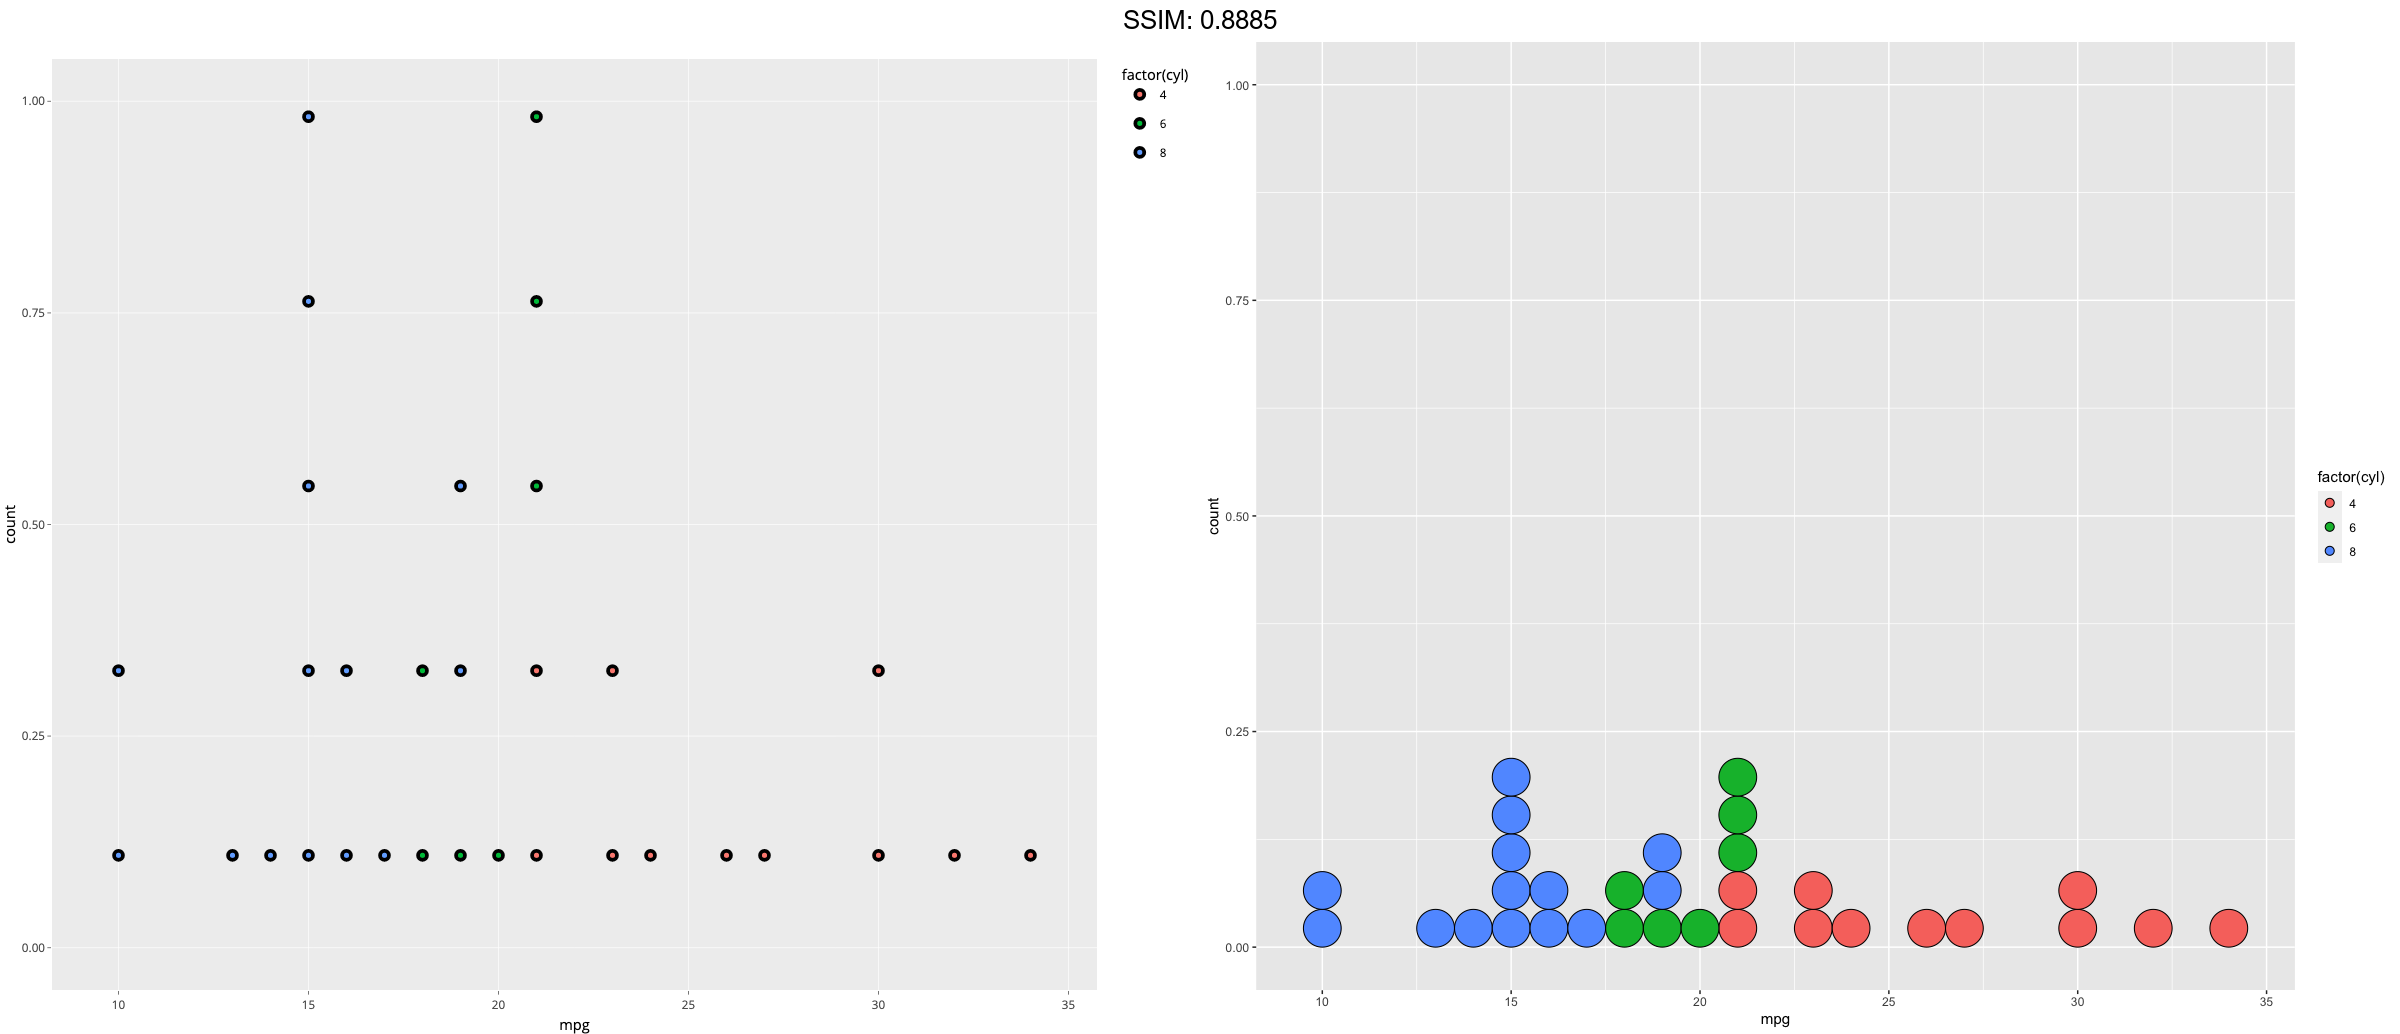
p <-
 ggplot(mtcars, aes(x = mpg, fill = factor(cyl))) +
  geom_dotplot(stackgroups = TRUE, binwidth = 1, binpositions = "all")
plotly::ggplotly(p)


p <-
 ggplot(mtcars, aes(x = mpg, fill = factor(cyl))) +
  geom_dotplot(stackgroups = TRUE, binwidth = 1, method = "histodot")
plotly::ggplotly(p)

p <-
 ggplot(mtcars, aes(x = 1, y = mpg, fill = factor(cyl))) +
  geom_dotplot(binaxis = "y", stackgroups = TRUE, binwidth = 1, method = "histodot")
plotly::ggplotly(p)

