GGPLOT - geom_count
Counts the number of observations at each location, then maps the count to point area and then convert them with ggplotly.
p <-
 ggplot(mpg, aes(cty, hwy)) +
 geom_point()
plotly::ggplotly(p)

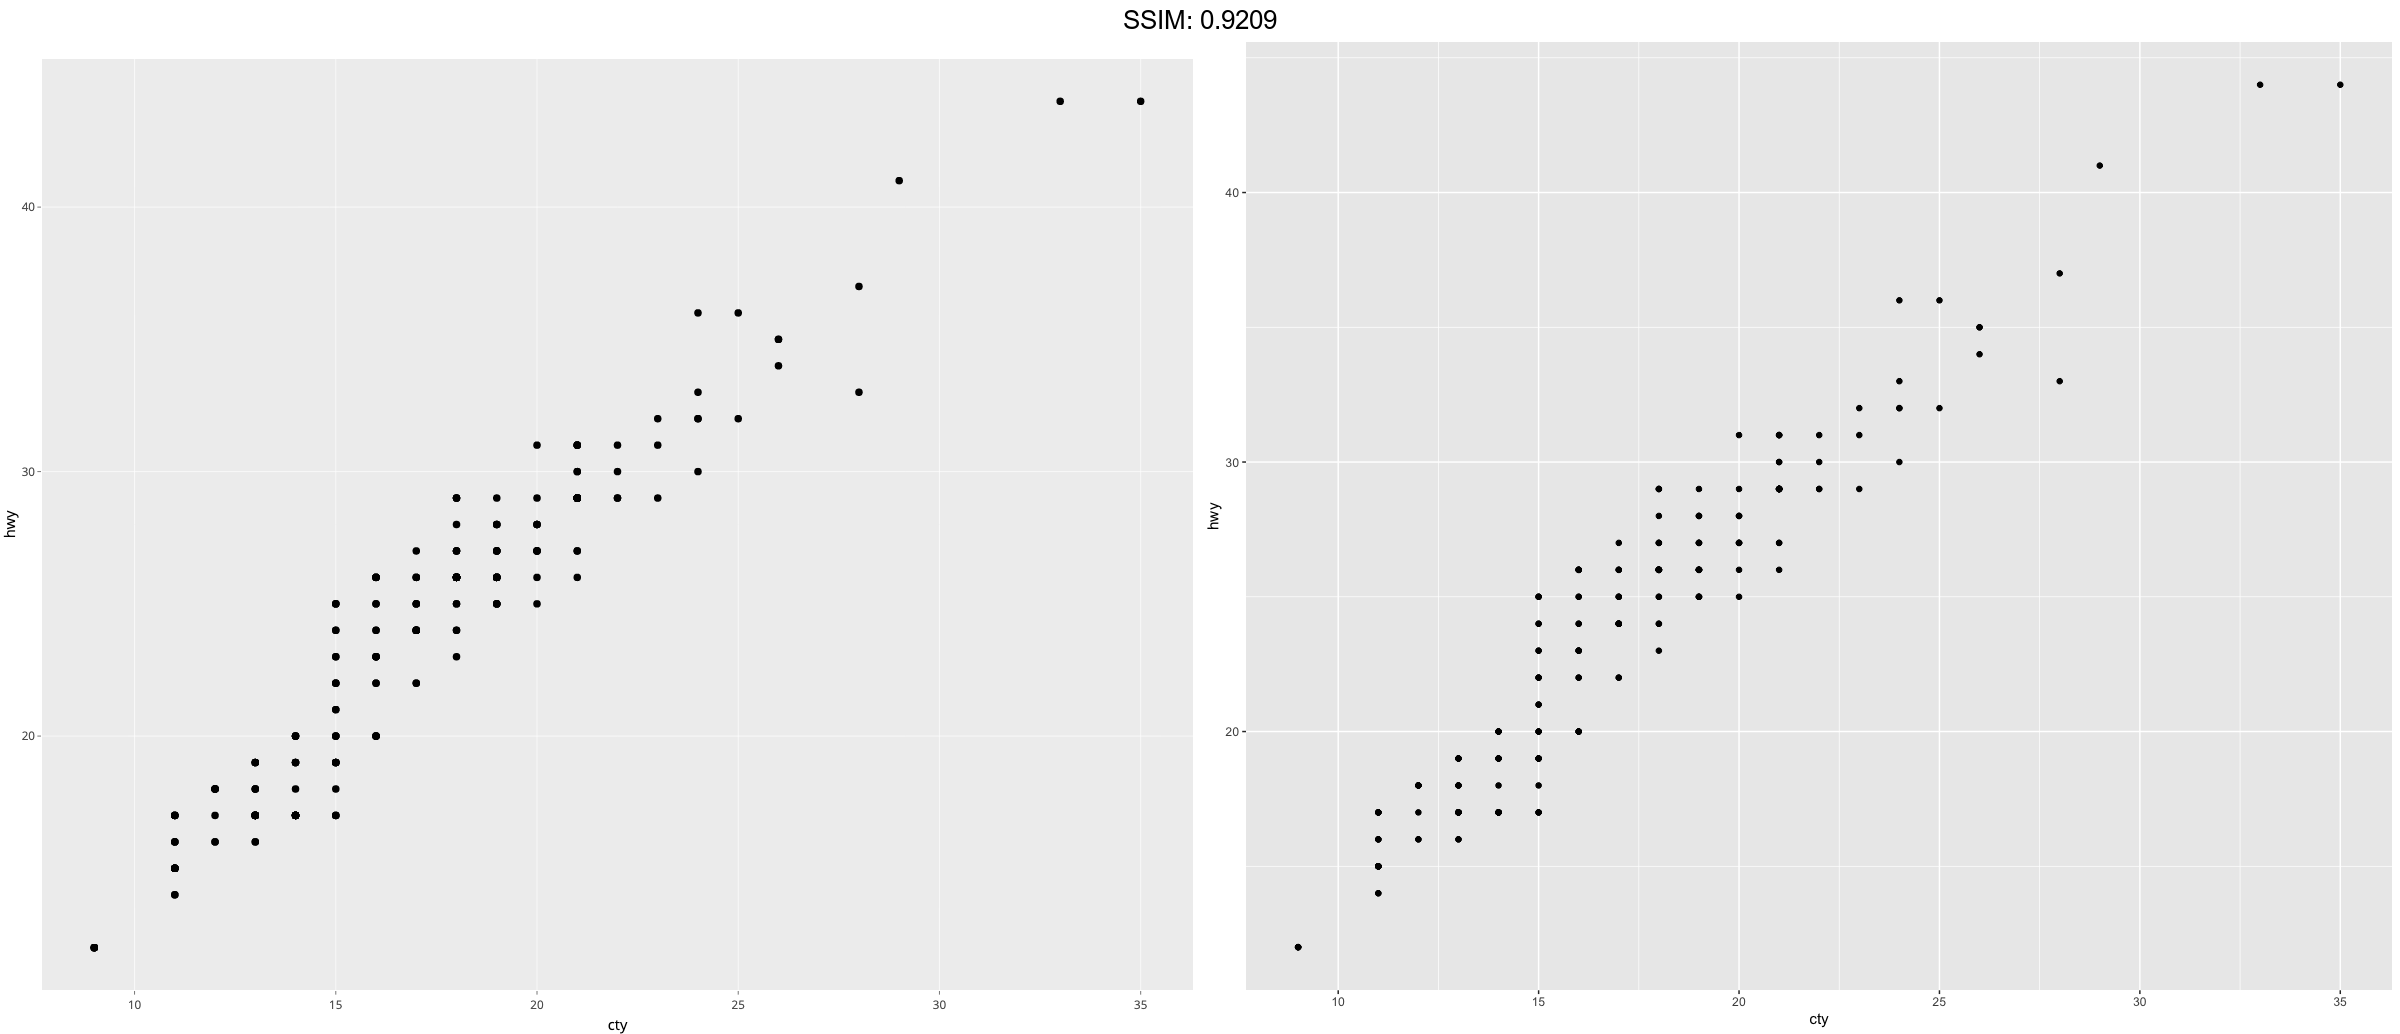
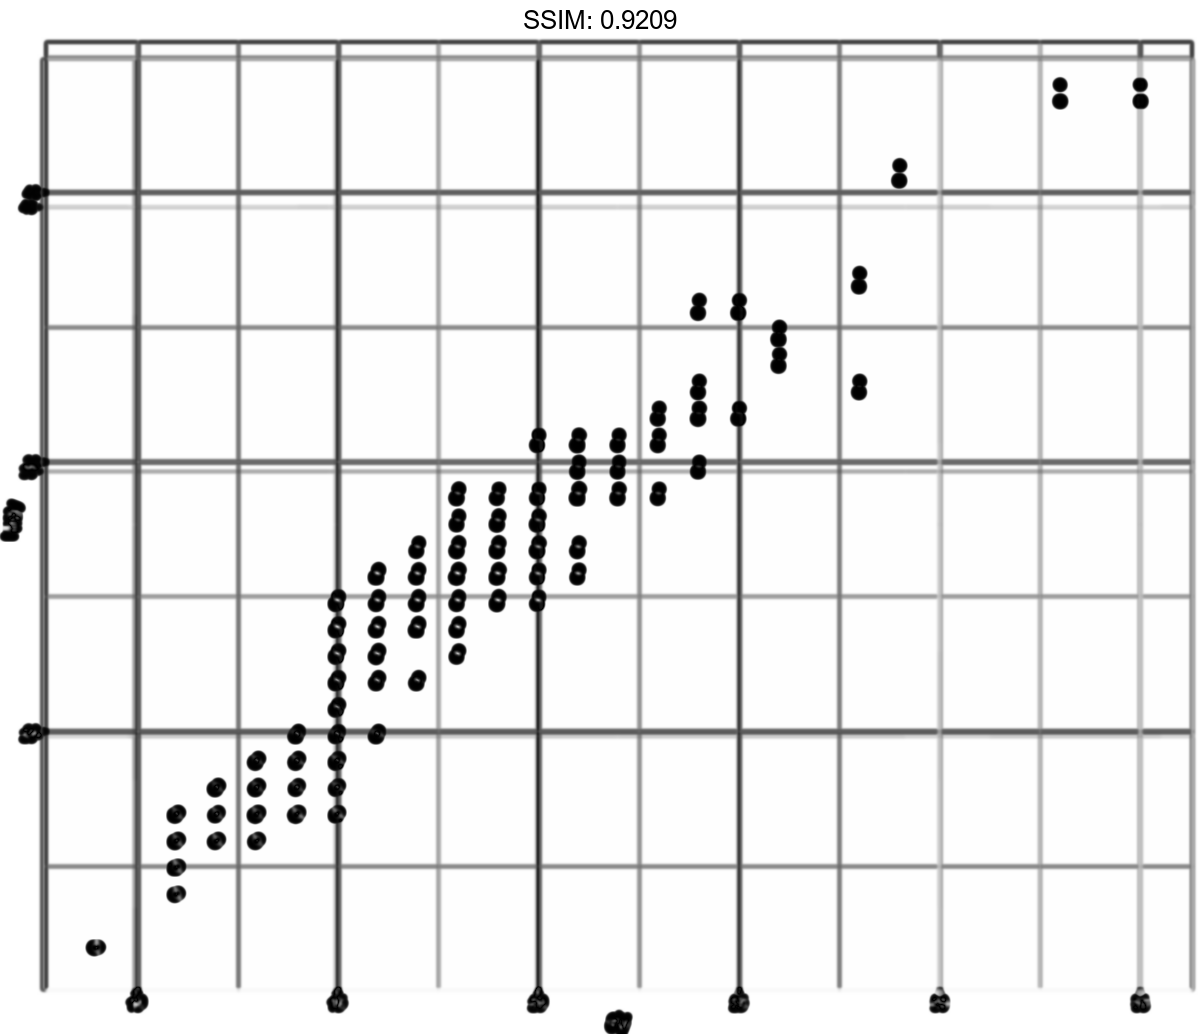
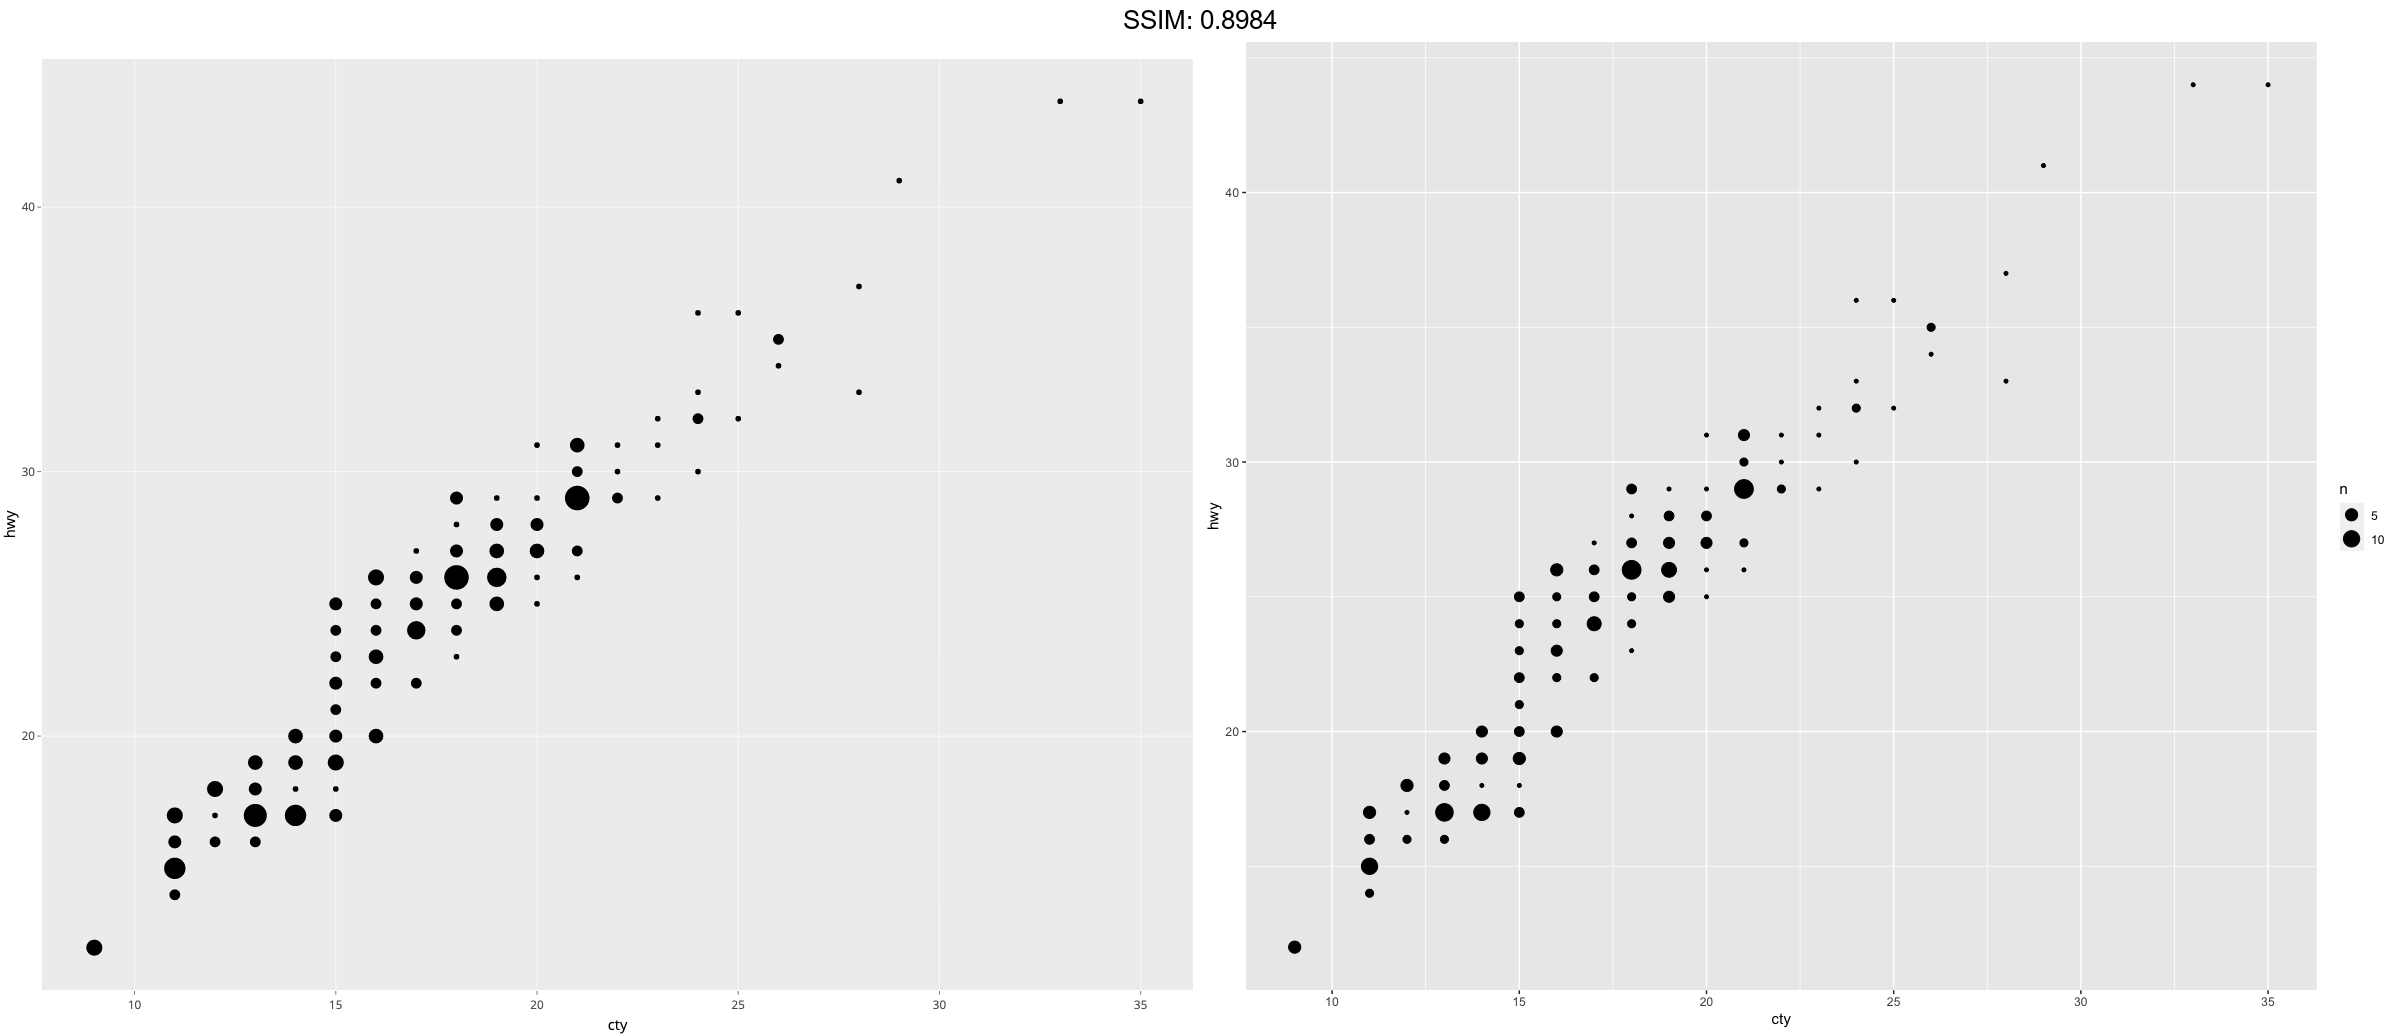
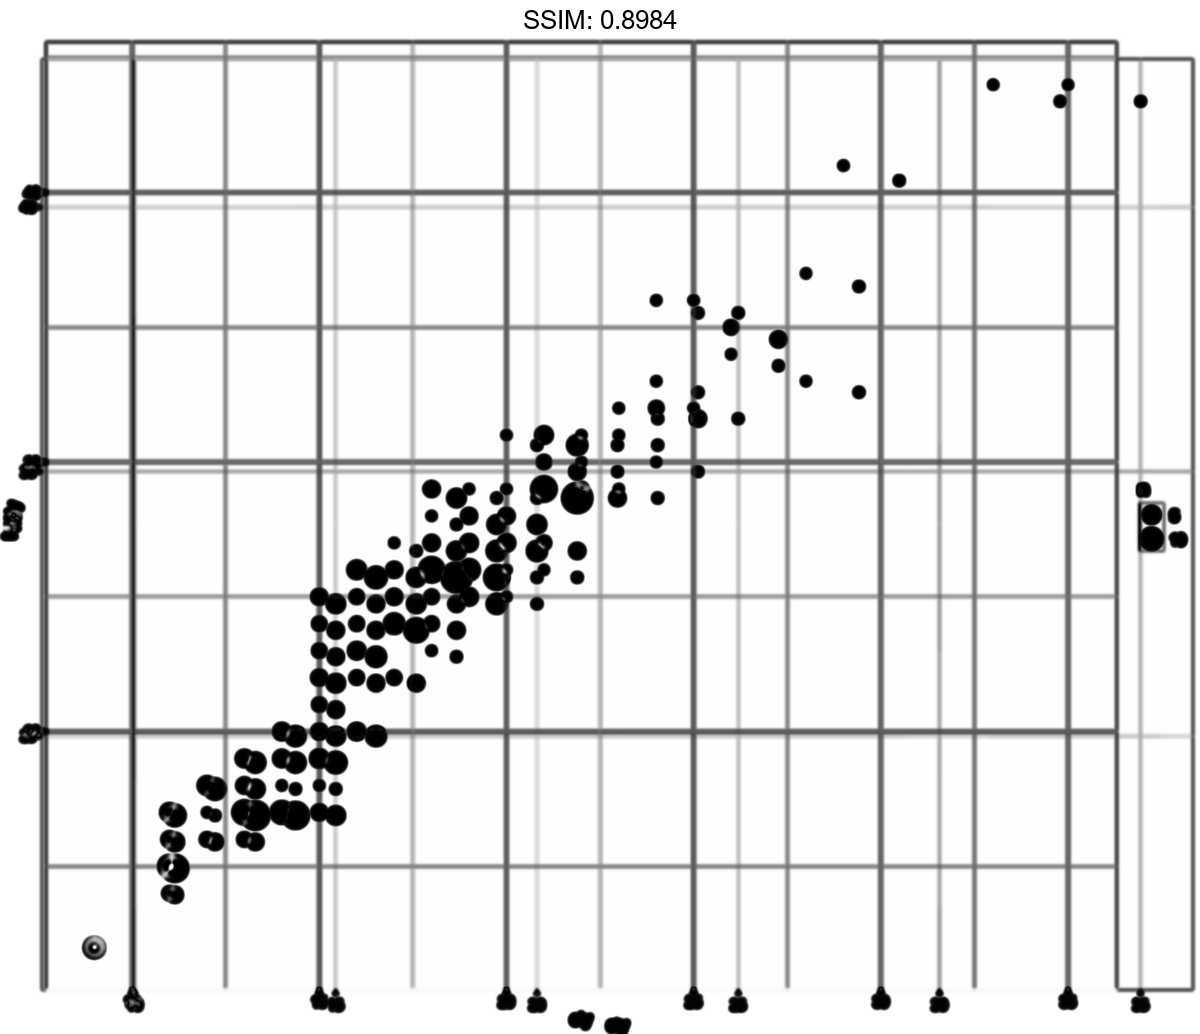
p <-
 ggplot(mpg, aes(cty, hwy)) +
 geom_count()
plotly::ggplotly(p)
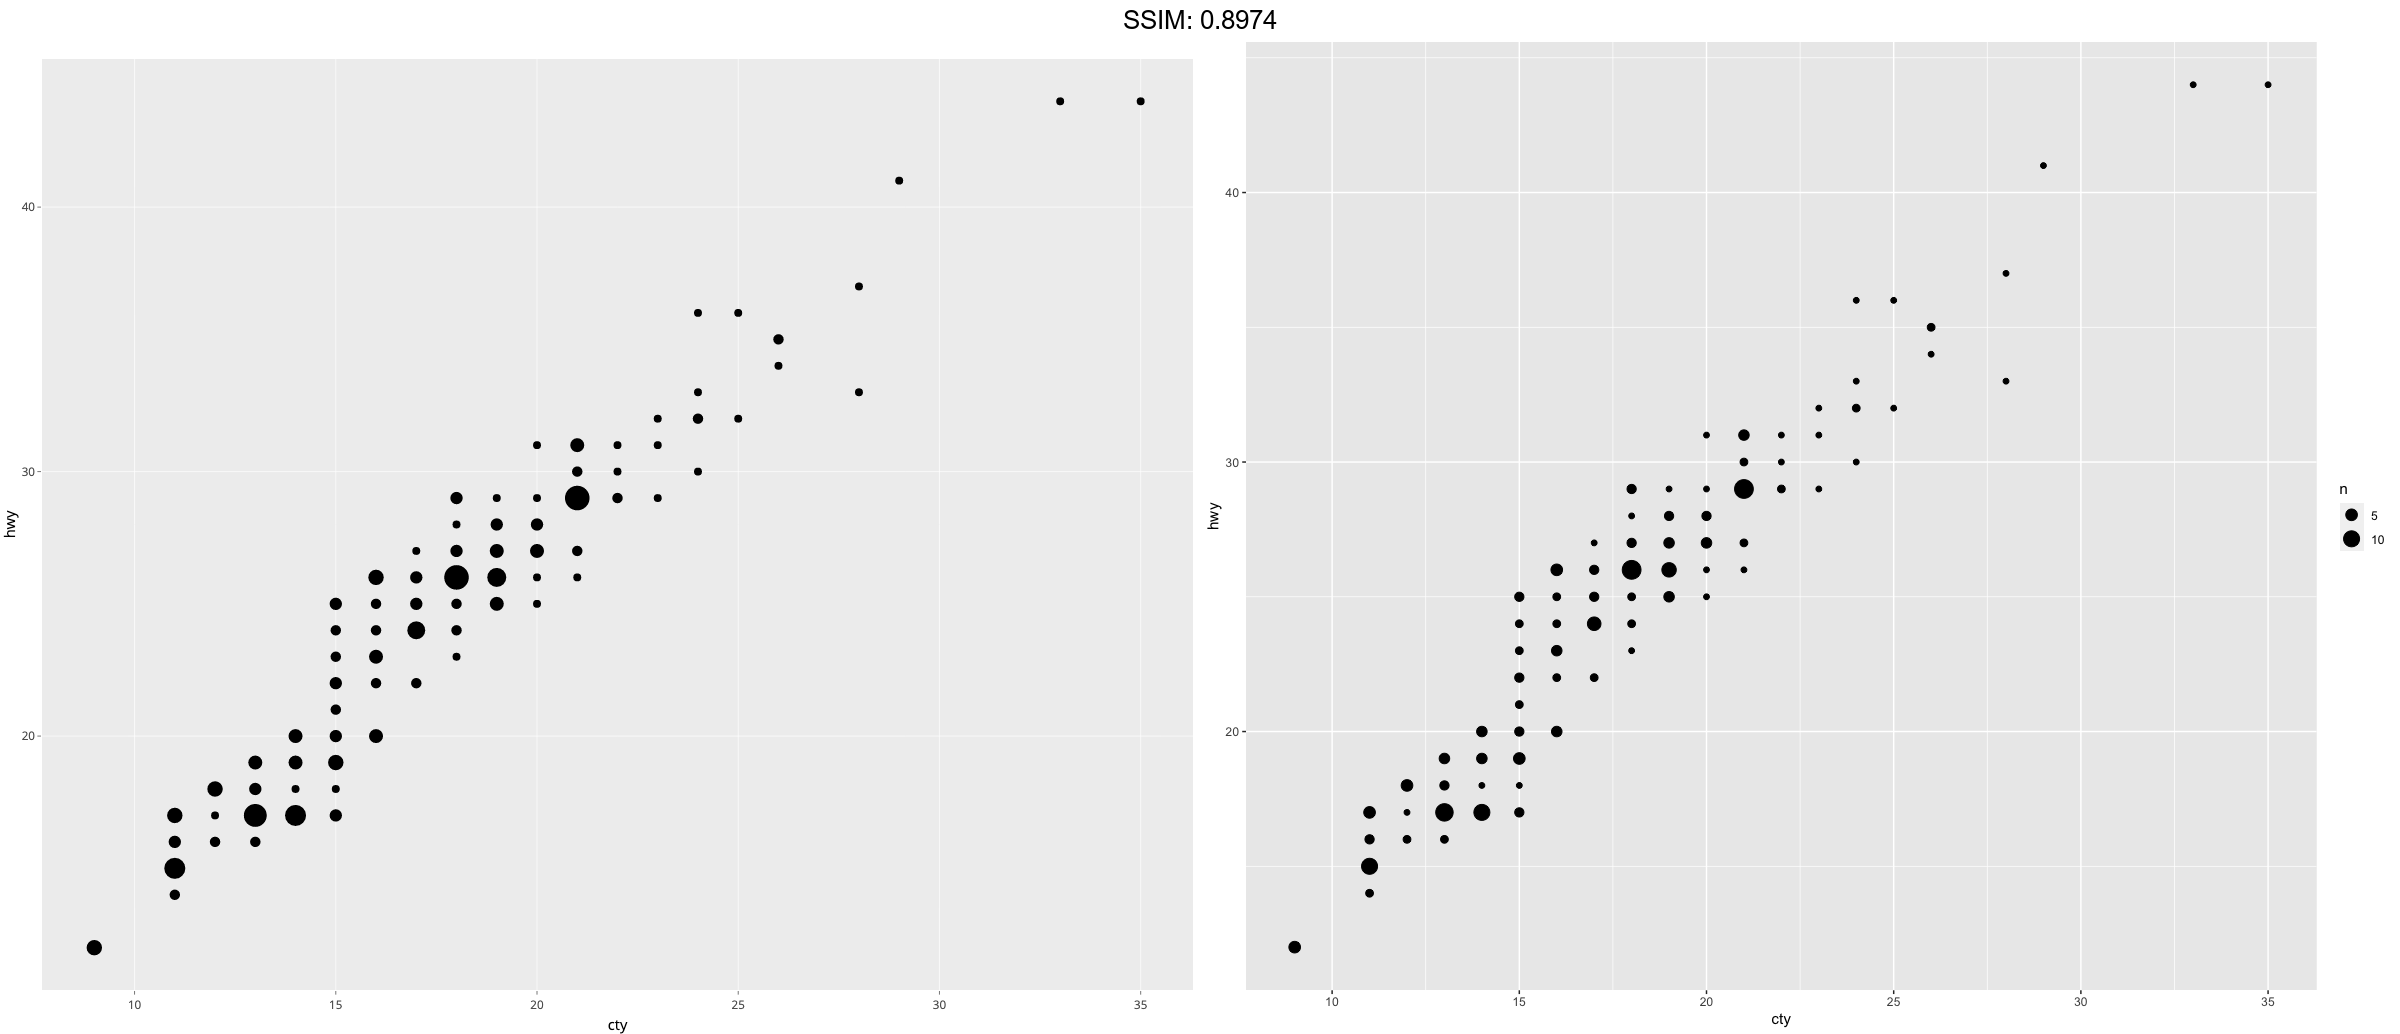
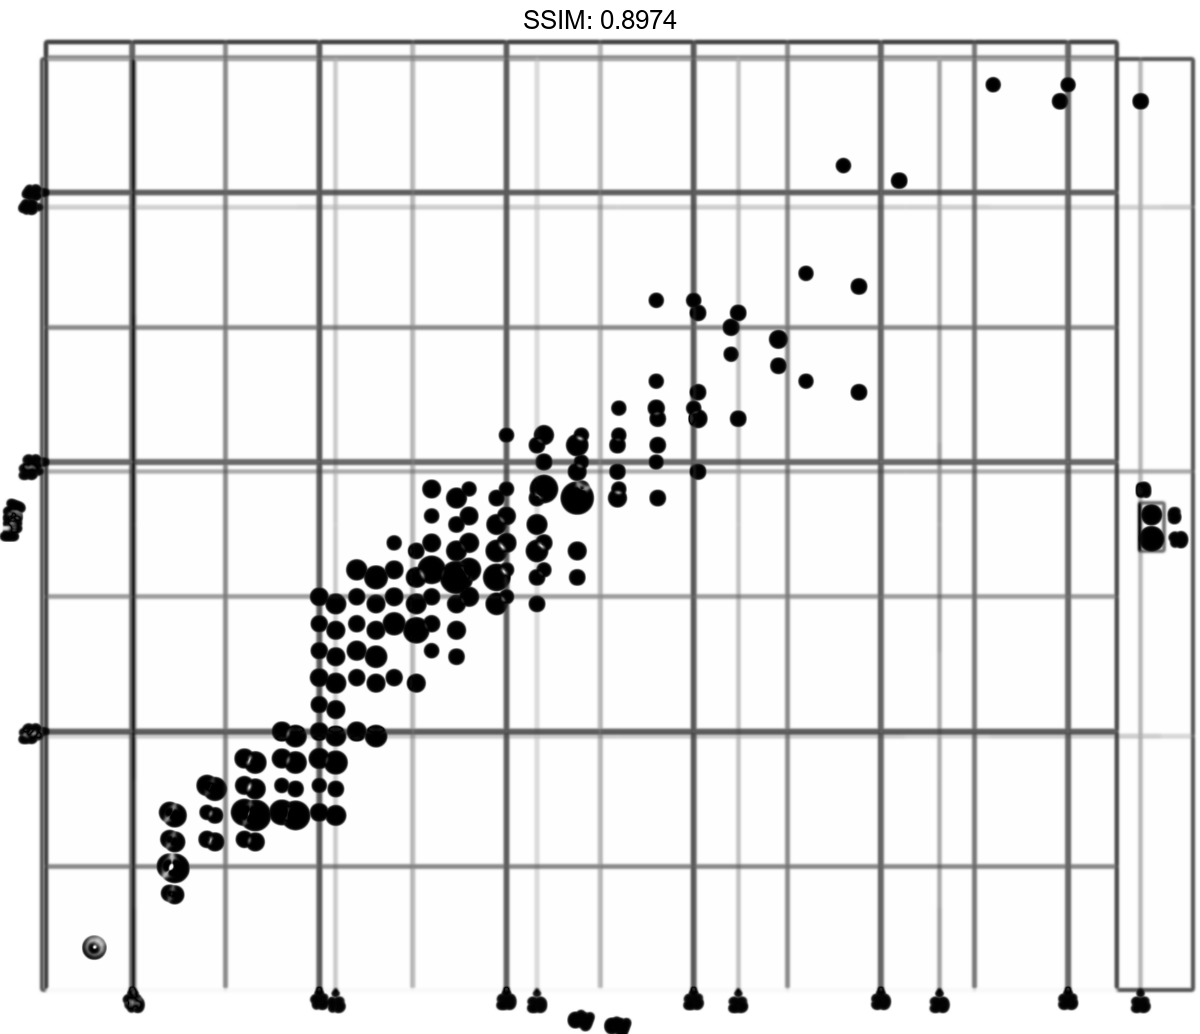
p <-
 ggplot(mpg, aes(cty, hwy)) +
 geom_count() +
 scale_size_area()
plotly::ggplotly(p)
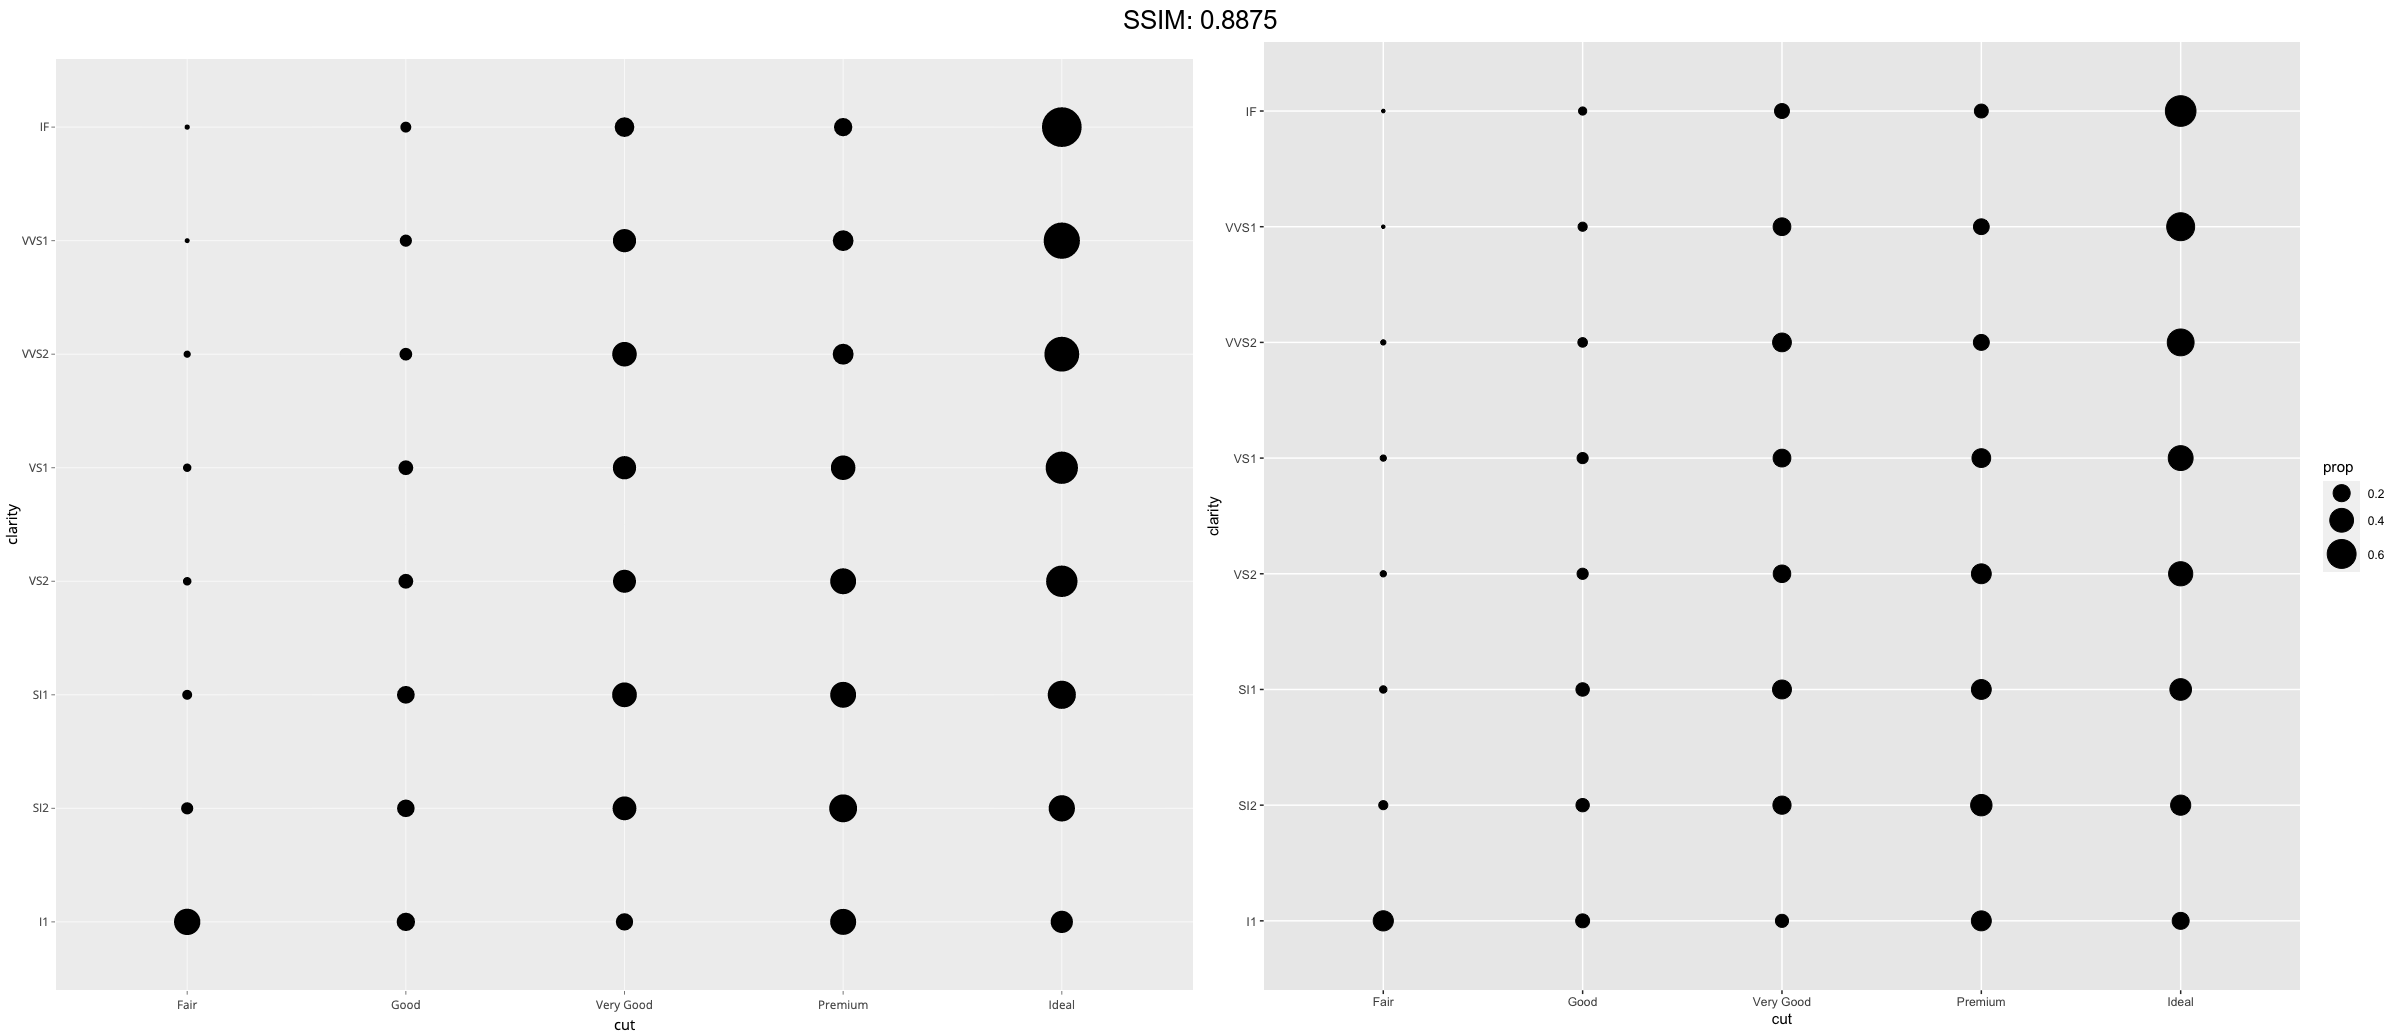
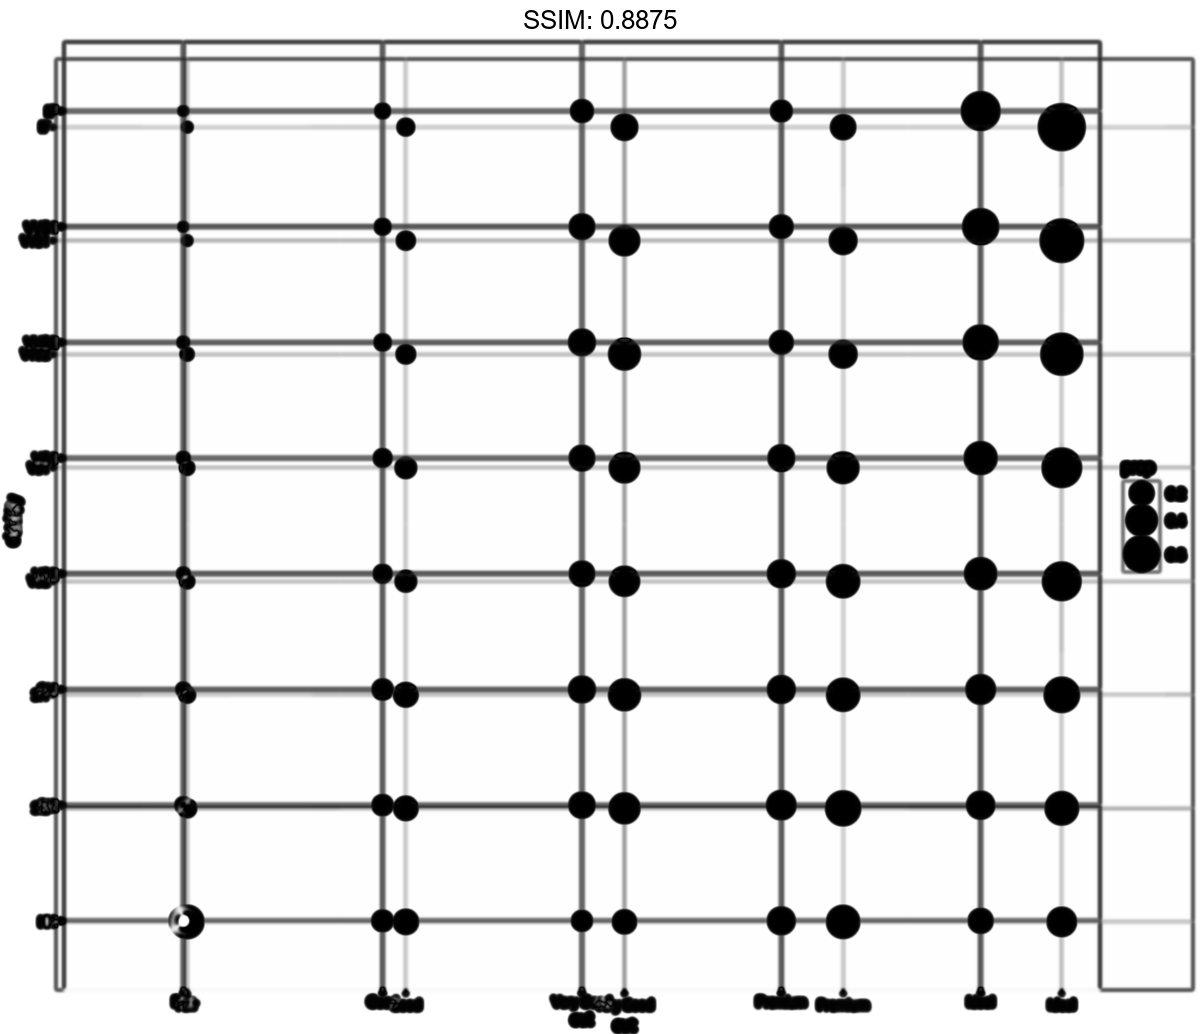
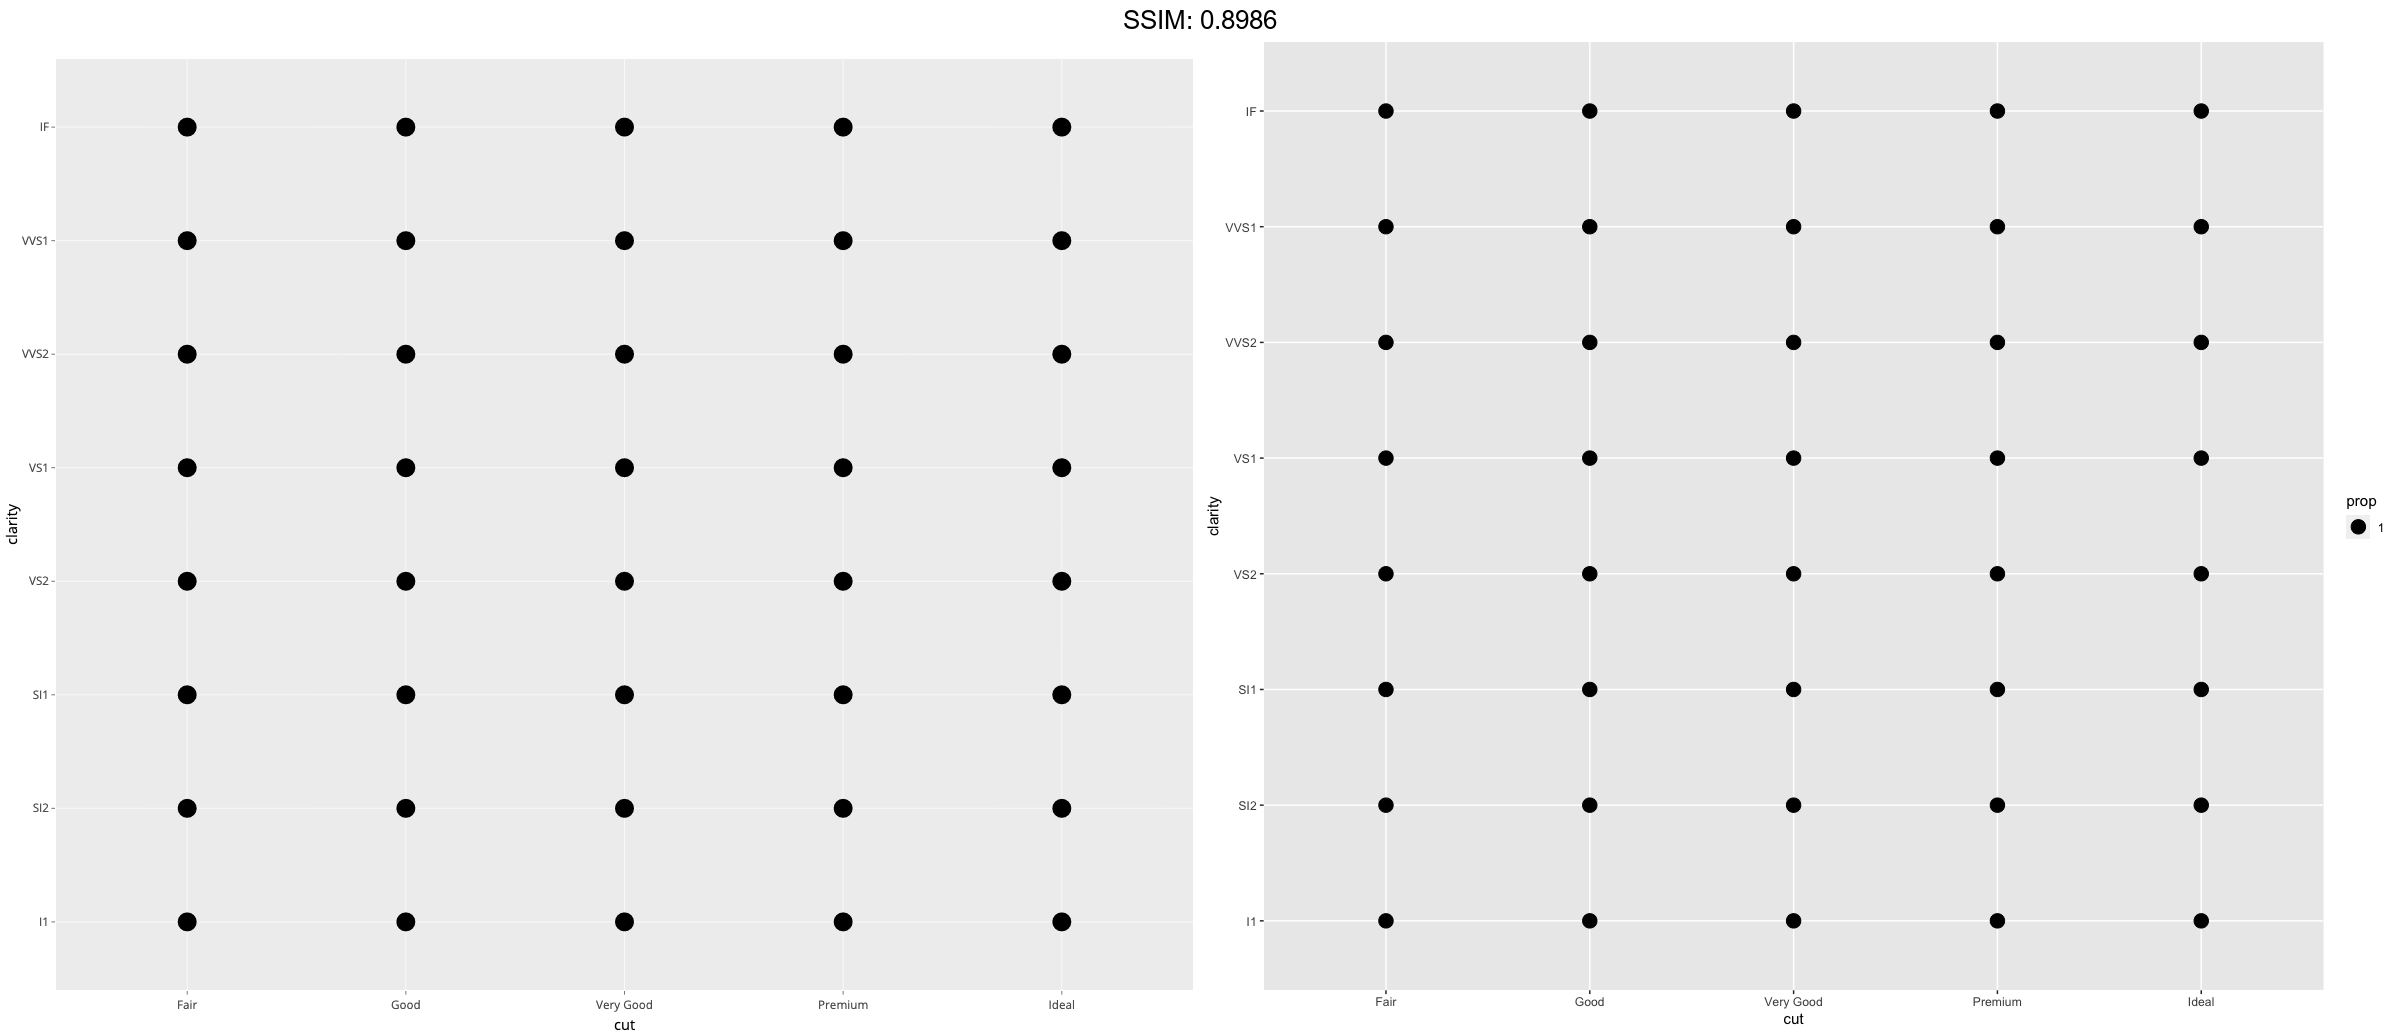
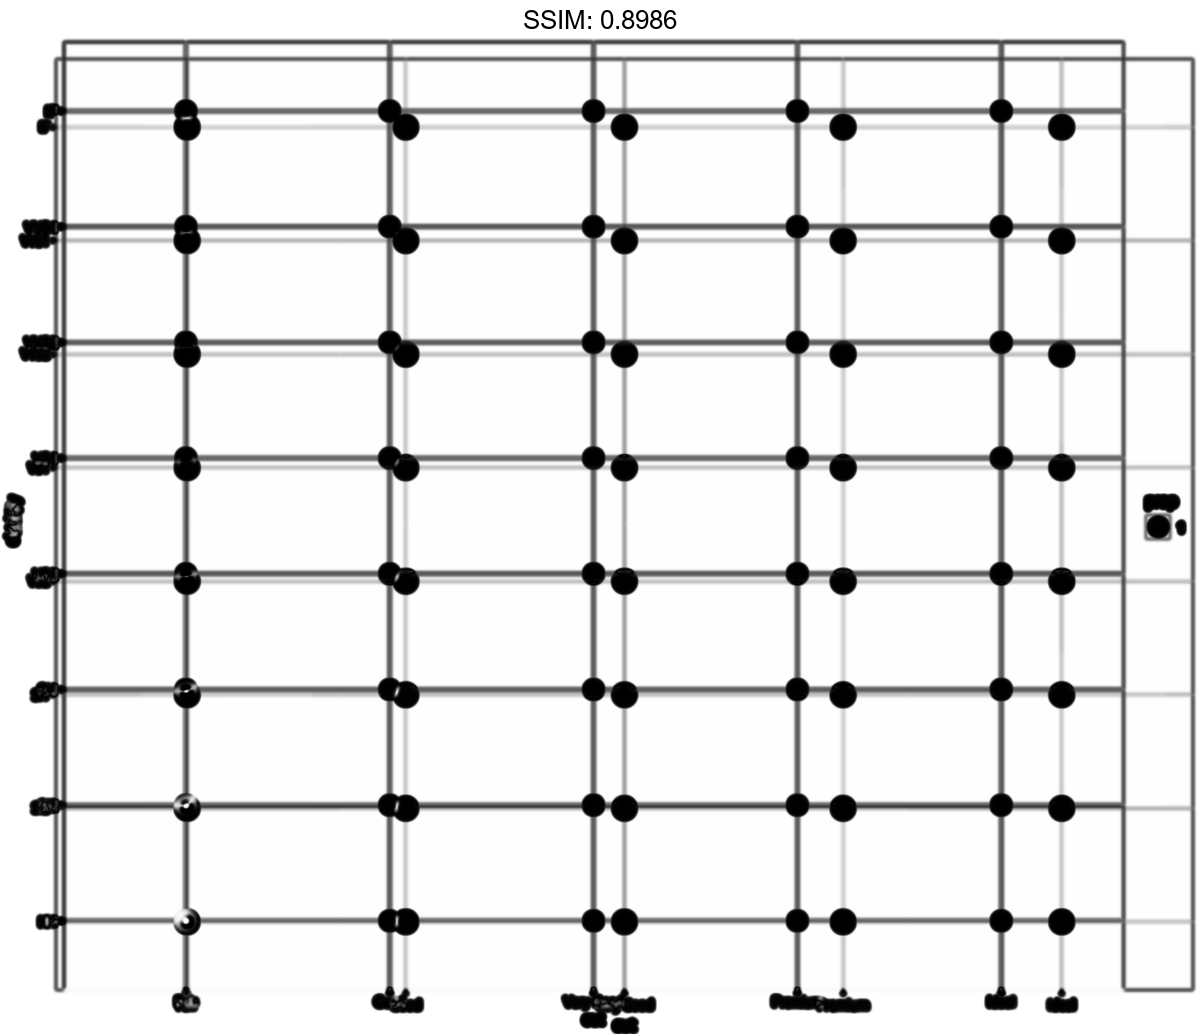
d <- ggplot(diamonds, aes(x = cut, y = clarity))
p <-  d + geom_count(aes(size = after_stat(prop)))
plotly::ggplotly(p)
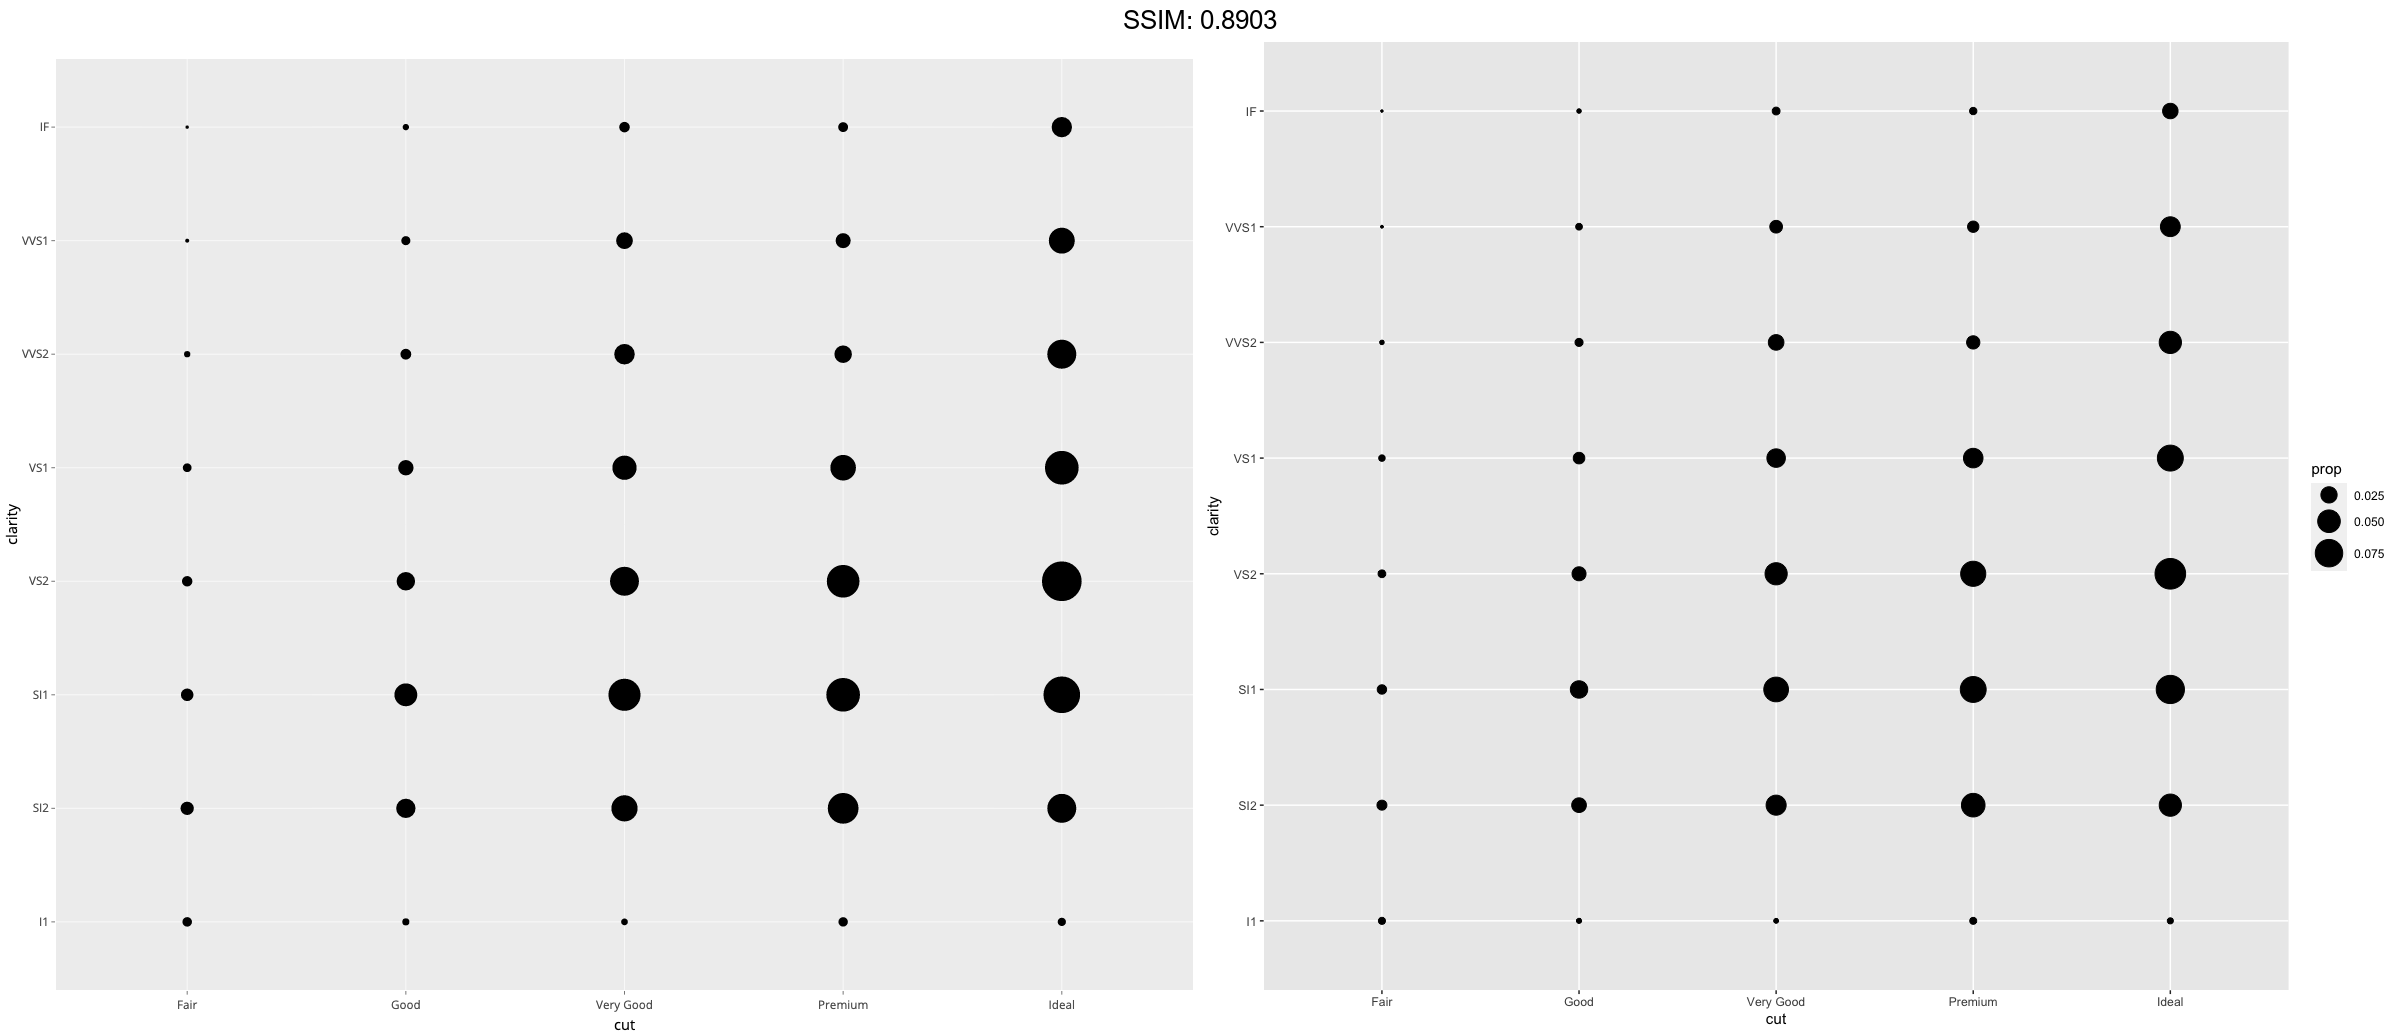
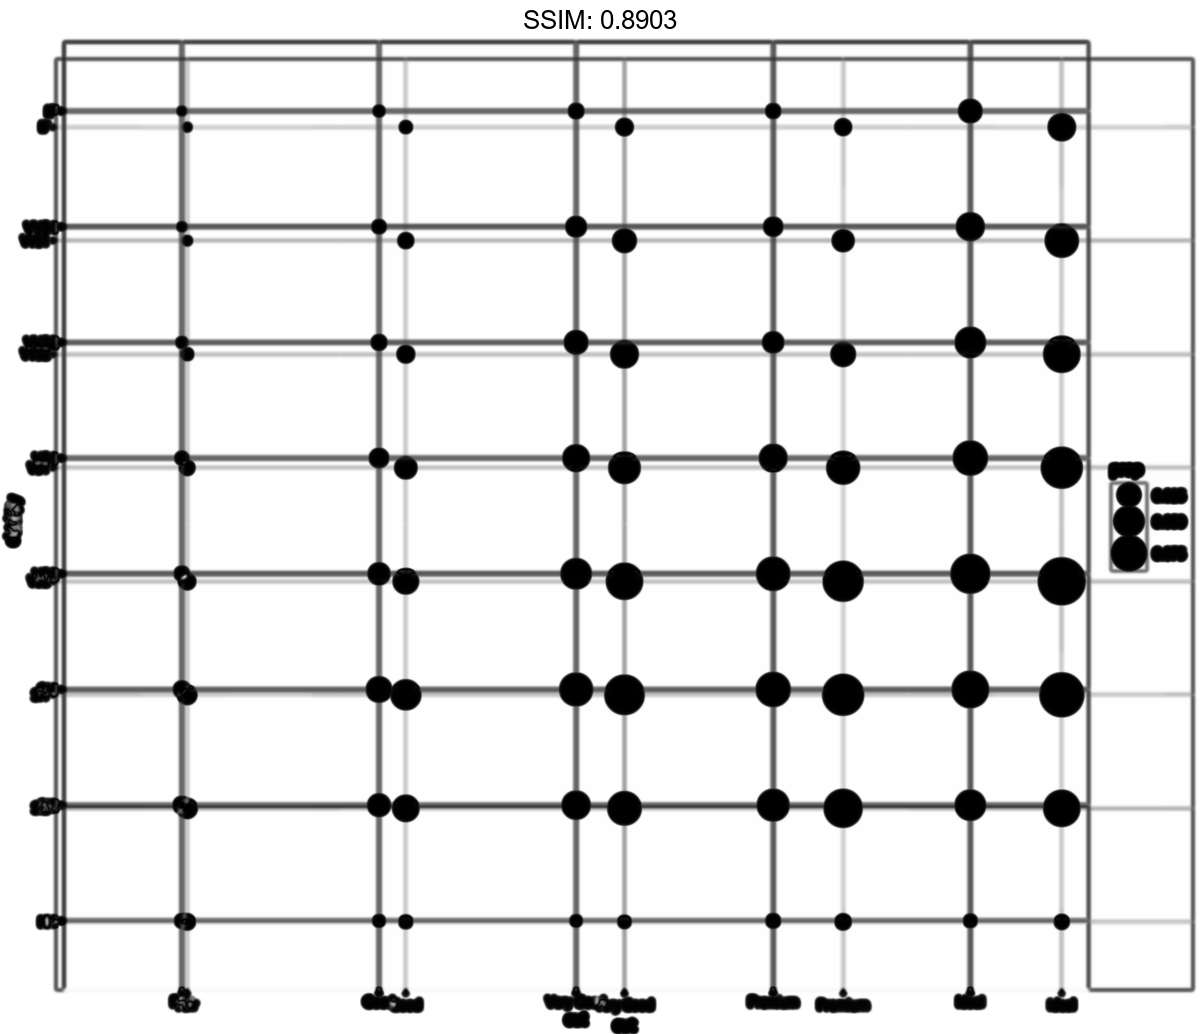
d <- ggplot(diamonds, aes(x = cut, y = clarity))
p <-
 d + geom_count(aes(size = after_stat(prop), group = 1)) +
  scale_size_area(max_size = 10)
plotly::ggplotly(p)
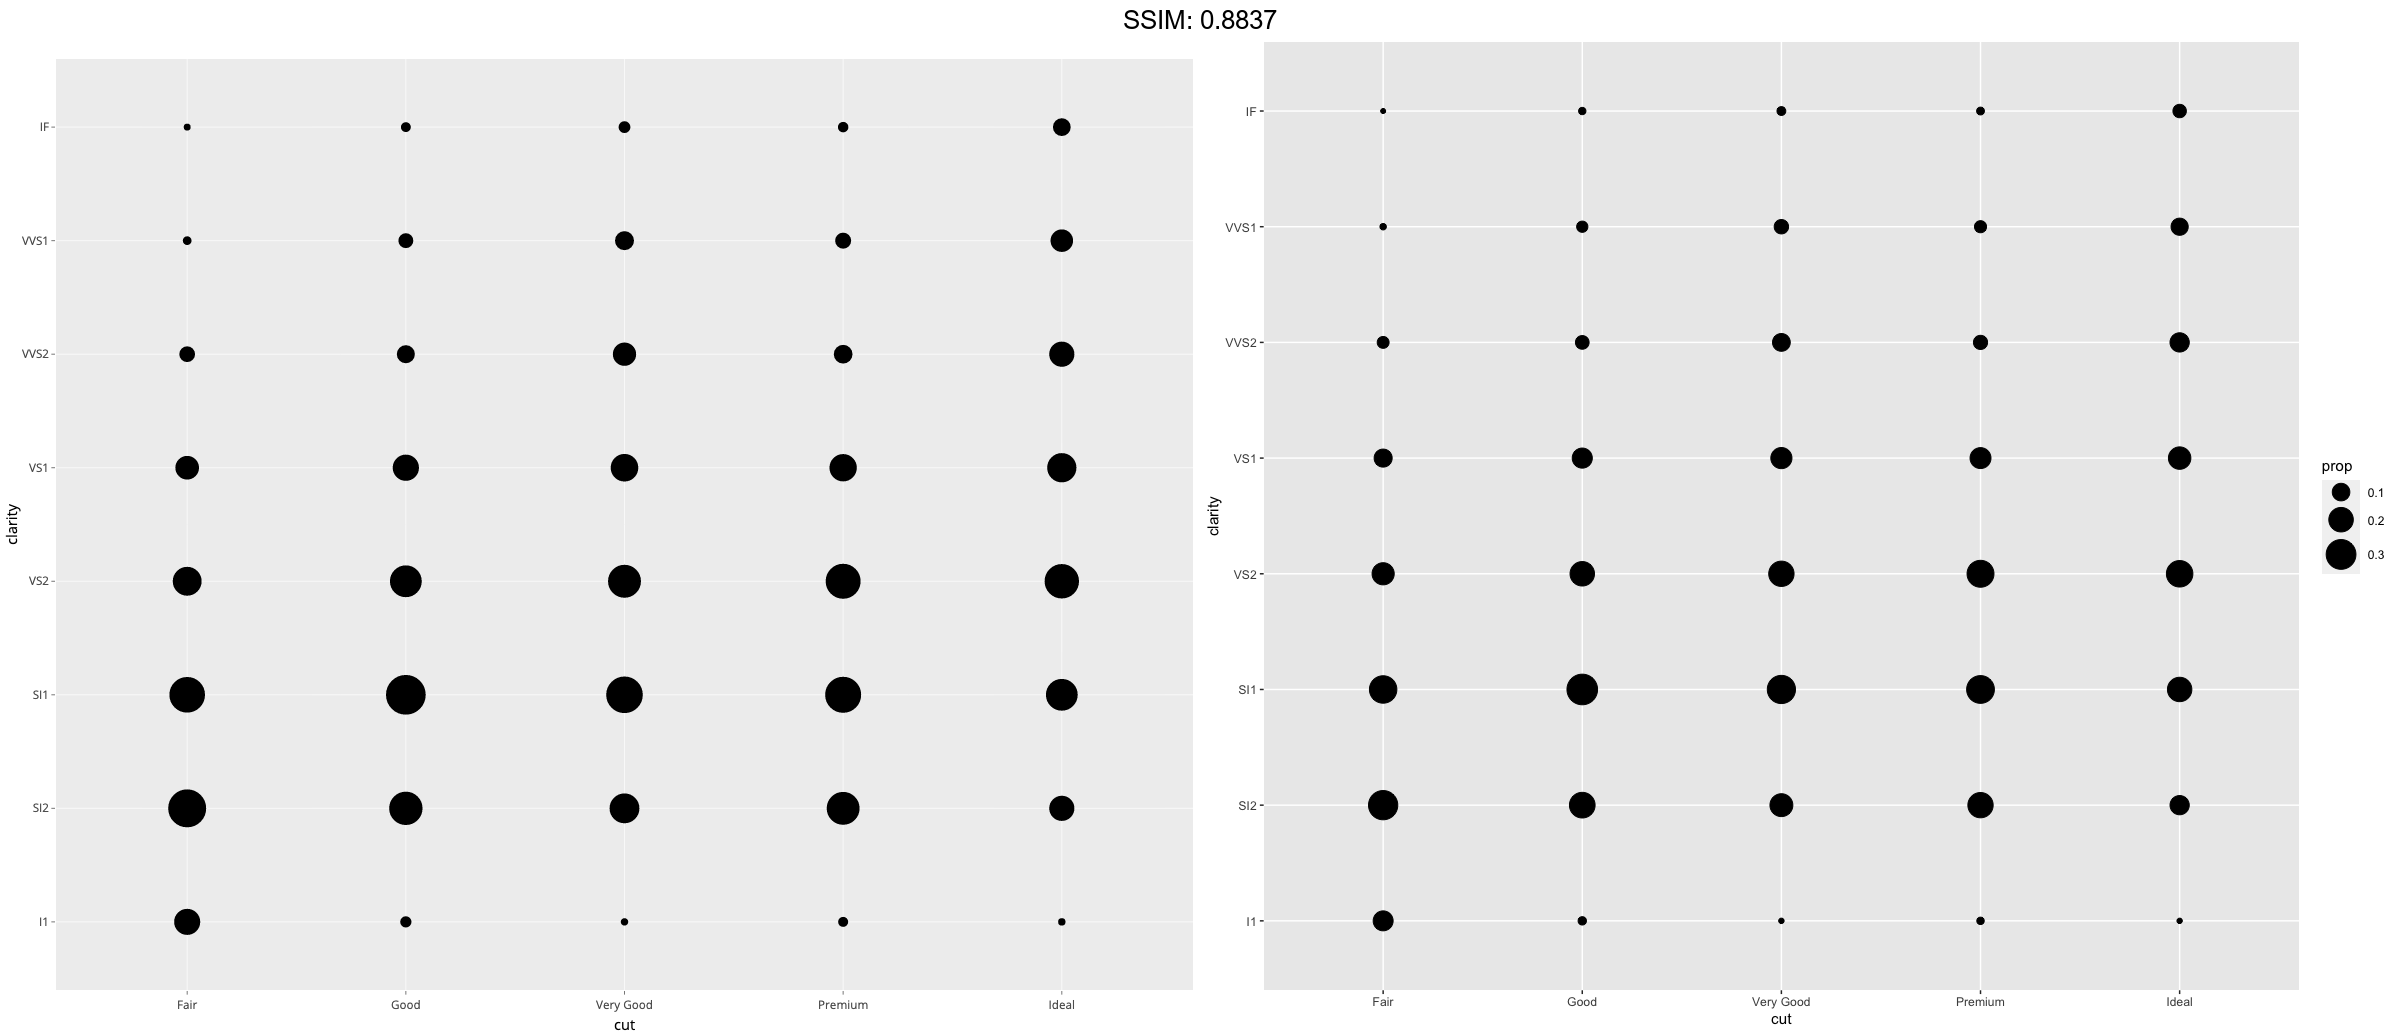
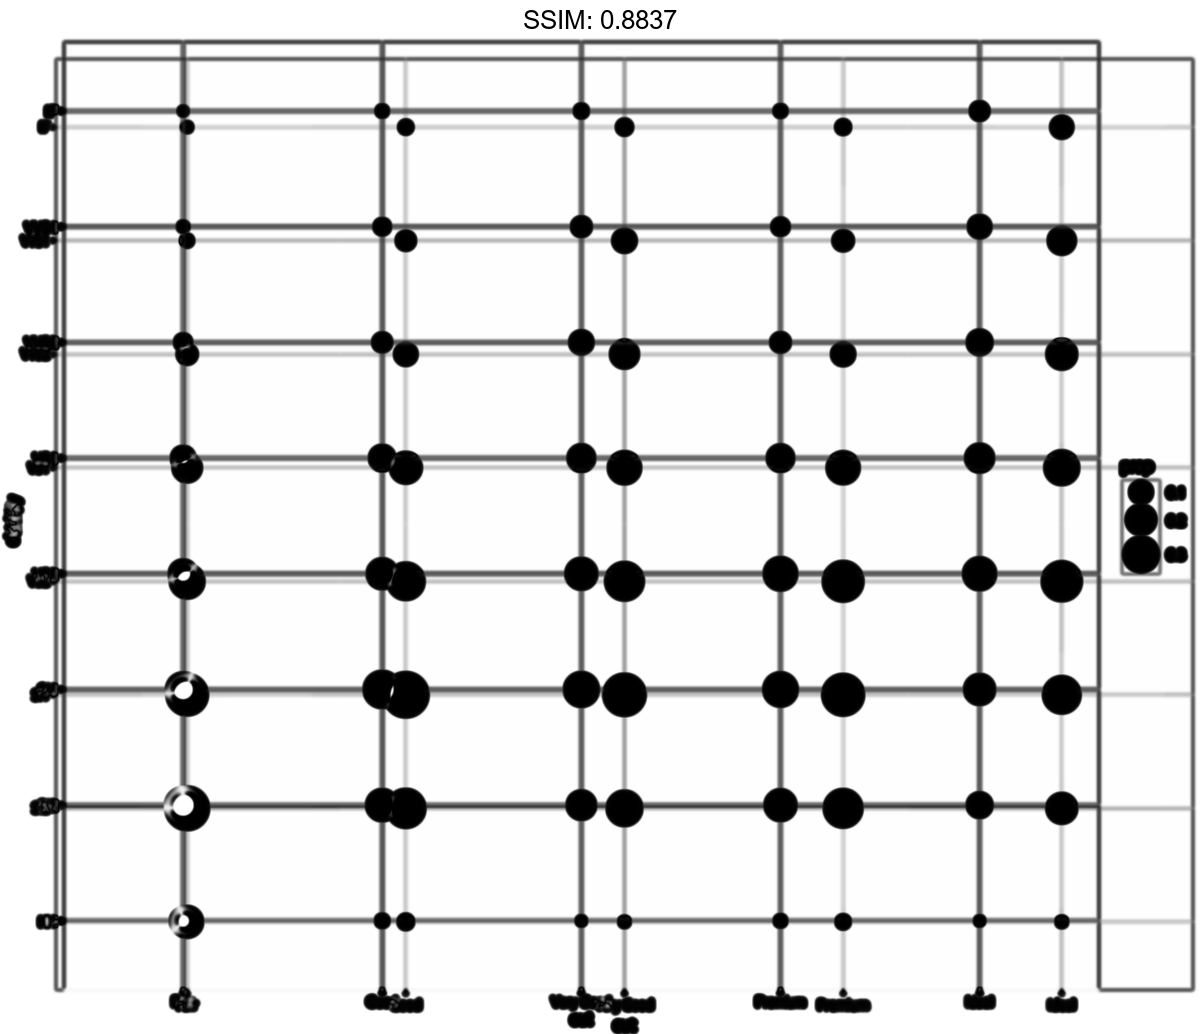
d <- ggplot(diamonds, aes(x = cut, y = clarity))
p <-
 d + geom_count(aes(size = after_stat(prop), group = cut)) +
  scale_size_area(max_size = 10)
plotly::ggplotly(p)
d <- ggplot(diamonds, aes(x = cut, y = clarity))
p <-
 d + geom_count(aes(size = after_stat(prop), group = clarity)) +
  scale_size_area(max_size = 10)
plotly::ggplotly(p)