GGPLOT - geom_contour
Visualise 3D surfaces in 2D and then convert them with ggplotly.
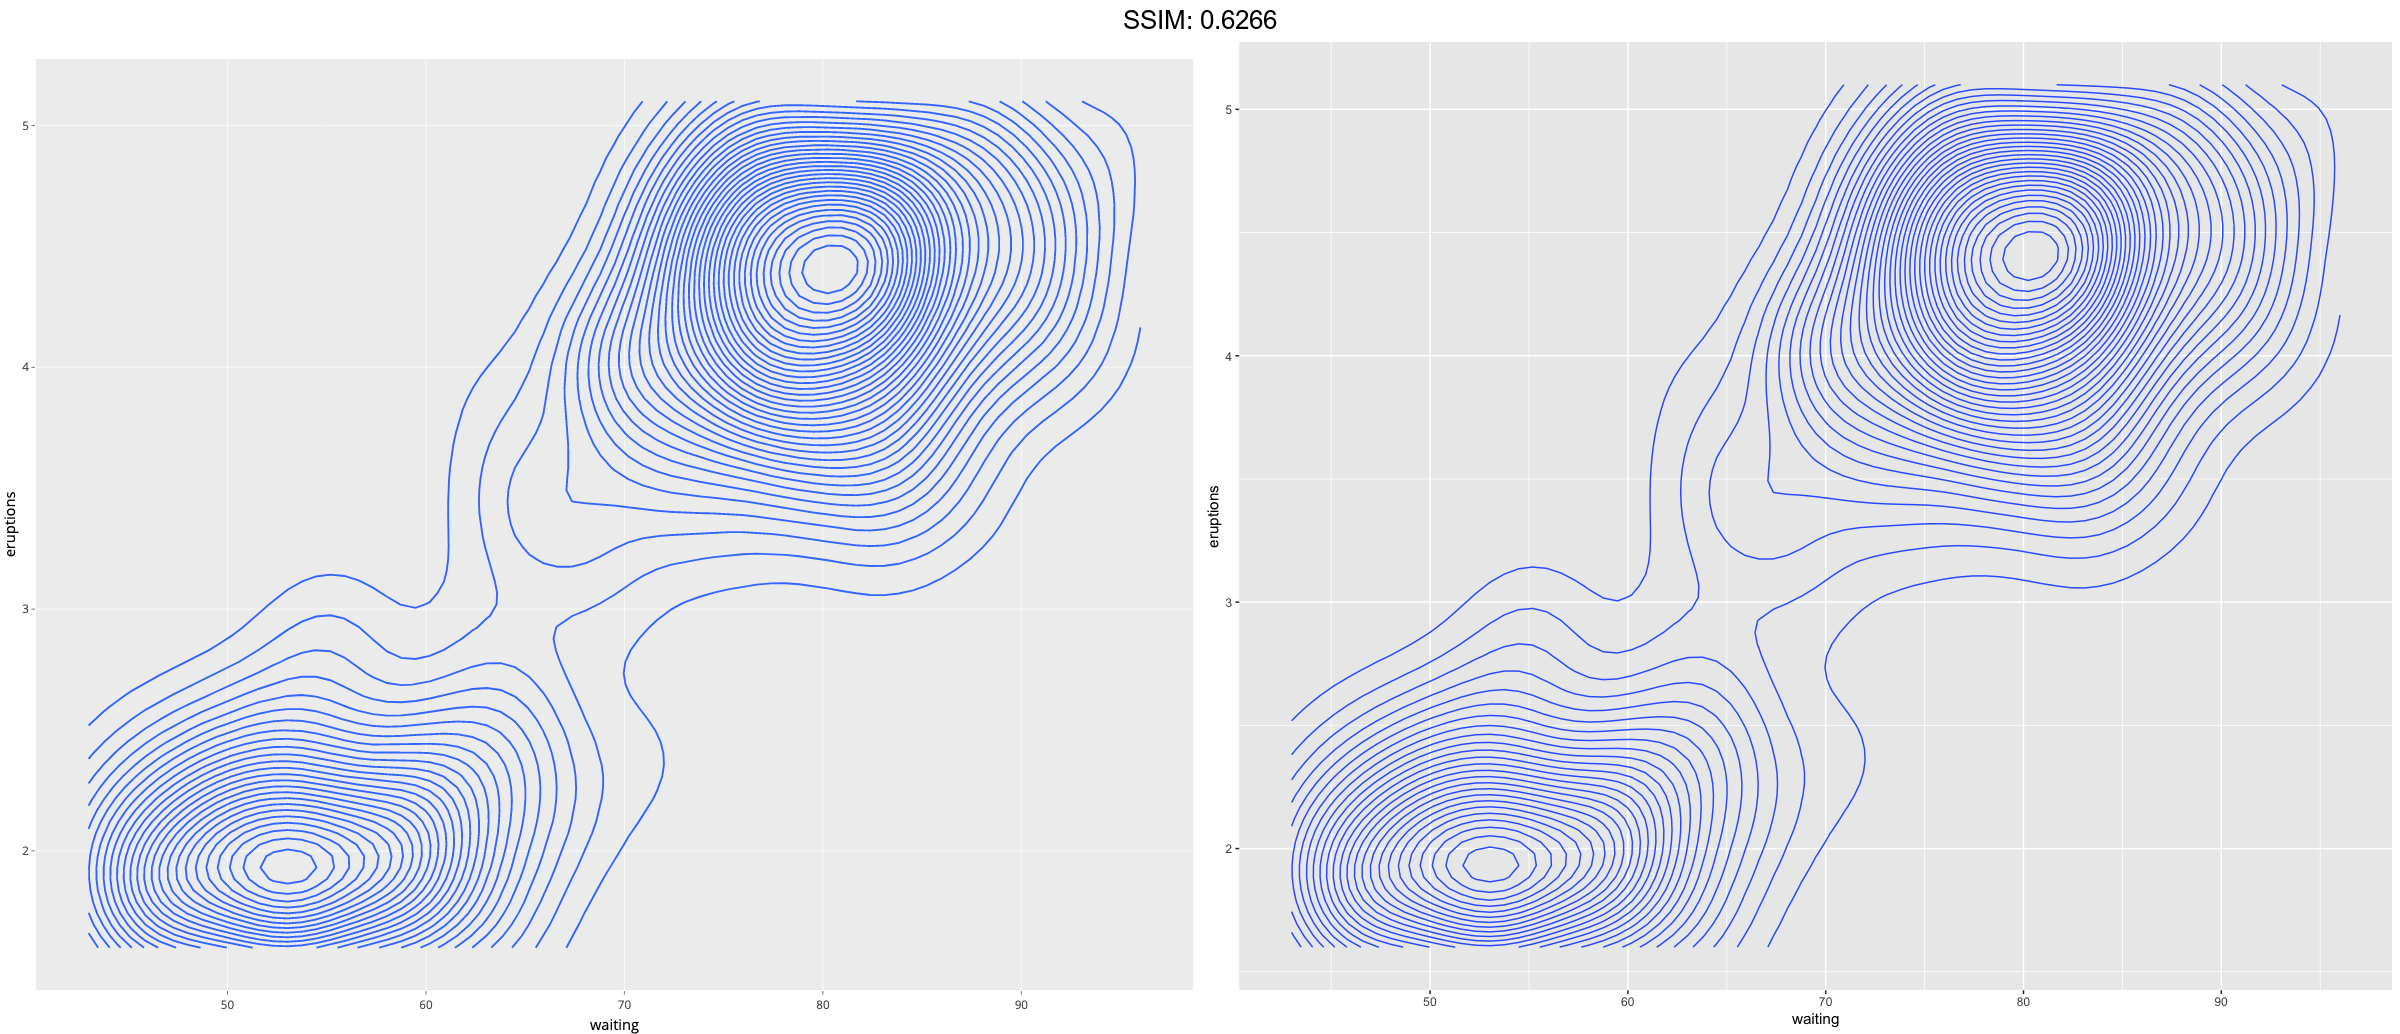
v <- ggplot(faithfuld, aes(waiting, eruptions, z = density))
p <-  v + geom_contour()
plotly::ggplotly(p)


p <-
 ggplot(faithful, aes(waiting, eruptions)) +
  geom_density_2d()
plotly::ggplotly(p)

v <- ggplot(faithfuld, aes(waiting, eruptions, z = density))
p <-  v + geom_contour_filled()
plotly::ggplotly(p)
## Warning in geom2trace.default(dots[[1L]][[8L]], dots[[2L]][[1L]], dots[[3L]][[1L]]): geom_GeomContourFilled() has yet to be implemented in plotly.
##   If you'd like to see this geom implemented,
##   Please open an issue with your example code at
##   https://github.com/ropensci/plotly/issues

## Warning in geom2trace.default(dots[[1L]][[8L]], dots[[2L]][[1L]], dots[[3L]][[1L]]): geom_GeomContourFilled() has yet to be implemented in plotly.
##   If you'd like to see this geom implemented,
##   Please open an issue with your example code at
##   https://github.com/ropensci/plotly/issues

## Warning in geom2trace.default(dots[[1L]][[8L]], dots[[2L]][[1L]], dots[[3L]][[1L]]): geom_GeomContourFilled() has yet to be implemented in plotly.
##   If you'd like to see this geom implemented,
##   Please open an issue with your example code at
##   https://github.com/ropensci/plotly/issues

## Warning in geom2trace.default(dots[[1L]][[8L]], dots[[2L]][[1L]], dots[[3L]][[1L]]): geom_GeomContourFilled() has yet to be implemented in plotly.
##   If you'd like to see this geom implemented,
##   Please open an issue with your example code at
##   https://github.com/ropensci/plotly/issues

## Warning in geom2trace.default(dots[[1L]][[8L]], dots[[2L]][[1L]], dots[[3L]][[1L]]): geom_GeomContourFilled() has yet to be implemented in plotly.
##   If you'd like to see this geom implemented,
##   Please open an issue with your example code at
##   https://github.com/ropensci/plotly/issues

## Warning in geom2trace.default(dots[[1L]][[8L]], dots[[2L]][[1L]], dots[[3L]][[1L]]): geom_GeomContourFilled() has yet to be implemented in plotly.
##   If you'd like to see this geom implemented,
##   Please open an issue with your example code at
##   https://github.com/ropensci/plotly/issues

## Warning in geom2trace.default(dots[[1L]][[8L]], dots[[2L]][[1L]], dots[[3L]][[1L]]): geom_GeomContourFilled() has yet to be implemented in plotly.
##   If you'd like to see this geom implemented,
##   Please open an issue with your example code at
##   https://github.com/ropensci/plotly/issues

## Warning in geom2trace.default(dots[[1L]][[8L]], dots[[2L]][[1L]], dots[[3L]][[1L]]): geom_GeomContourFilled() has yet to be implemented in plotly.
##   If you'd like to see this geom implemented,
##   Please open an issue with your example code at
##   https://github.com/ropensci/plotly/issues


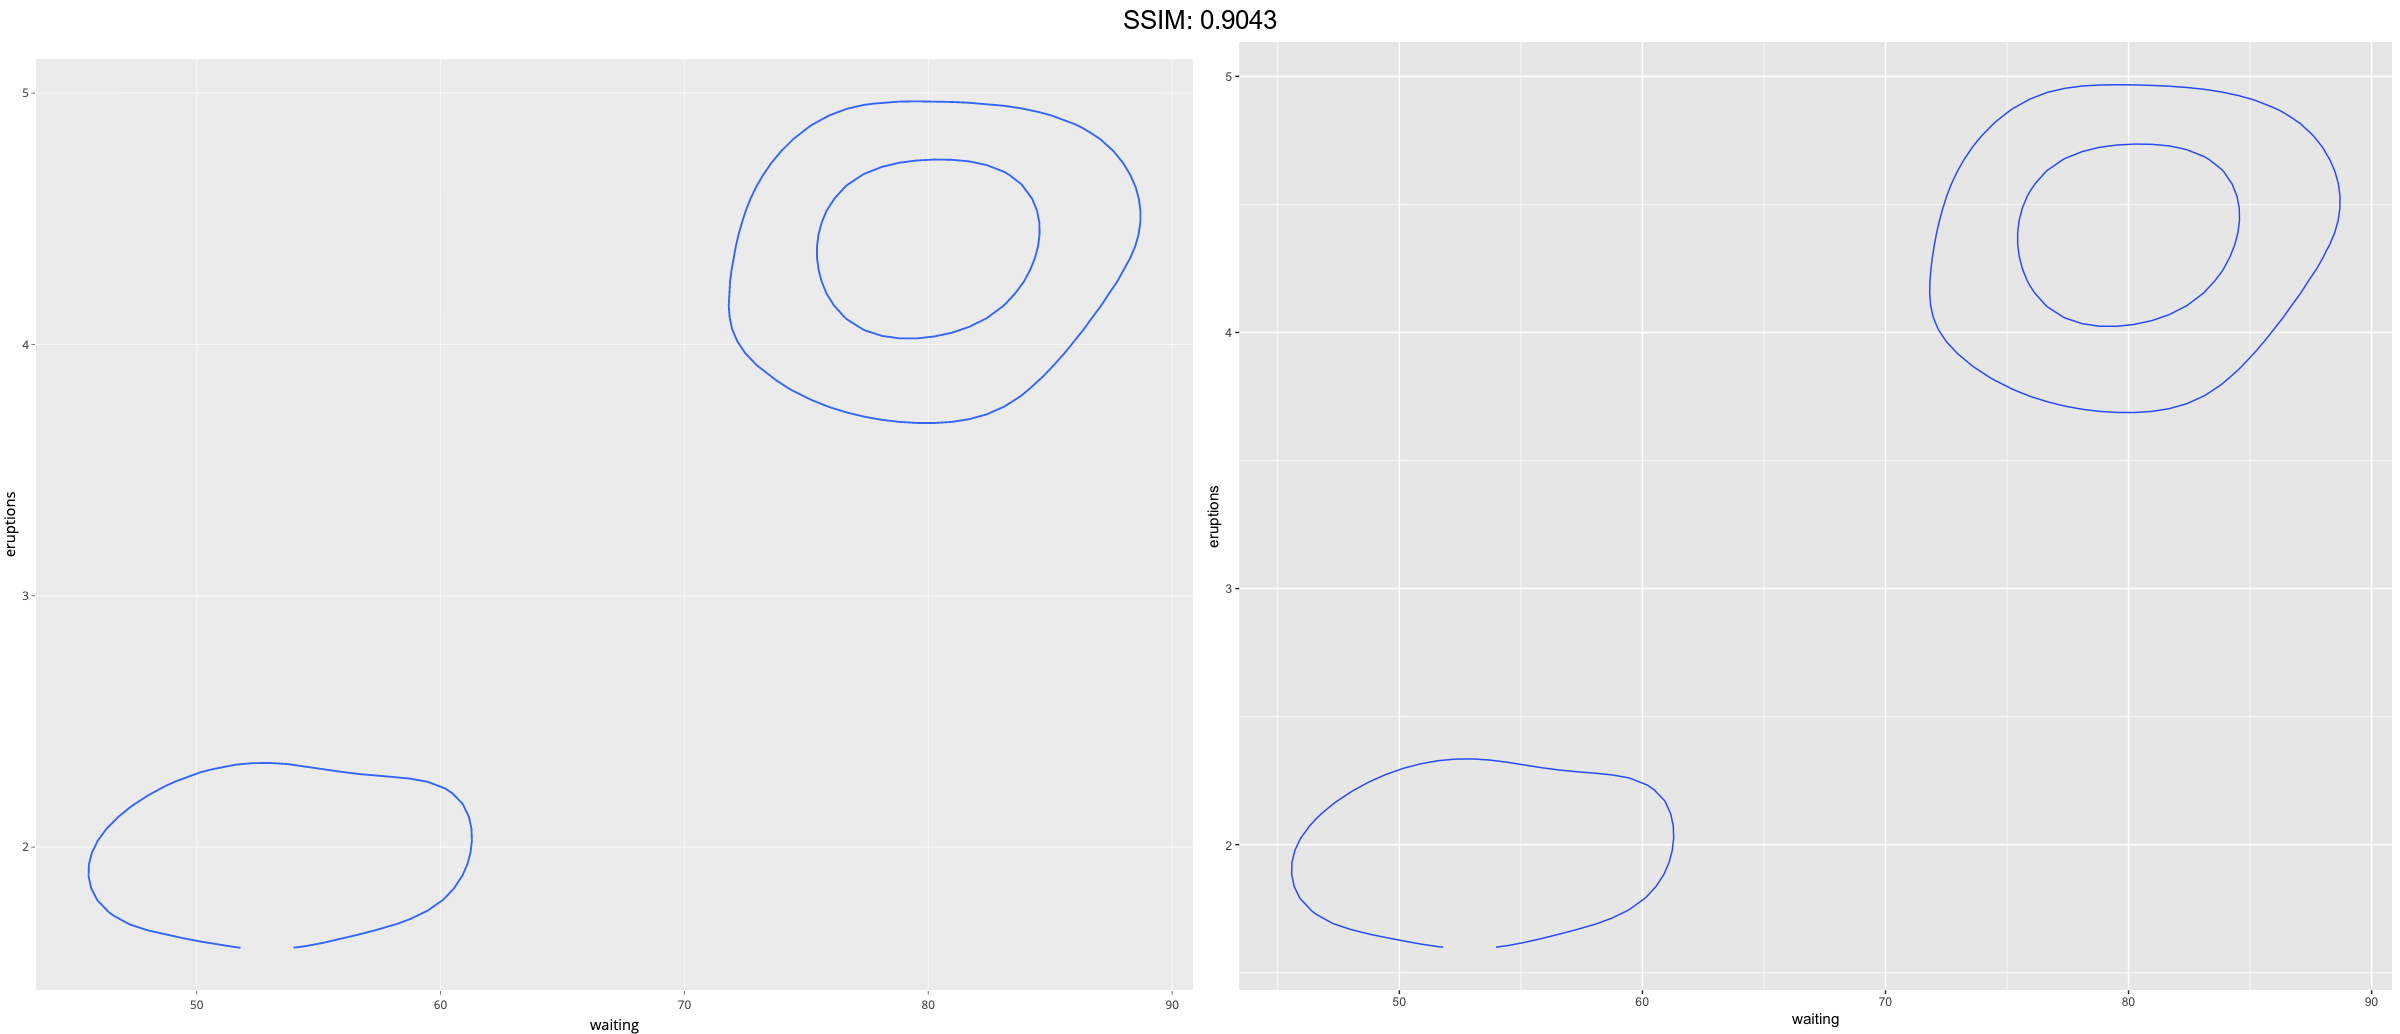
v <- ggplot(faithfuld, aes(waiting, eruptions, z = density))
p <-  v + geom_contour(bins = 3)
plotly::ggplotly(p)

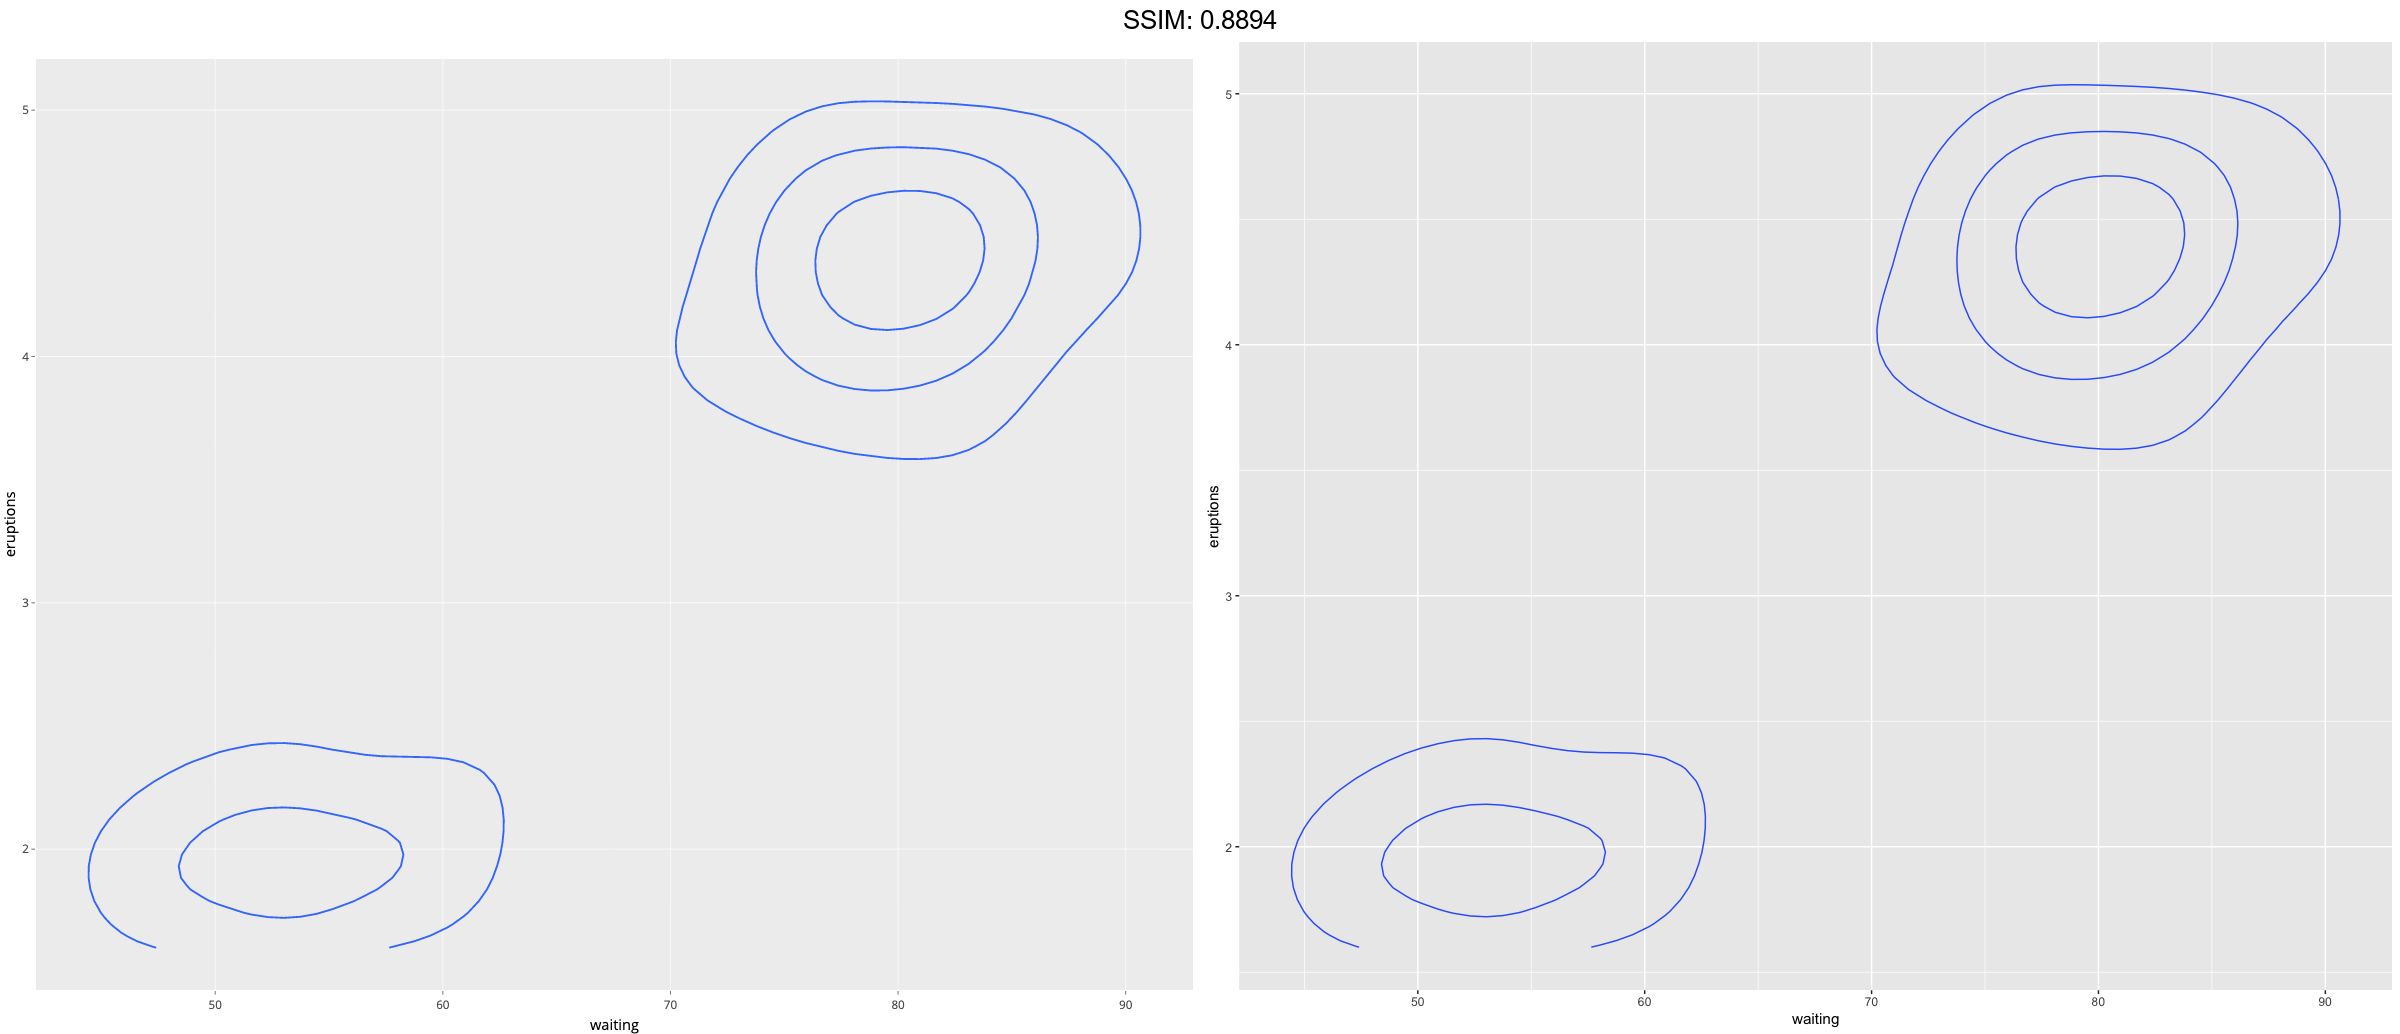
v <- ggplot(faithfuld, aes(waiting, eruptions, z = density))
p <-  v + geom_contour(bins = 5)
plotly::ggplotly(p)


v <- ggplot(faithfuld, aes(waiting, eruptions, z = density))
p <-  v + geom_contour(binwidth = 0.01)
plotly::ggplotly(p)

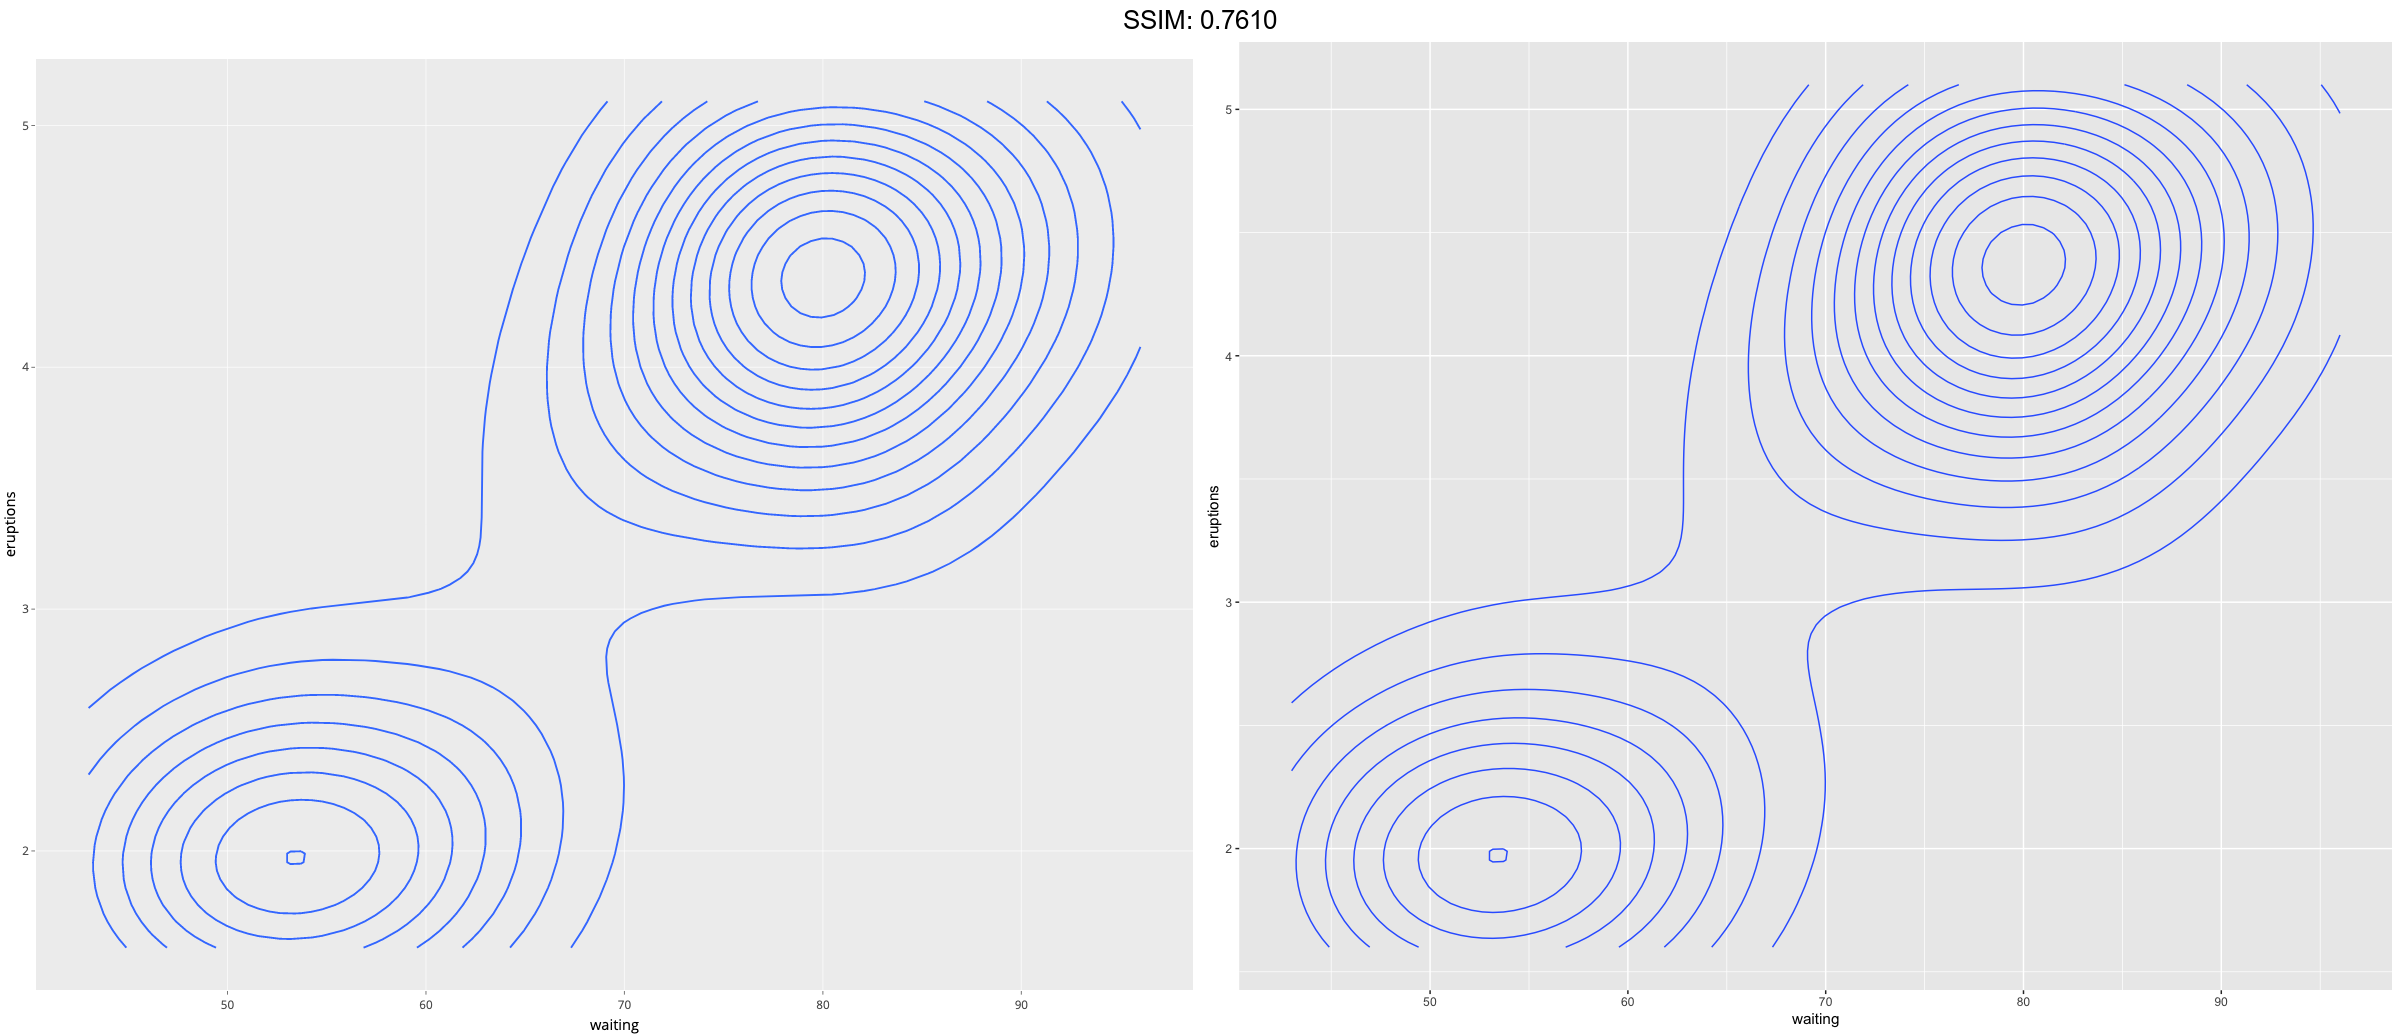
v <- ggplot(faithfuld, aes(waiting, eruptions, z = density))
p <-  v + geom_contour(binwidth = 0.001)
plotly::ggplotly(p)

v <- ggplot(faithfuld, aes(waiting, eruptions, z = density))
p <-  v + geom_contour(aes(colour = after_stat(level)))
plotly::ggplotly(p)


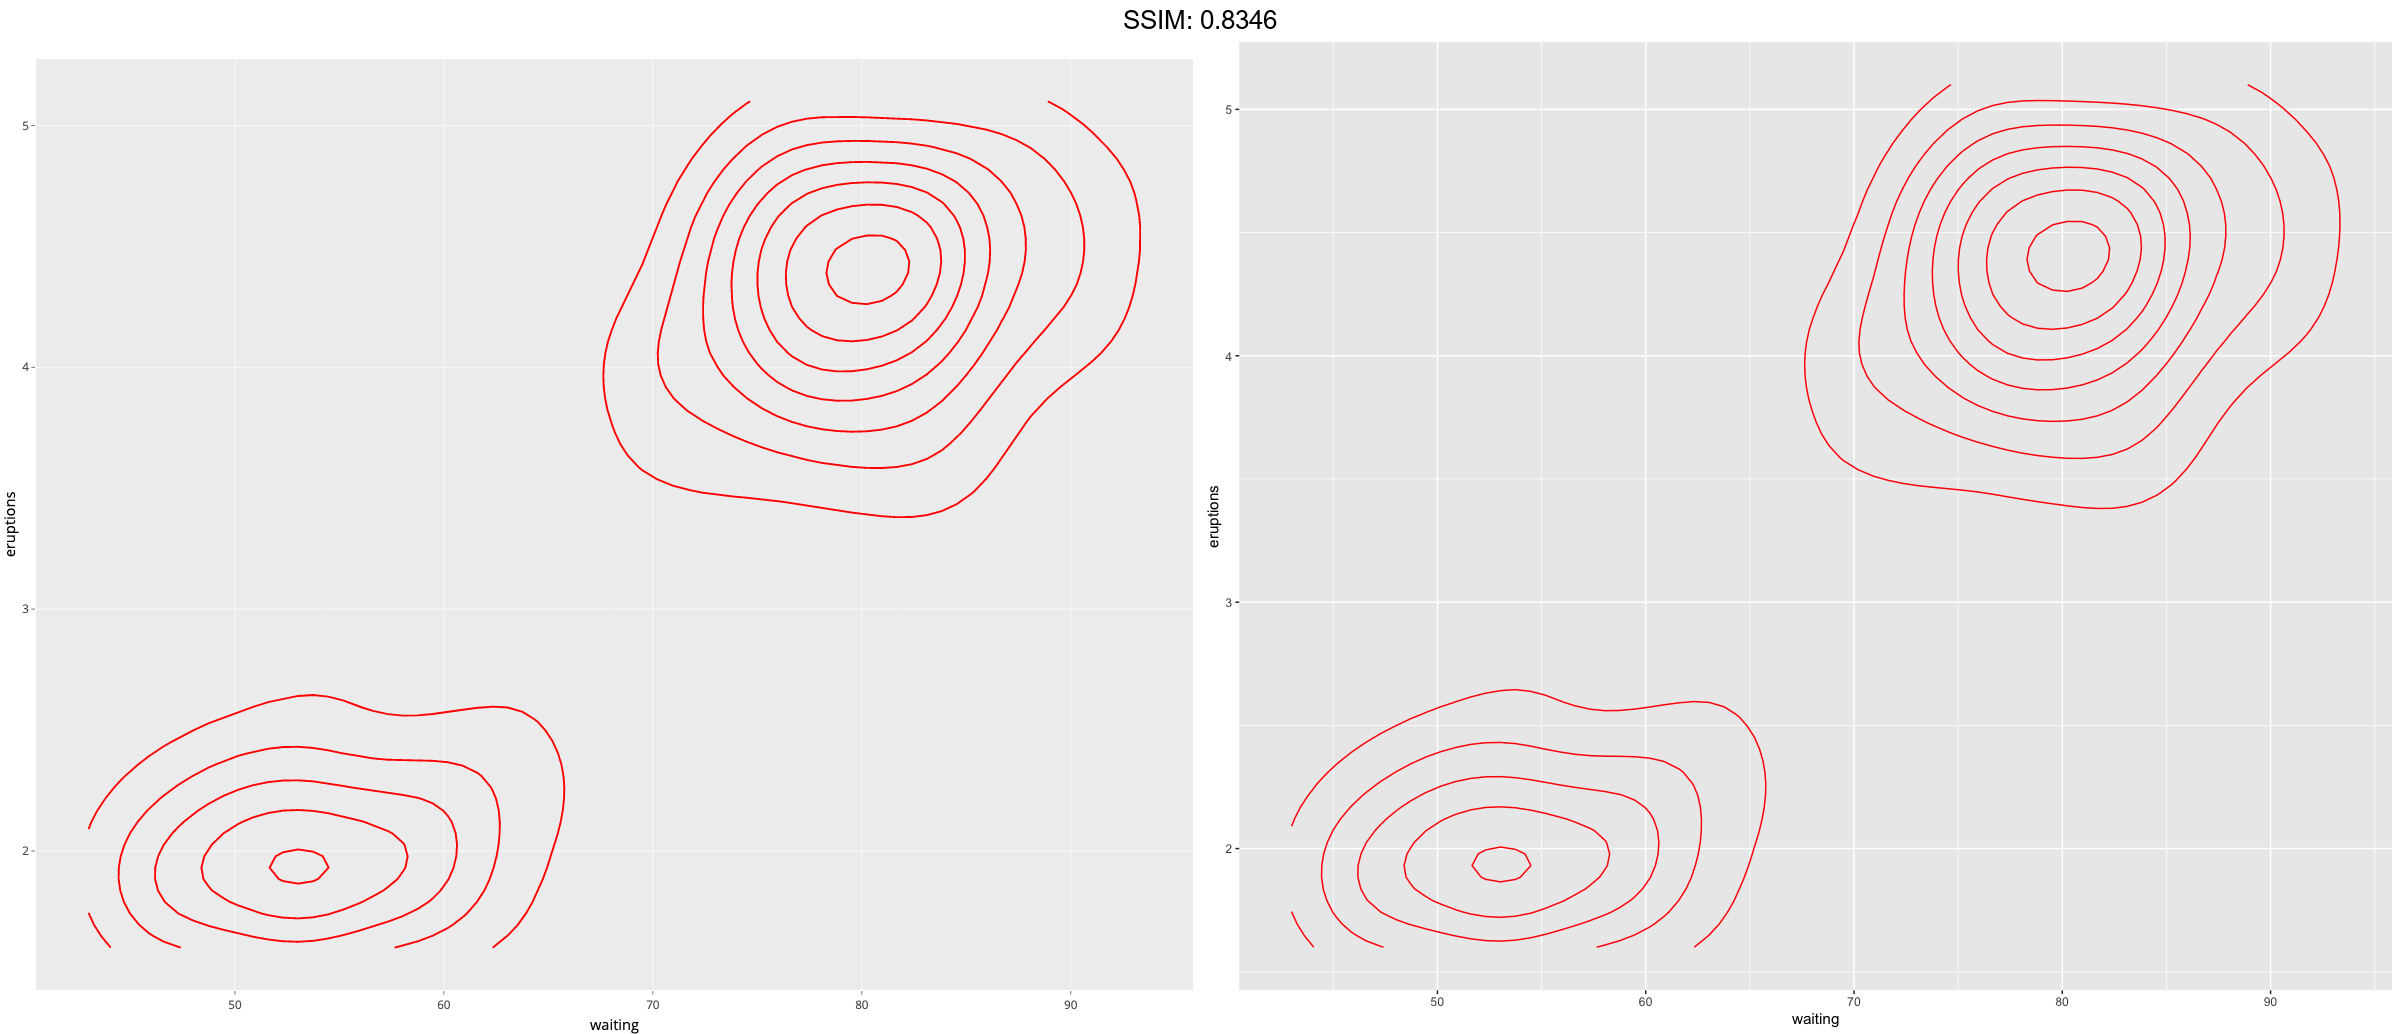
v <- ggplot(faithfuld, aes(waiting, eruptions, z = density))
p <-  v + geom_contour(colour = "red")
plotly::ggplotly(p)

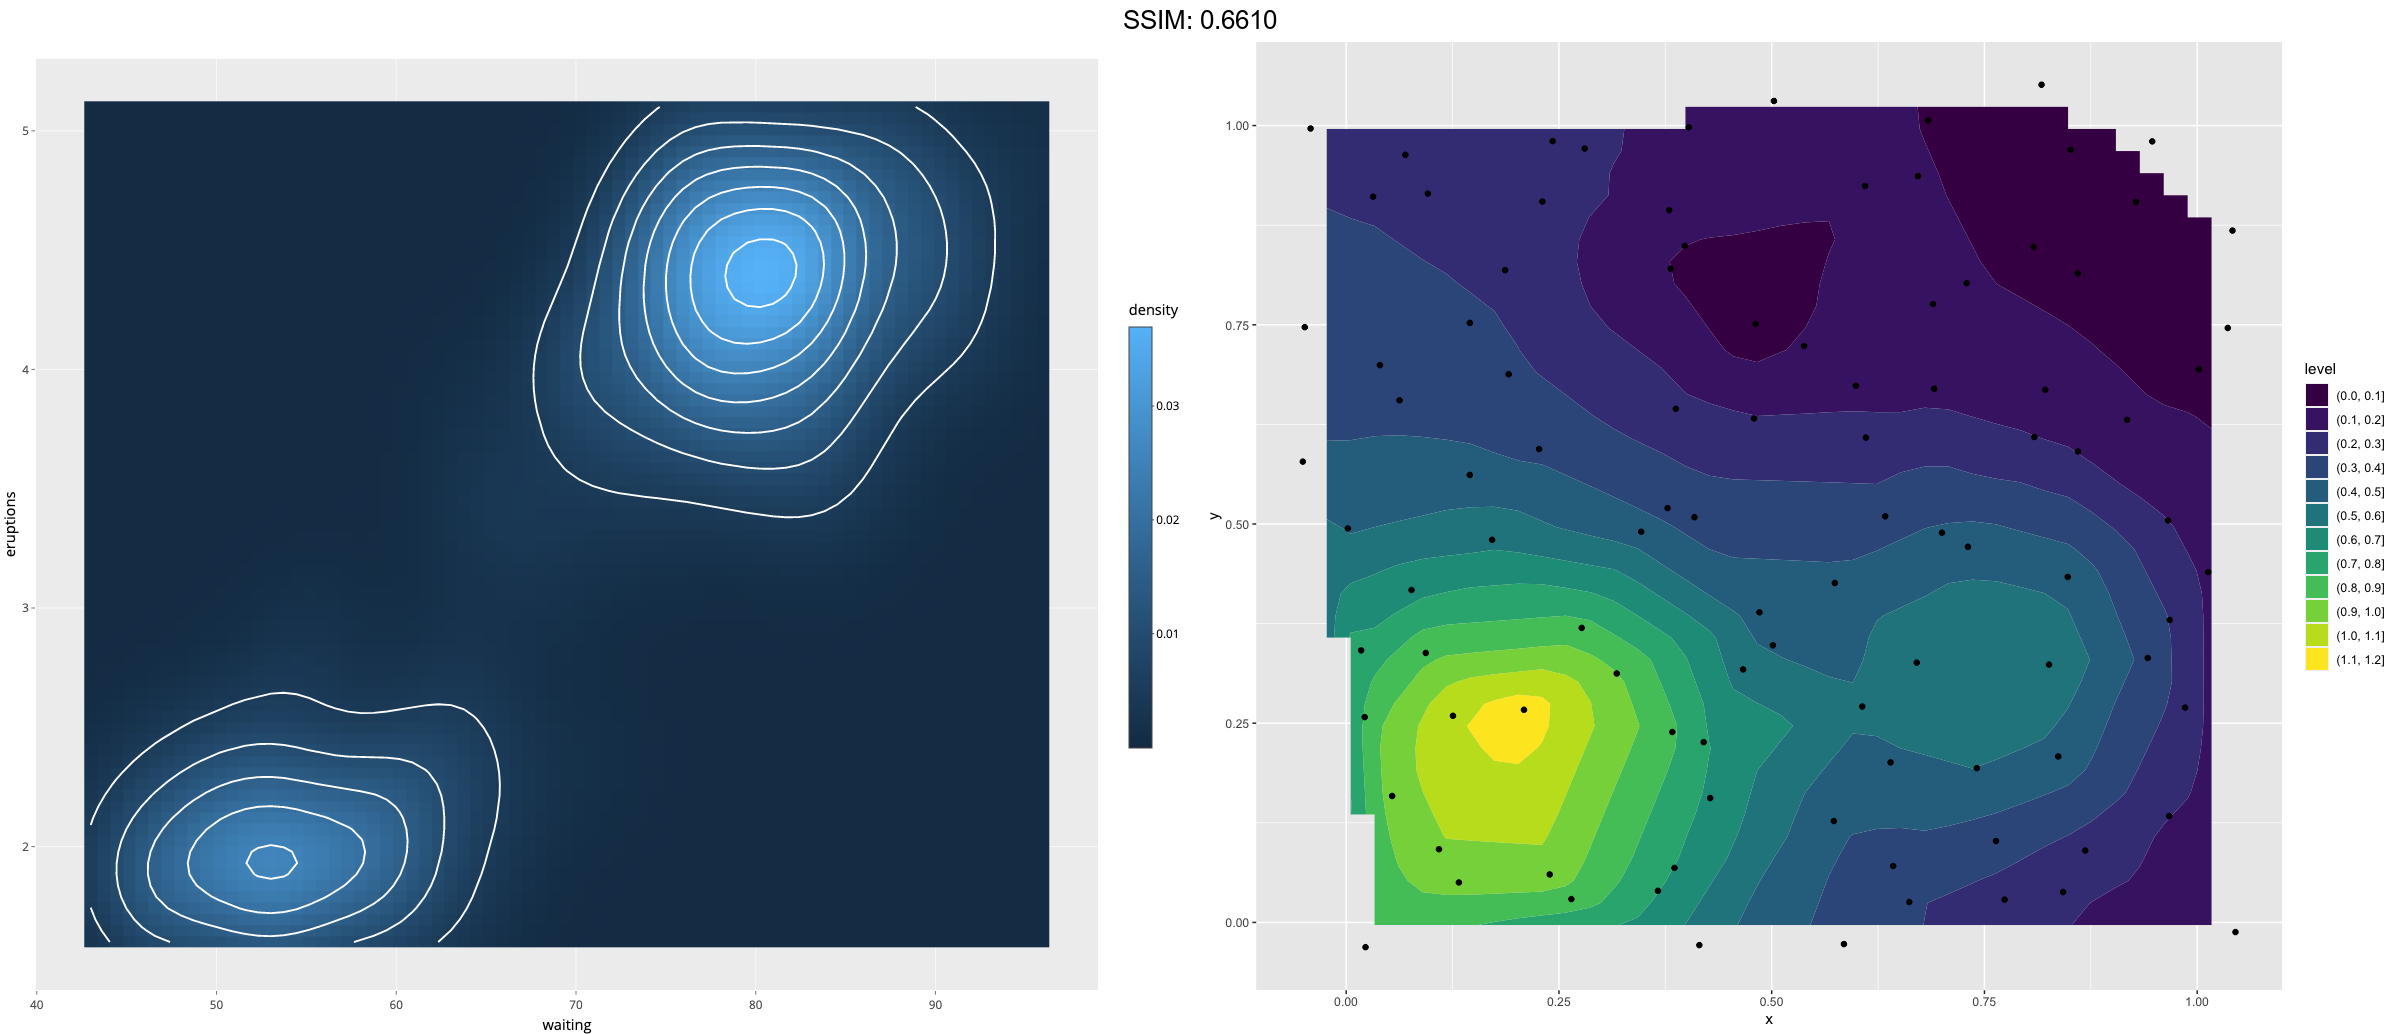
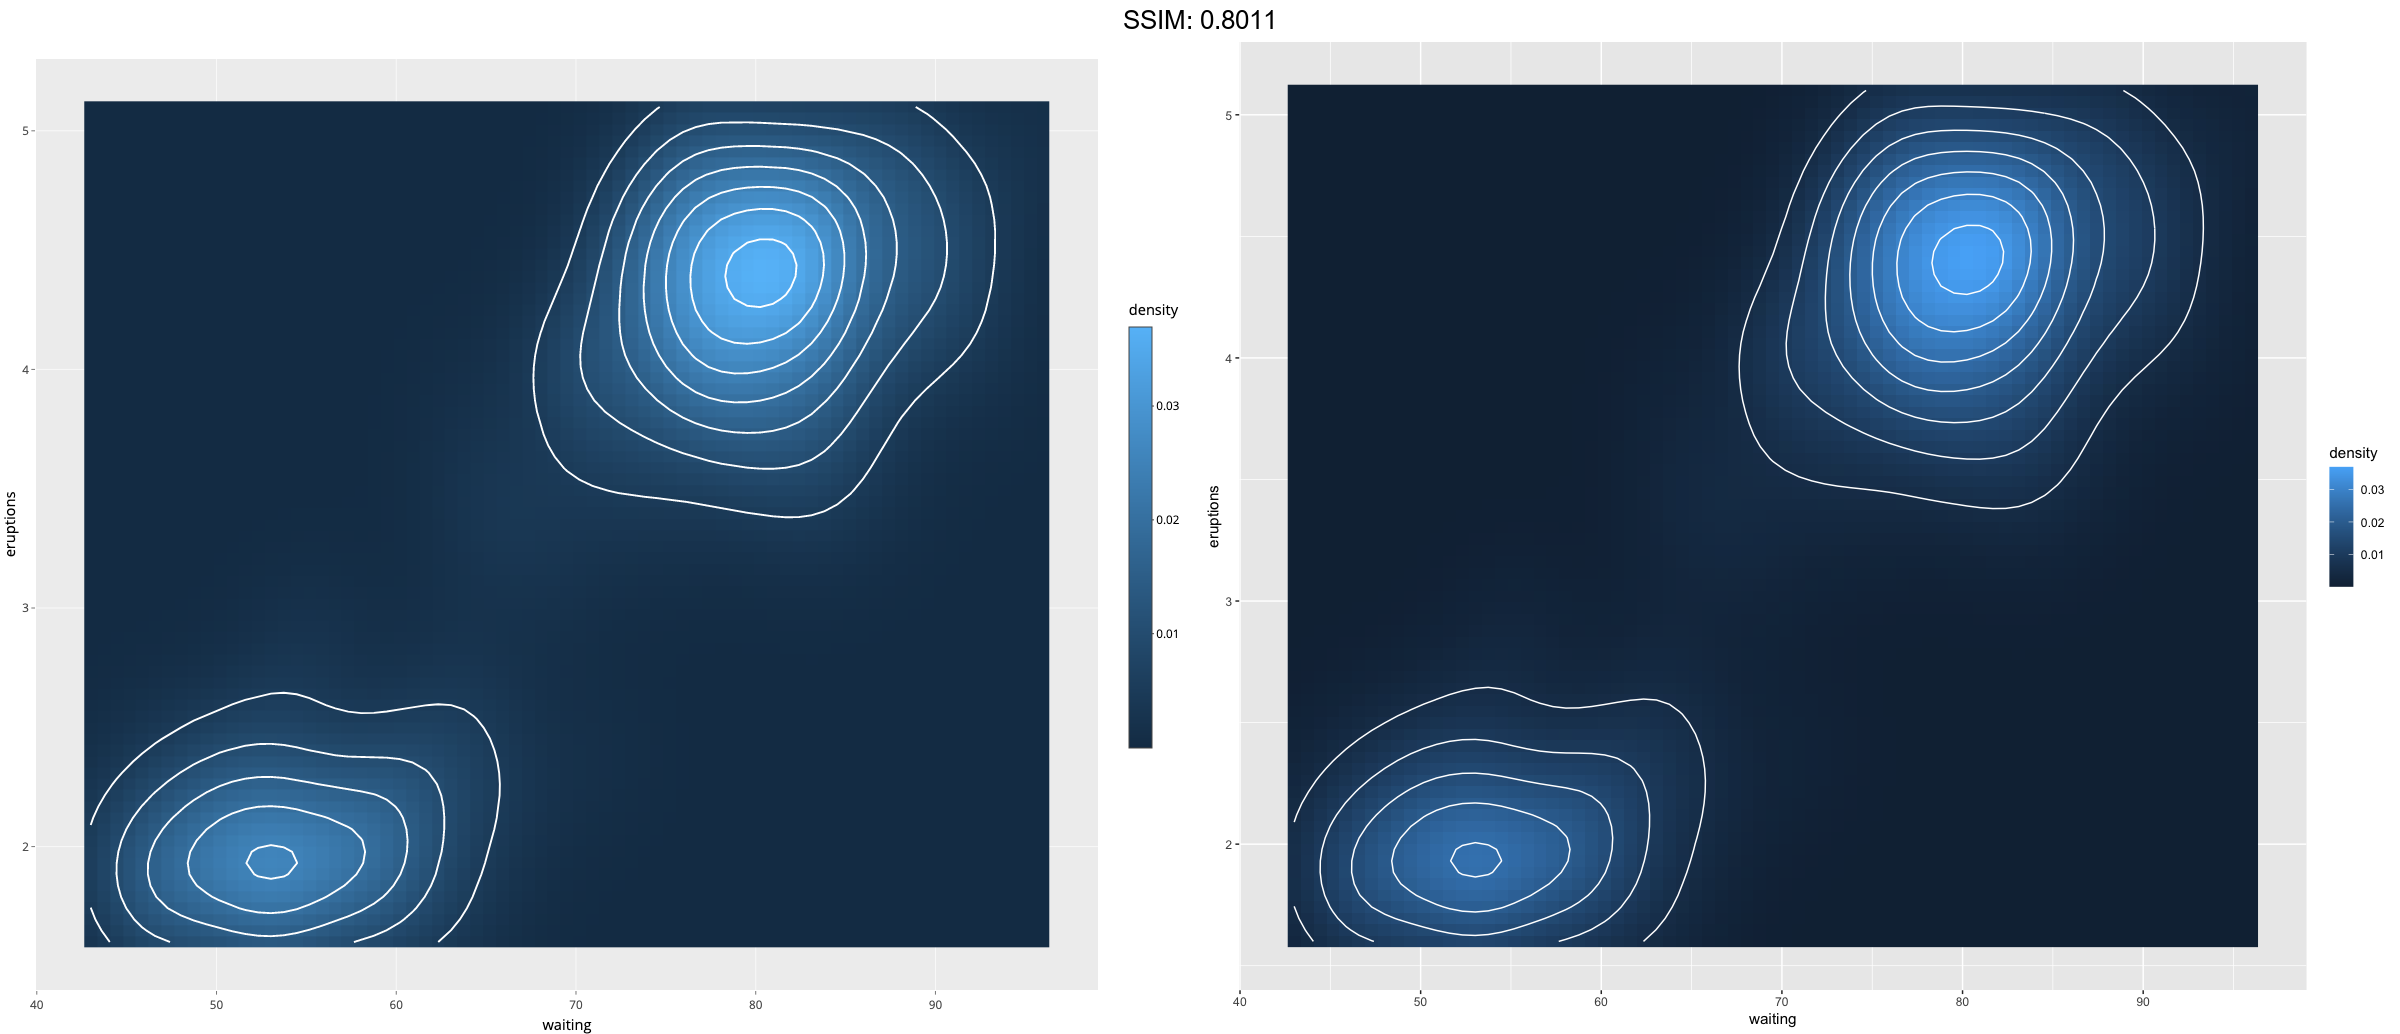
v <- ggplot(faithfuld, aes(waiting, eruptions, z = density))
p <-
 v + geom_raster(aes(fill = density)) +
  geom_contour(colour = "white")
plotly::ggplotly(p)

p <-
 if (requireNamespace("interp")) {
  # Use a dataset from the interp package
  data(franke, package = "interp")
  origdata <- as.data.frame(interp::franke.data(1, 1, franke))
  grid <- with(origdata, interp::interp(x, y, z))
  griddf <- subset(data.frame(x = rep(grid$x, nrow(grid$z)),
                              y = rep(grid$y, each = ncol(grid$z)),
                              z = as.numeric(grid$z)),
                   !is.na(z))
  ggplot(griddf, aes(x, y, z = z)) +
    geom_contour_filled() +
    geom_point(data = origdata)
} else
  message("Irregular data requires the 'interp' package")
plotly::ggplotly(p)
## Warning in geom2trace.default(dots[[1L]][[12L]], dots[[2L]][[1L]], dots[[3L]][[1L]]): geom_GeomContourFilled() has yet to be implemented in plotly.
##   If you'd like to see this geom implemented,
##   Please open an issue with your example code at
##   https://github.com/ropensci/plotly/issues

## Warning in geom2trace.default(dots[[1L]][[12L]], dots[[2L]][[1L]], dots[[3L]][[1L]]): geom_GeomContourFilled() has yet to be implemented in plotly.
##   If you'd like to see this geom implemented,
##   Please open an issue with your example code at
##   https://github.com/ropensci/plotly/issues

## Warning in geom2trace.default(dots[[1L]][[12L]], dots[[2L]][[1L]], dots[[3L]][[1L]]): geom_GeomContourFilled() has yet to be implemented in plotly.
##   If you'd like to see this geom implemented,
##   Please open an issue with your example code at
##   https://github.com/ropensci/plotly/issues

## Warning in geom2trace.default(dots[[1L]][[12L]], dots[[2L]][[1L]], dots[[3L]][[1L]]): geom_GeomContourFilled() has yet to be implemented in plotly.
##   If you'd like to see this geom implemented,
##   Please open an issue with your example code at
##   https://github.com/ropensci/plotly/issues

## Warning in geom2trace.default(dots[[1L]][[12L]], dots[[2L]][[1L]], dots[[3L]][[1L]]): geom_GeomContourFilled() has yet to be implemented in plotly.
##   If you'd like to see this geom implemented,
##   Please open an issue with your example code at
##   https://github.com/ropensci/plotly/issues

## Warning in geom2trace.default(dots[[1L]][[12L]], dots[[2L]][[1L]], dots[[3L]][[1L]]): geom_GeomContourFilled() has yet to be implemented in plotly.
##   If you'd like to see this geom implemented,
##   Please open an issue with your example code at
##   https://github.com/ropensci/plotly/issues

## Warning in geom2trace.default(dots[[1L]][[12L]], dots[[2L]][[1L]], dots[[3L]][[1L]]): geom_GeomContourFilled() has yet to be implemented in plotly.
##   If you'd like to see this geom implemented,
##   Please open an issue with your example code at
##   https://github.com/ropensci/plotly/issues

## Warning in geom2trace.default(dots[[1L]][[12L]], dots[[2L]][[1L]], dots[[3L]][[1L]]): geom_GeomContourFilled() has yet to be implemented in plotly.
##   If you'd like to see this geom implemented,
##   Please open an issue with your example code at
##   https://github.com/ropensci/plotly/issues

## Warning in geom2trace.default(dots[[1L]][[12L]], dots[[2L]][[1L]], dots[[3L]][[1L]]): geom_GeomContourFilled() has yet to be implemented in plotly.
##   If you'd like to see this geom implemented,
##   Please open an issue with your example code at
##   https://github.com/ropensci/plotly/issues

## Warning in geom2trace.default(dots[[1L]][[12L]], dots[[2L]][[1L]], dots[[3L]][[1L]]): geom_GeomContourFilled() has yet to be implemented in plotly.
##   If you'd like to see this geom implemented,
##   Please open an issue with your example code at
##   https://github.com/ropensci/plotly/issues

## Warning in geom2trace.default(dots[[1L]][[12L]], dots[[2L]][[1L]], dots[[3L]][[1L]]): geom_GeomContourFilled() has yet to be implemented in plotly.
##   If you'd like to see this geom implemented,
##   Please open an issue with your example code at
##   https://github.com/ropensci/plotly/issues

## Warning in geom2trace.default(dots[[1L]][[12L]], dots[[2L]][[1L]], dots[[3L]][[1L]]): geom_GeomContourFilled() has yet to be implemented in plotly.
##   If you'd like to see this geom implemented,
##   Please open an issue with your example code at
##   https://github.com/ropensci/plotly/issues