GGPLOT - geom_abline
Add reference lines to a plot, either horizontal, vertical, or diagonal and then convert them with ggplotly.
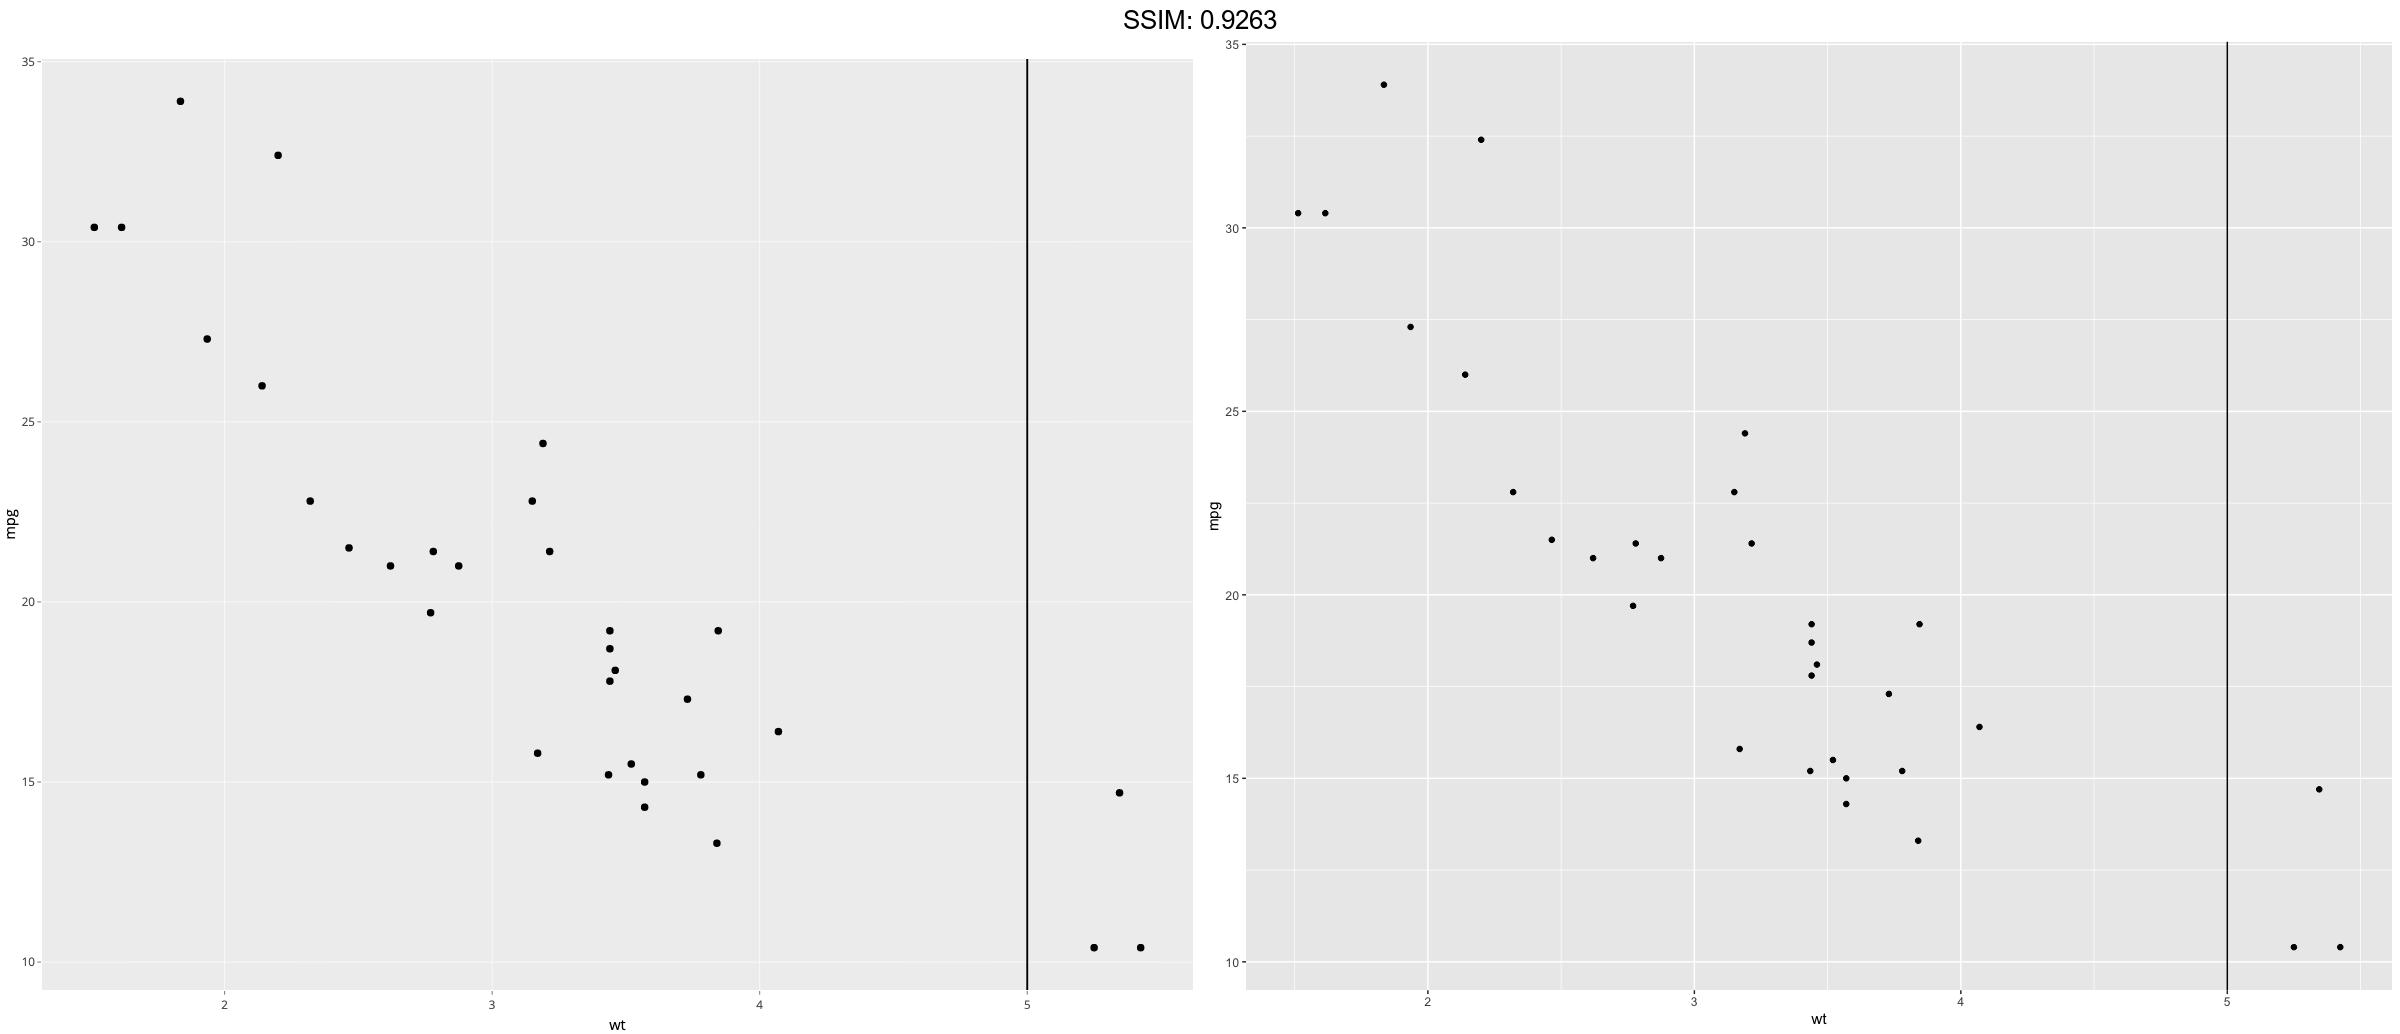
p <- ggplot(mtcars, aes(wt, mpg)) + geom_point()
p <-  p + geom_vline(xintercept = 5)
plotly::ggplotly(p)


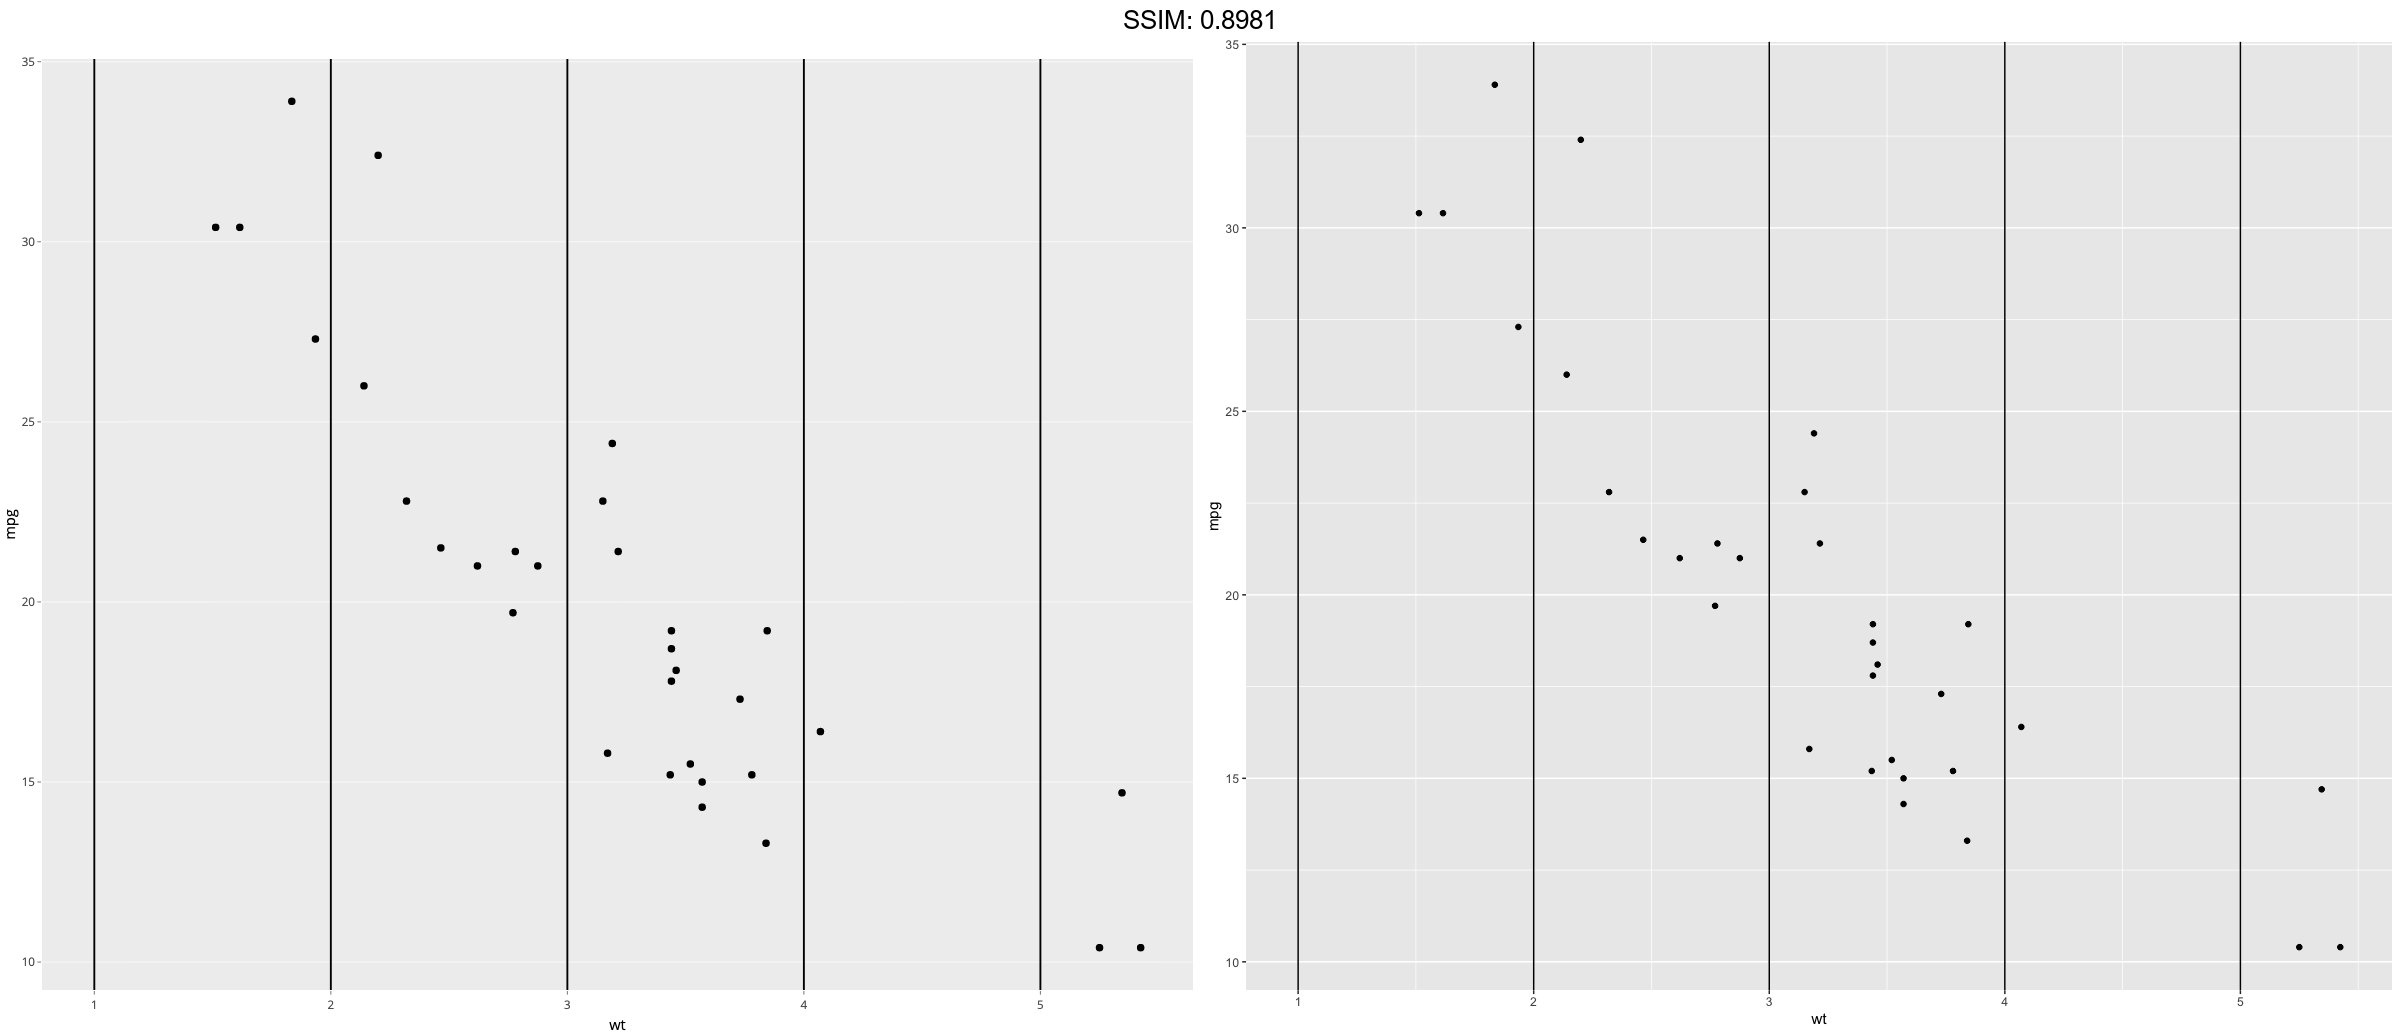
p <- ggplot(mtcars, aes(wt, mpg)) + geom_point()
p <-  p + geom_vline(xintercept = 1:5)
plotly::ggplotly(p)

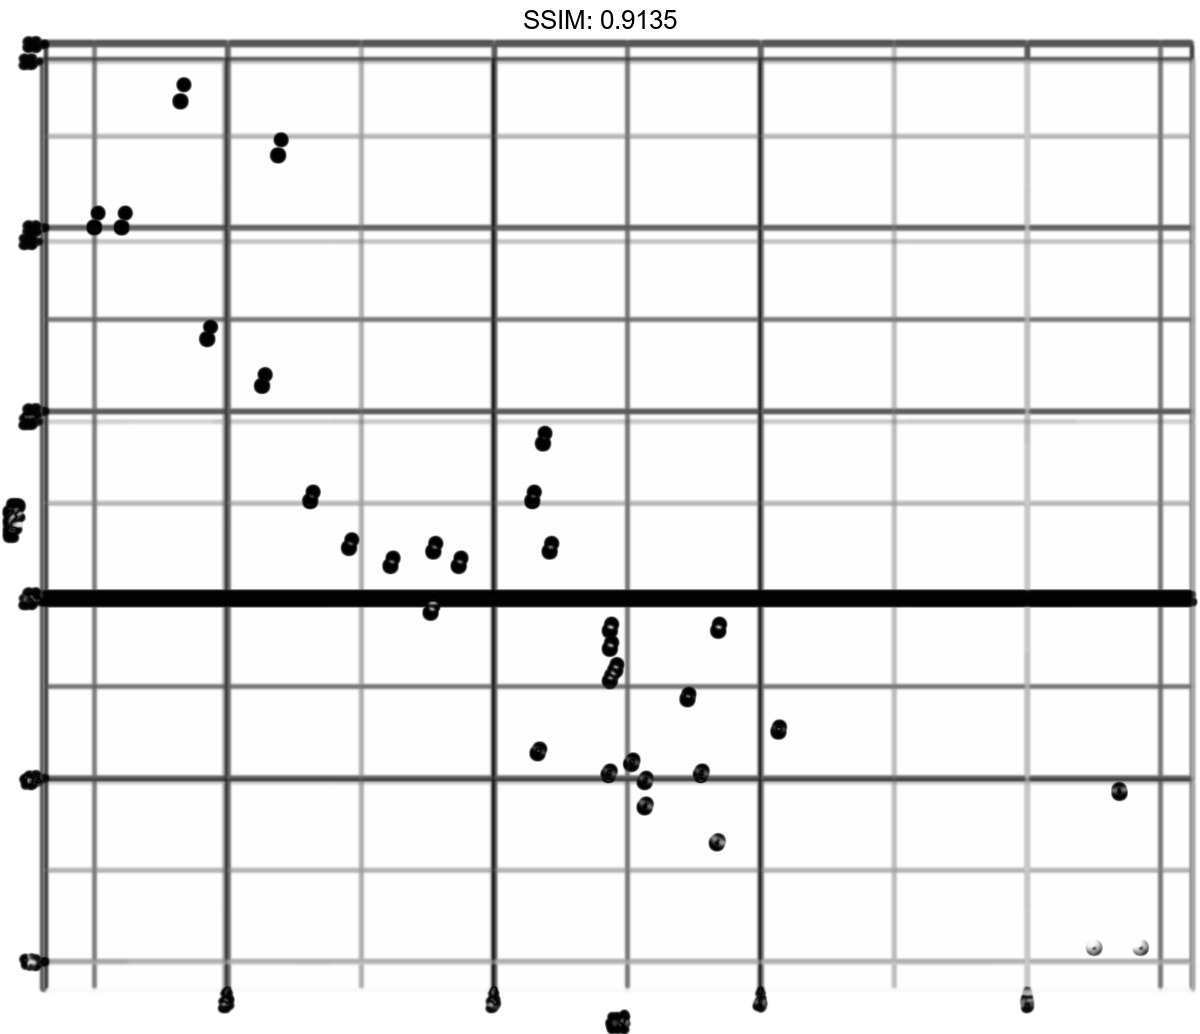
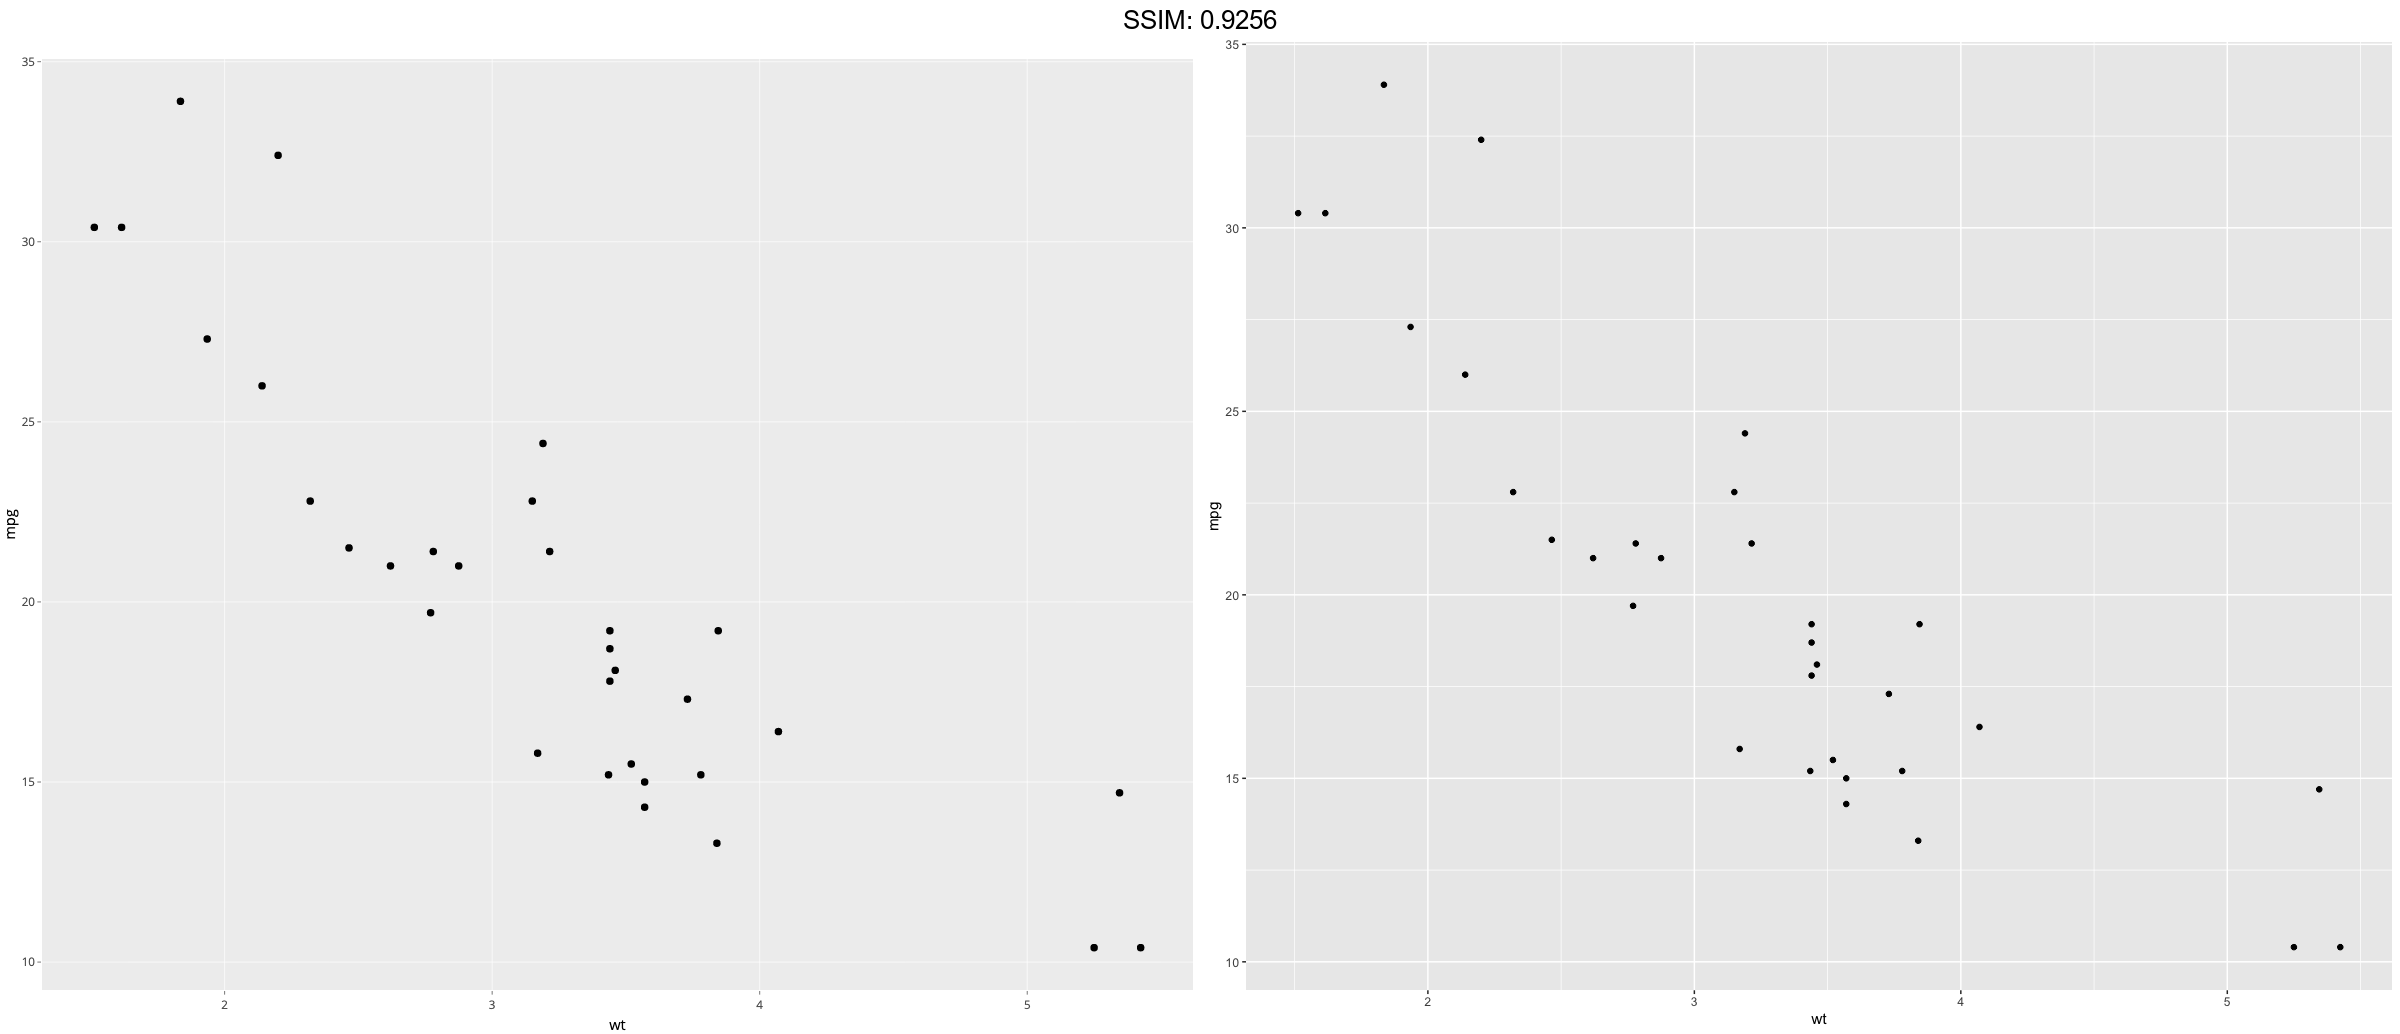
p <- ggplot(mtcars, aes(wt, mpg)) + geom_point()
p <-  p + geom_hline(yintercept = 20)
plotly::ggplotly(p)

p <- ggplot(mtcars, aes(wt, mpg)) + geom_point()
p <-  p + geom_abline() # Can't see it - outside the range of the data
plotly::ggplotly(p)
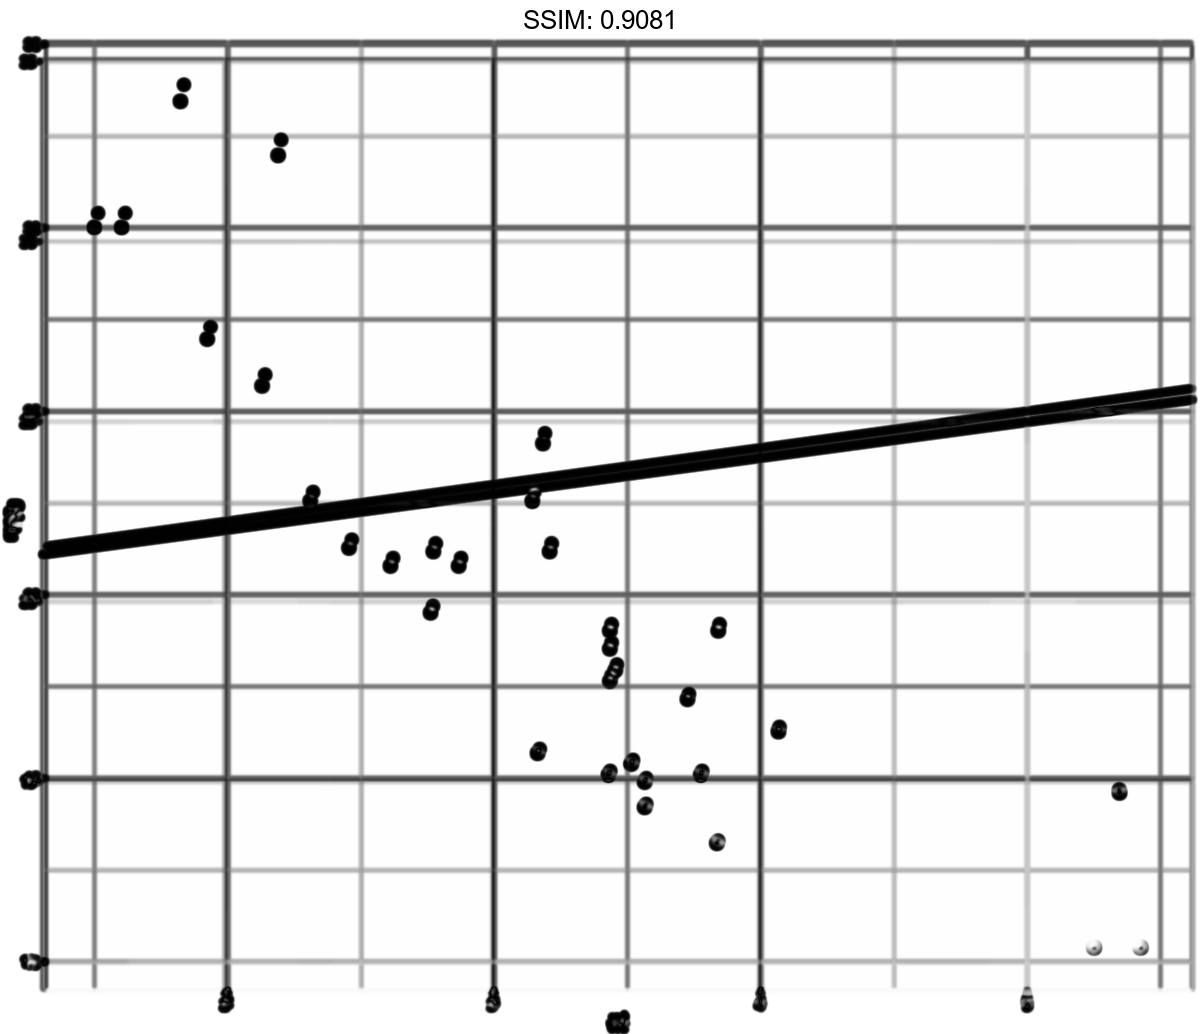
p <- ggplot(mtcars, aes(wt, mpg)) + geom_point()
p <-  p + geom_abline(intercept = 20)
plotly::ggplotly(p)
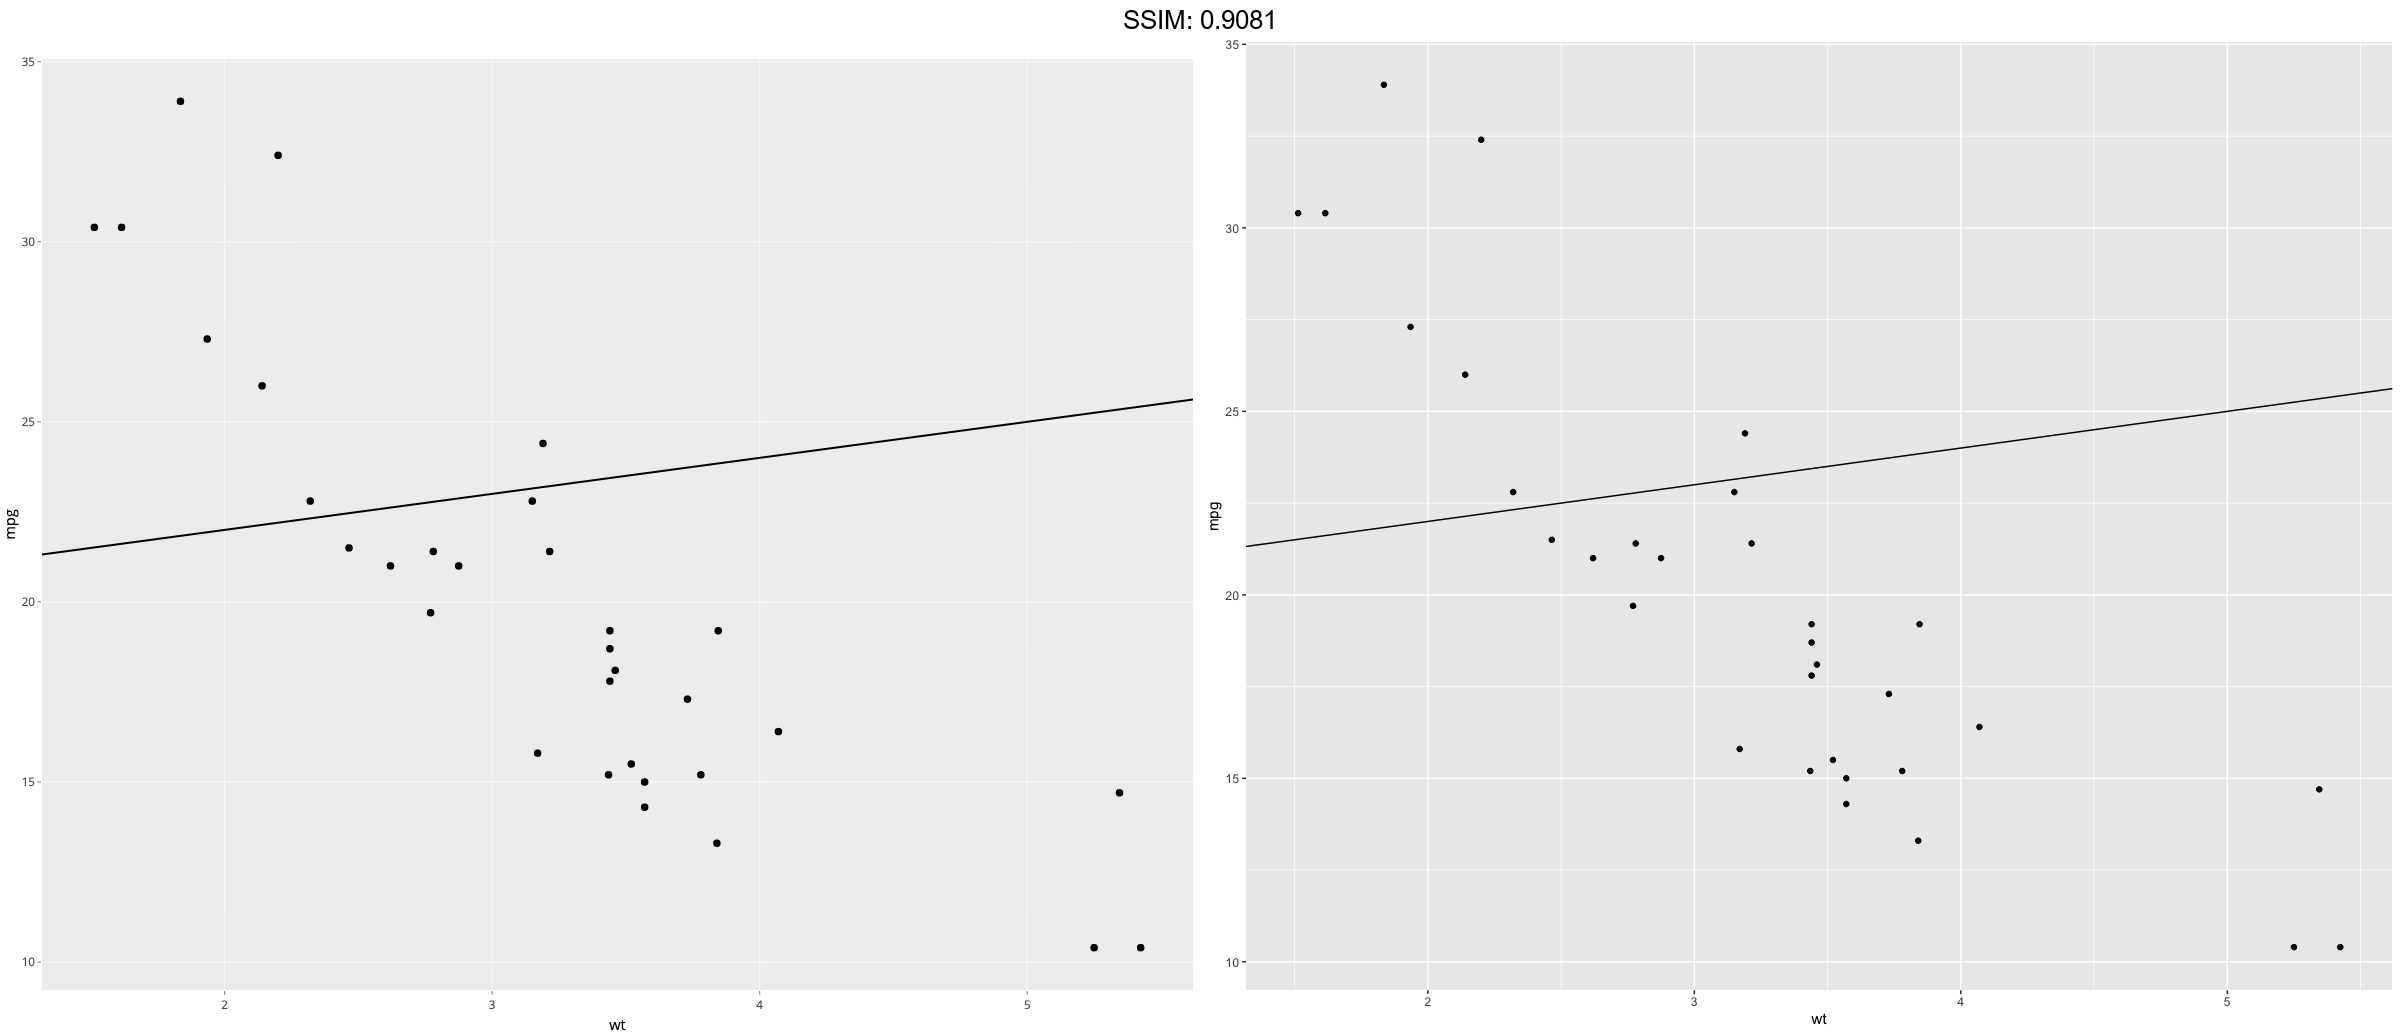
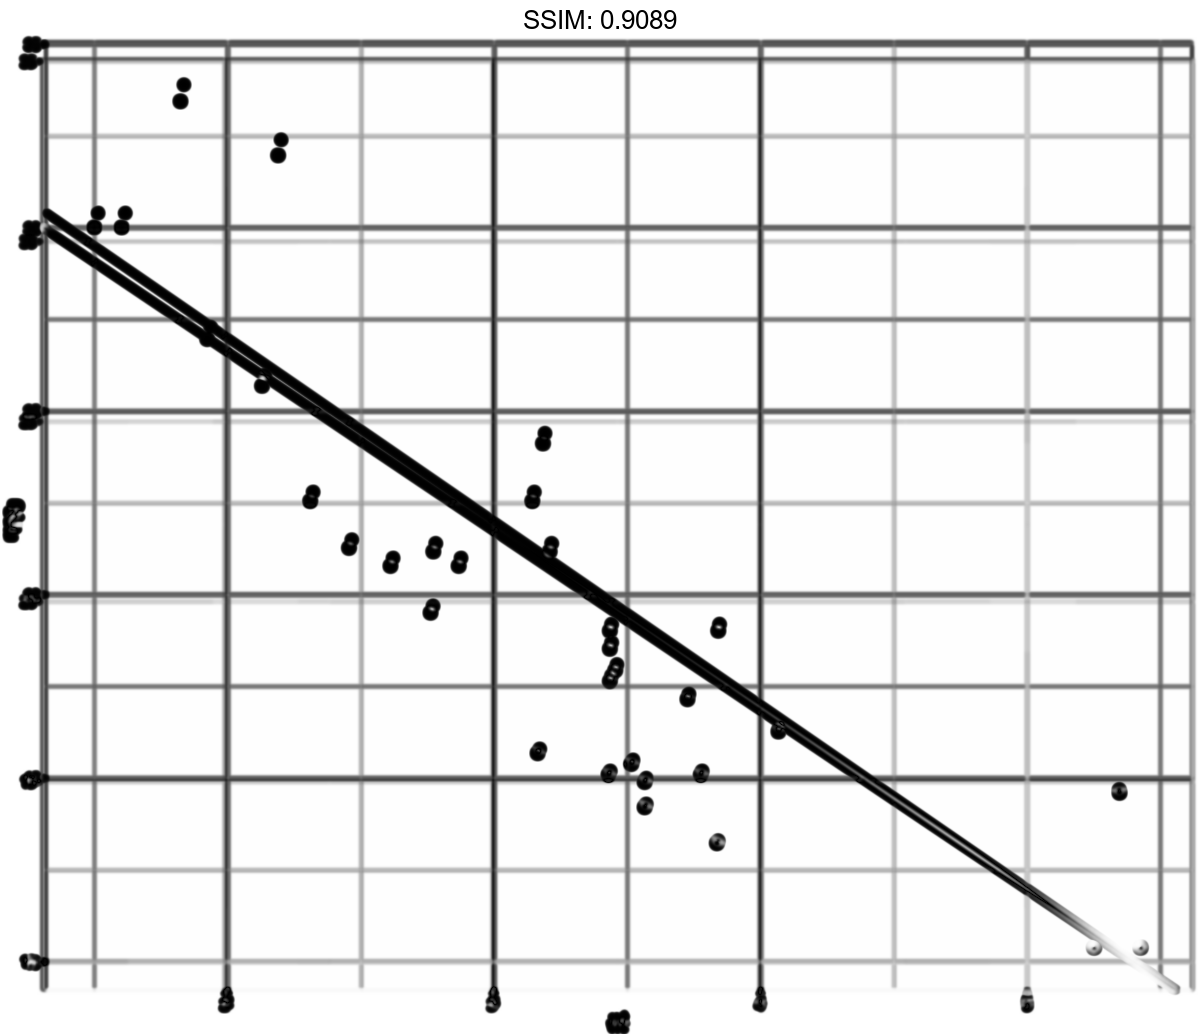
p <- ggplot(mtcars, aes(wt, mpg)) + geom_point()
coef(lm(mpg ~ wt, data = mtcars))
p <-  p + geom_abline(intercept = 37, slope = -5)
plotly::ggplotly(p)

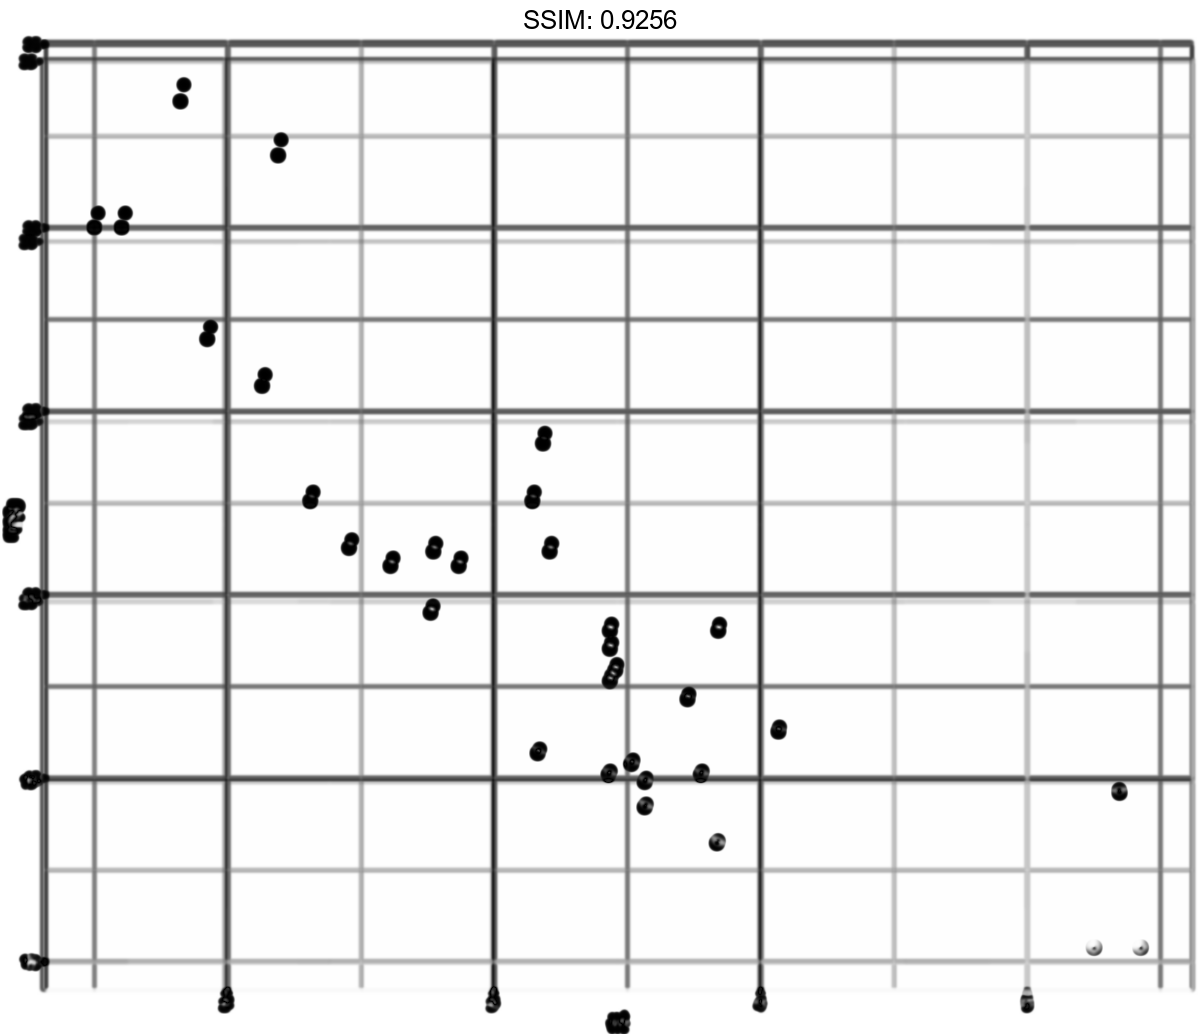
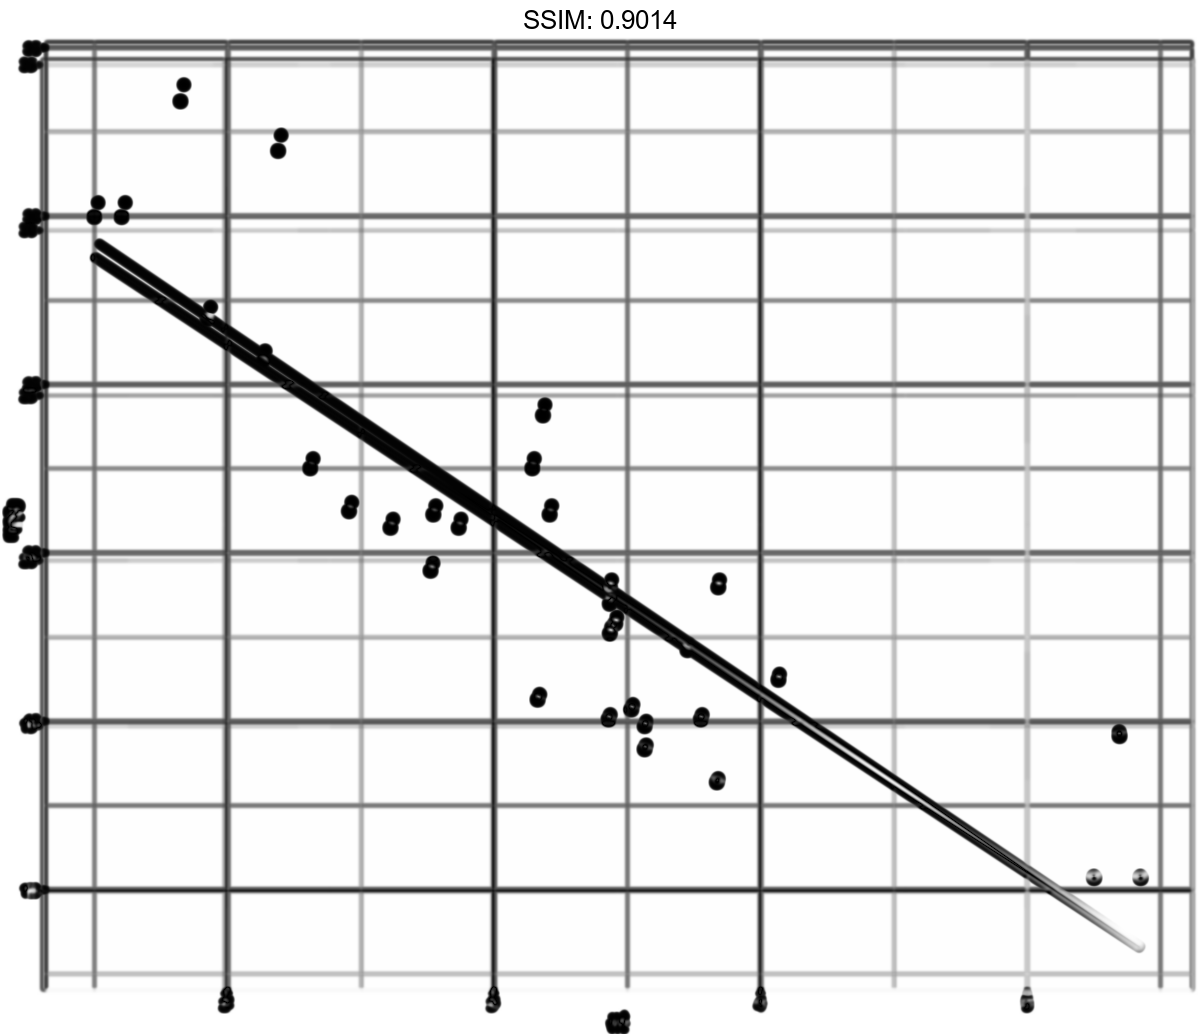
p <- ggplot(mtcars, aes(wt, mpg)) + geom_point()
p <-  p + geom_smooth(method = "lm", se = FALSE)
plotly::ggplotly(p)
## `geom_smooth()` using formula 'y ~ x'

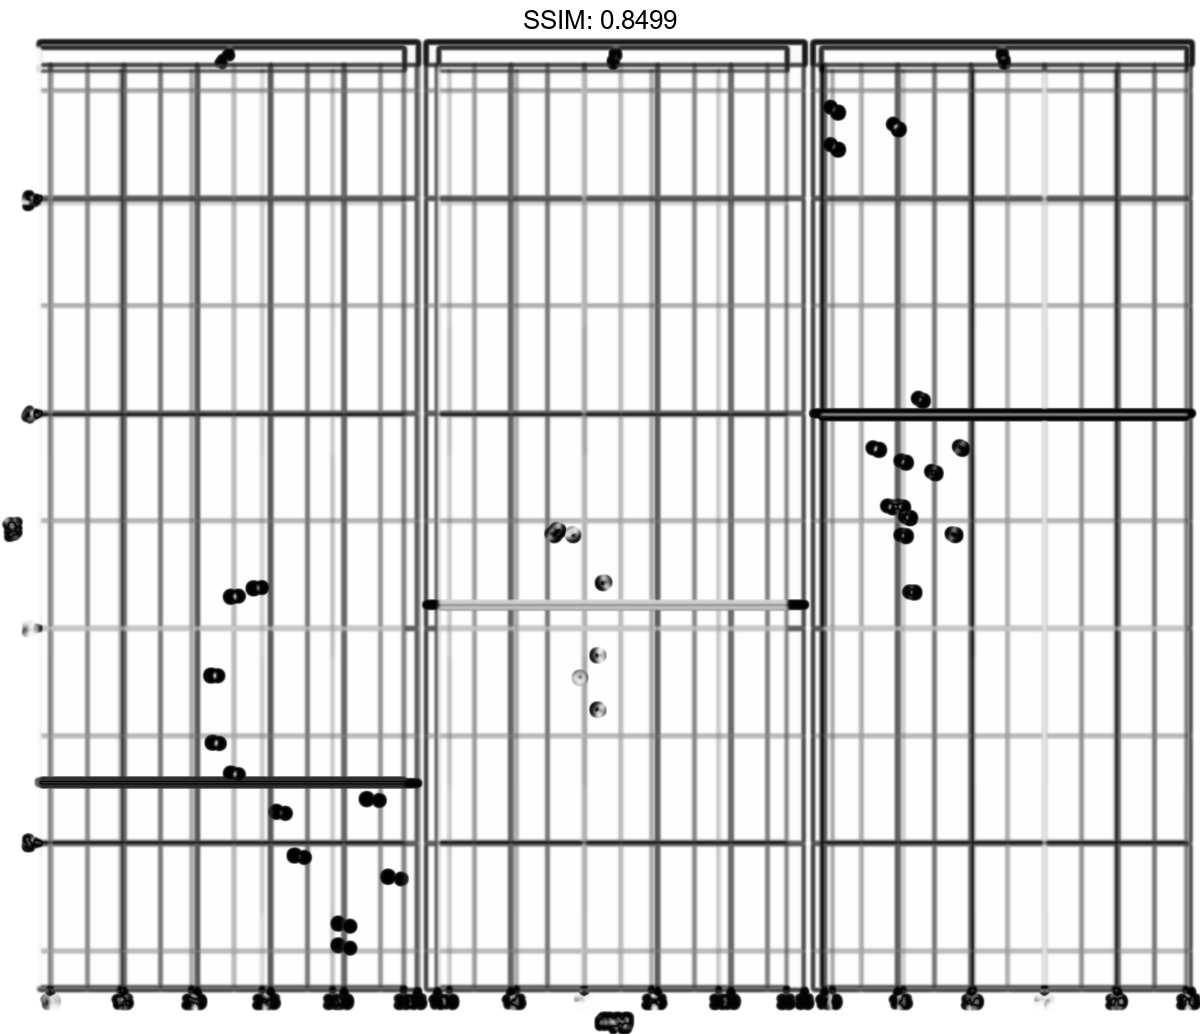
p <- ggplot(mtcars, aes(mpg, wt)) +
  geom_point() +
  facet_wrap(~ cyl)
mean_wt <- data.frame(cyl = c(4, 6, 8), wt = c(2.28, 3.11, 4.00))
p <-  p + geom_hline(aes(yintercept = wt), mean_wt)
plotly::ggplotly(p)

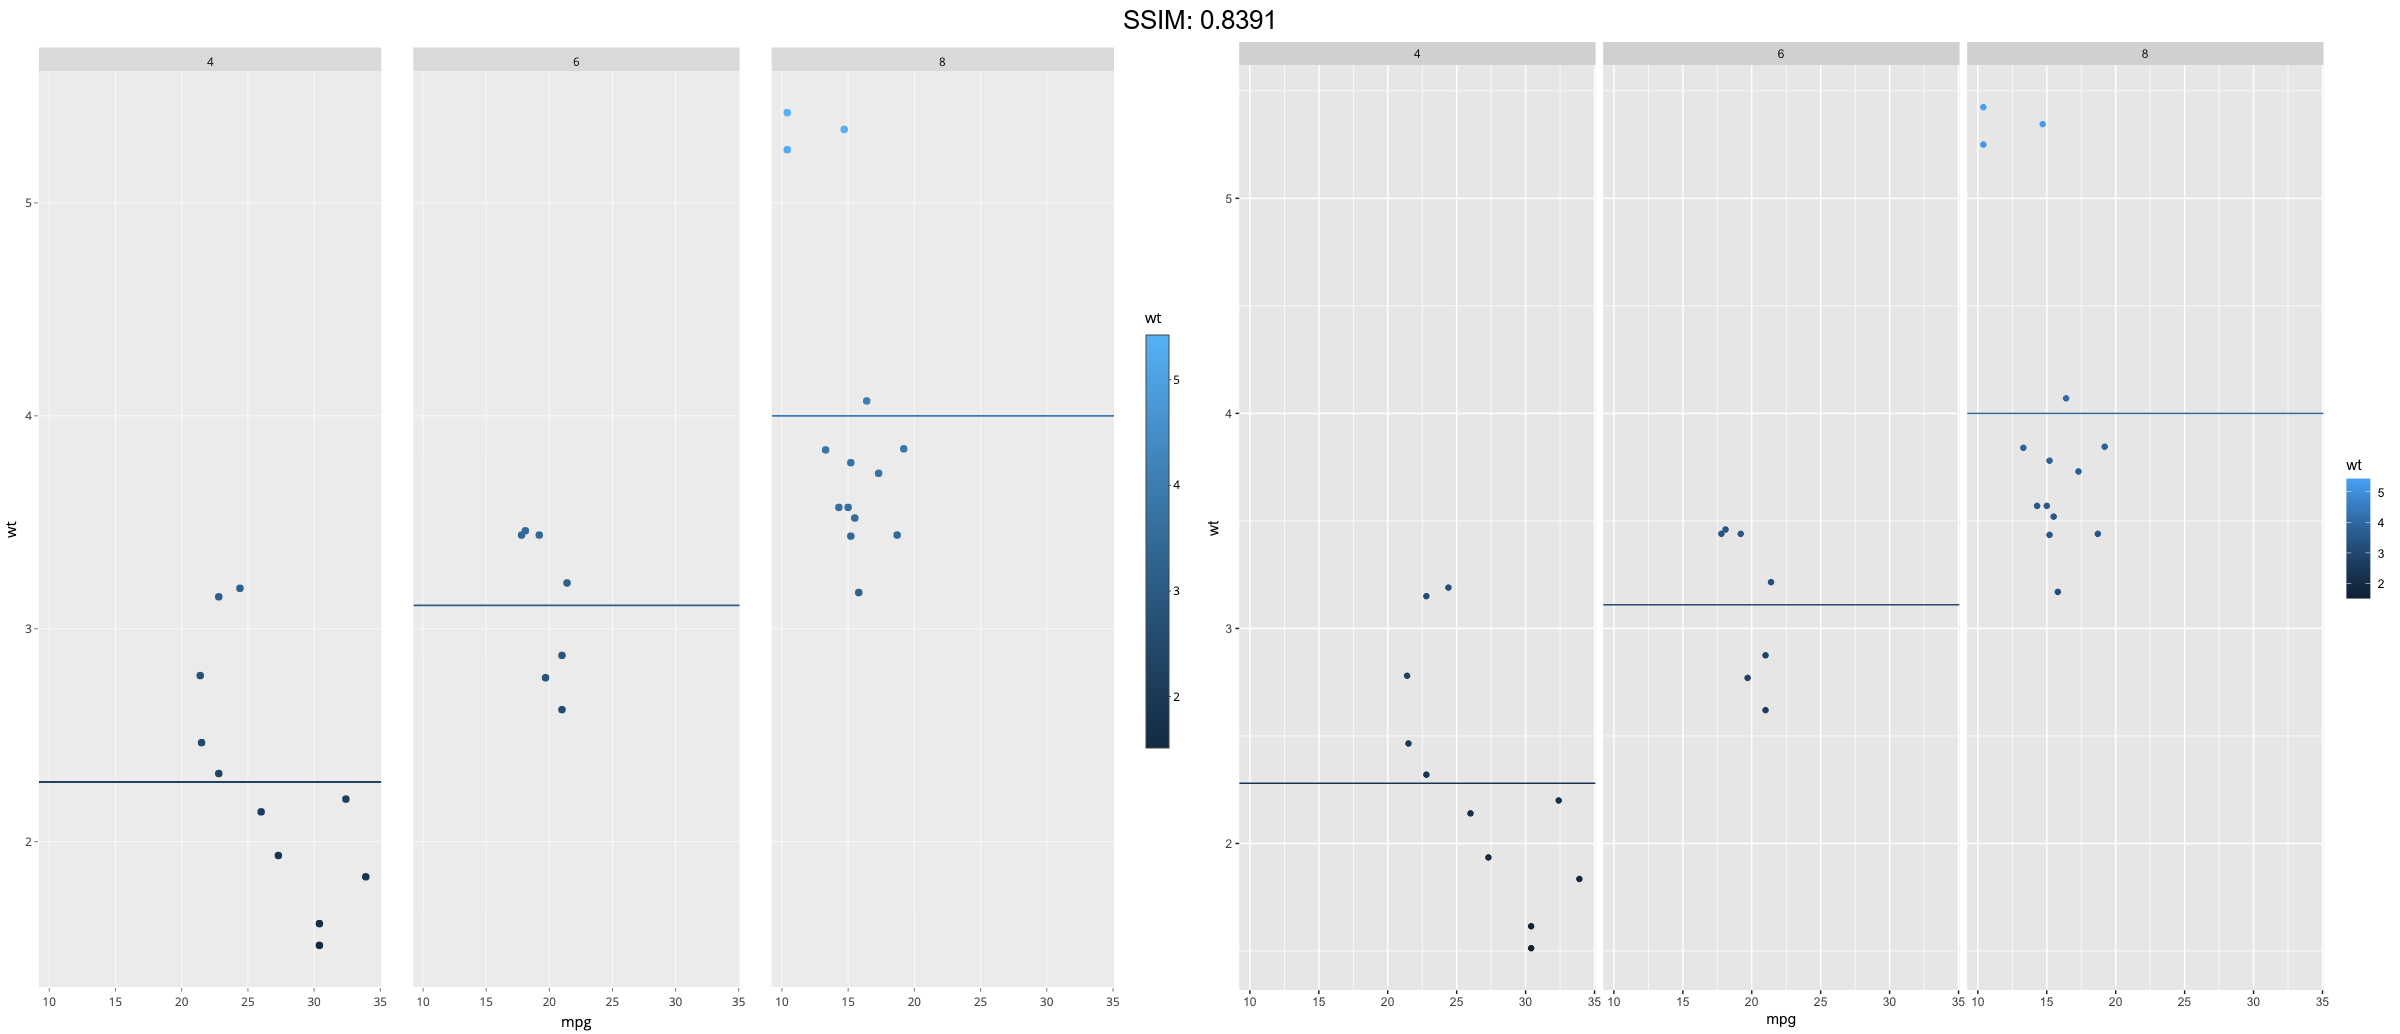
mean_wt <- data.frame(cyl = c(4, 6, 8), wt = c(2.28, 3.11, 4.00))
p <-
 ggplot(mtcars, aes(mpg, wt, colour = wt)) +
  geom_point() +
  geom_hline(aes(yintercept = wt, colour = wt), mean_wt) +
  facet_wrap(~ cyl)
plotly::ggplotly(p)