GGPLOT - stat_summary_2d
Bin and summarise in 2d (rectangle & hexagons) and then convert them with ggplotly
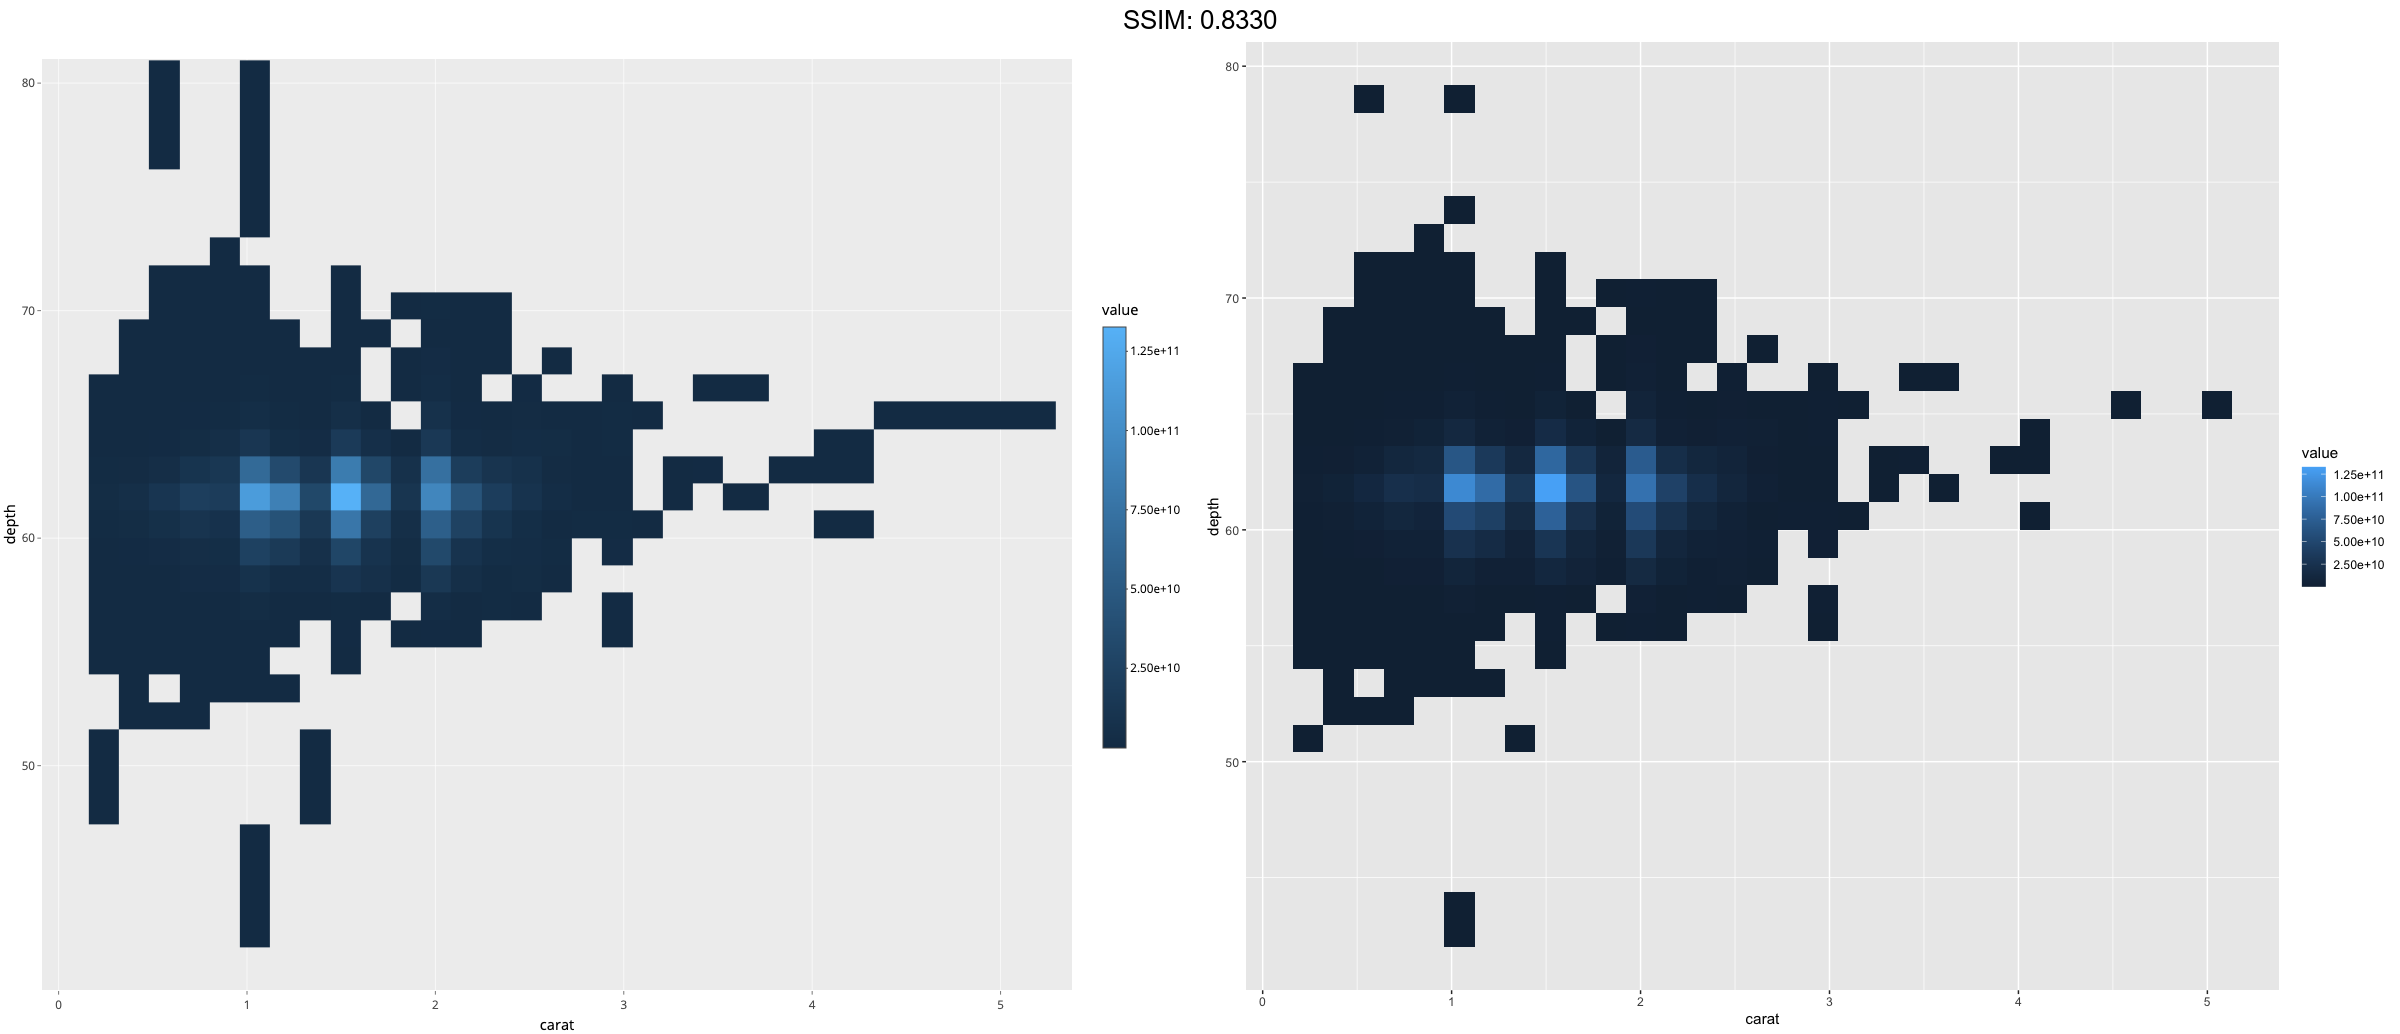
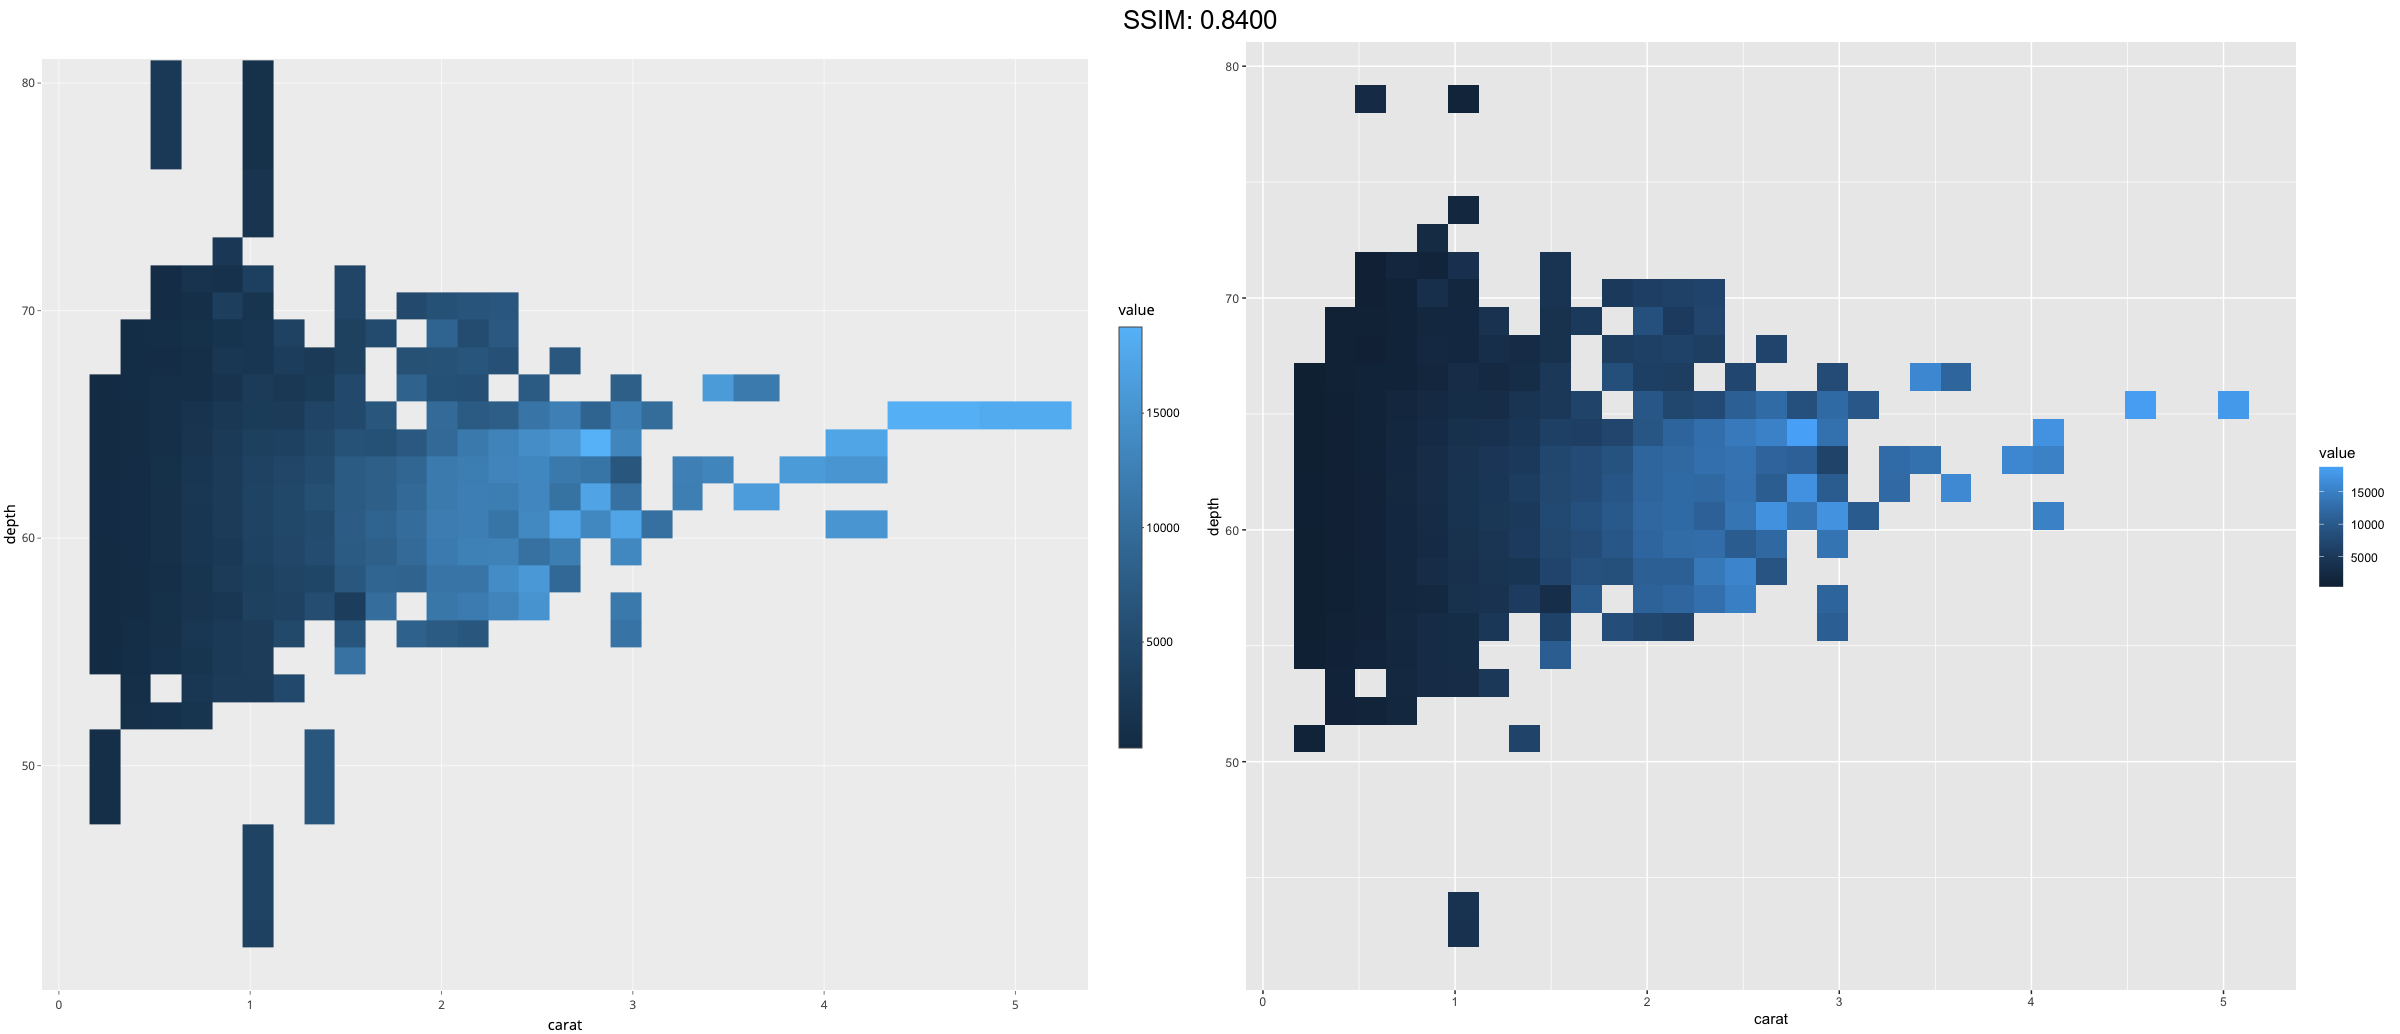
d <- ggplot(diamonds, aes(carat, depth, z = price))
p <-  d + stat_summary_2d()
plotly::ggplotly(p)


d <- ggplot(diamonds, aes(carat, depth, z = price))
p <-  d + stat_summary_2d(fun = function(x) sum(x^2))
plotly::ggplotly(p)

d <- ggplot(diamonds, aes(carat, depth, z = price))
p <-  d + stat_summary_2d(fun = ~ sum(.x^2))
plotly::ggplotly(p)

d <- ggplot(diamonds, aes(carat, depth, z = price))
p <-  d + stat_summary_2d(fun = var)
plotly::ggplotly(p)


d <- ggplot(diamonds, aes(carat, depth, z = price))
p <-  d + stat_summary_2d(fun = "quantile", fun.args = list(probs = 0.1))
plotly::ggplotly(p)
d <- ggplot(diamonds, aes(carat, depth, z = price))
p <-
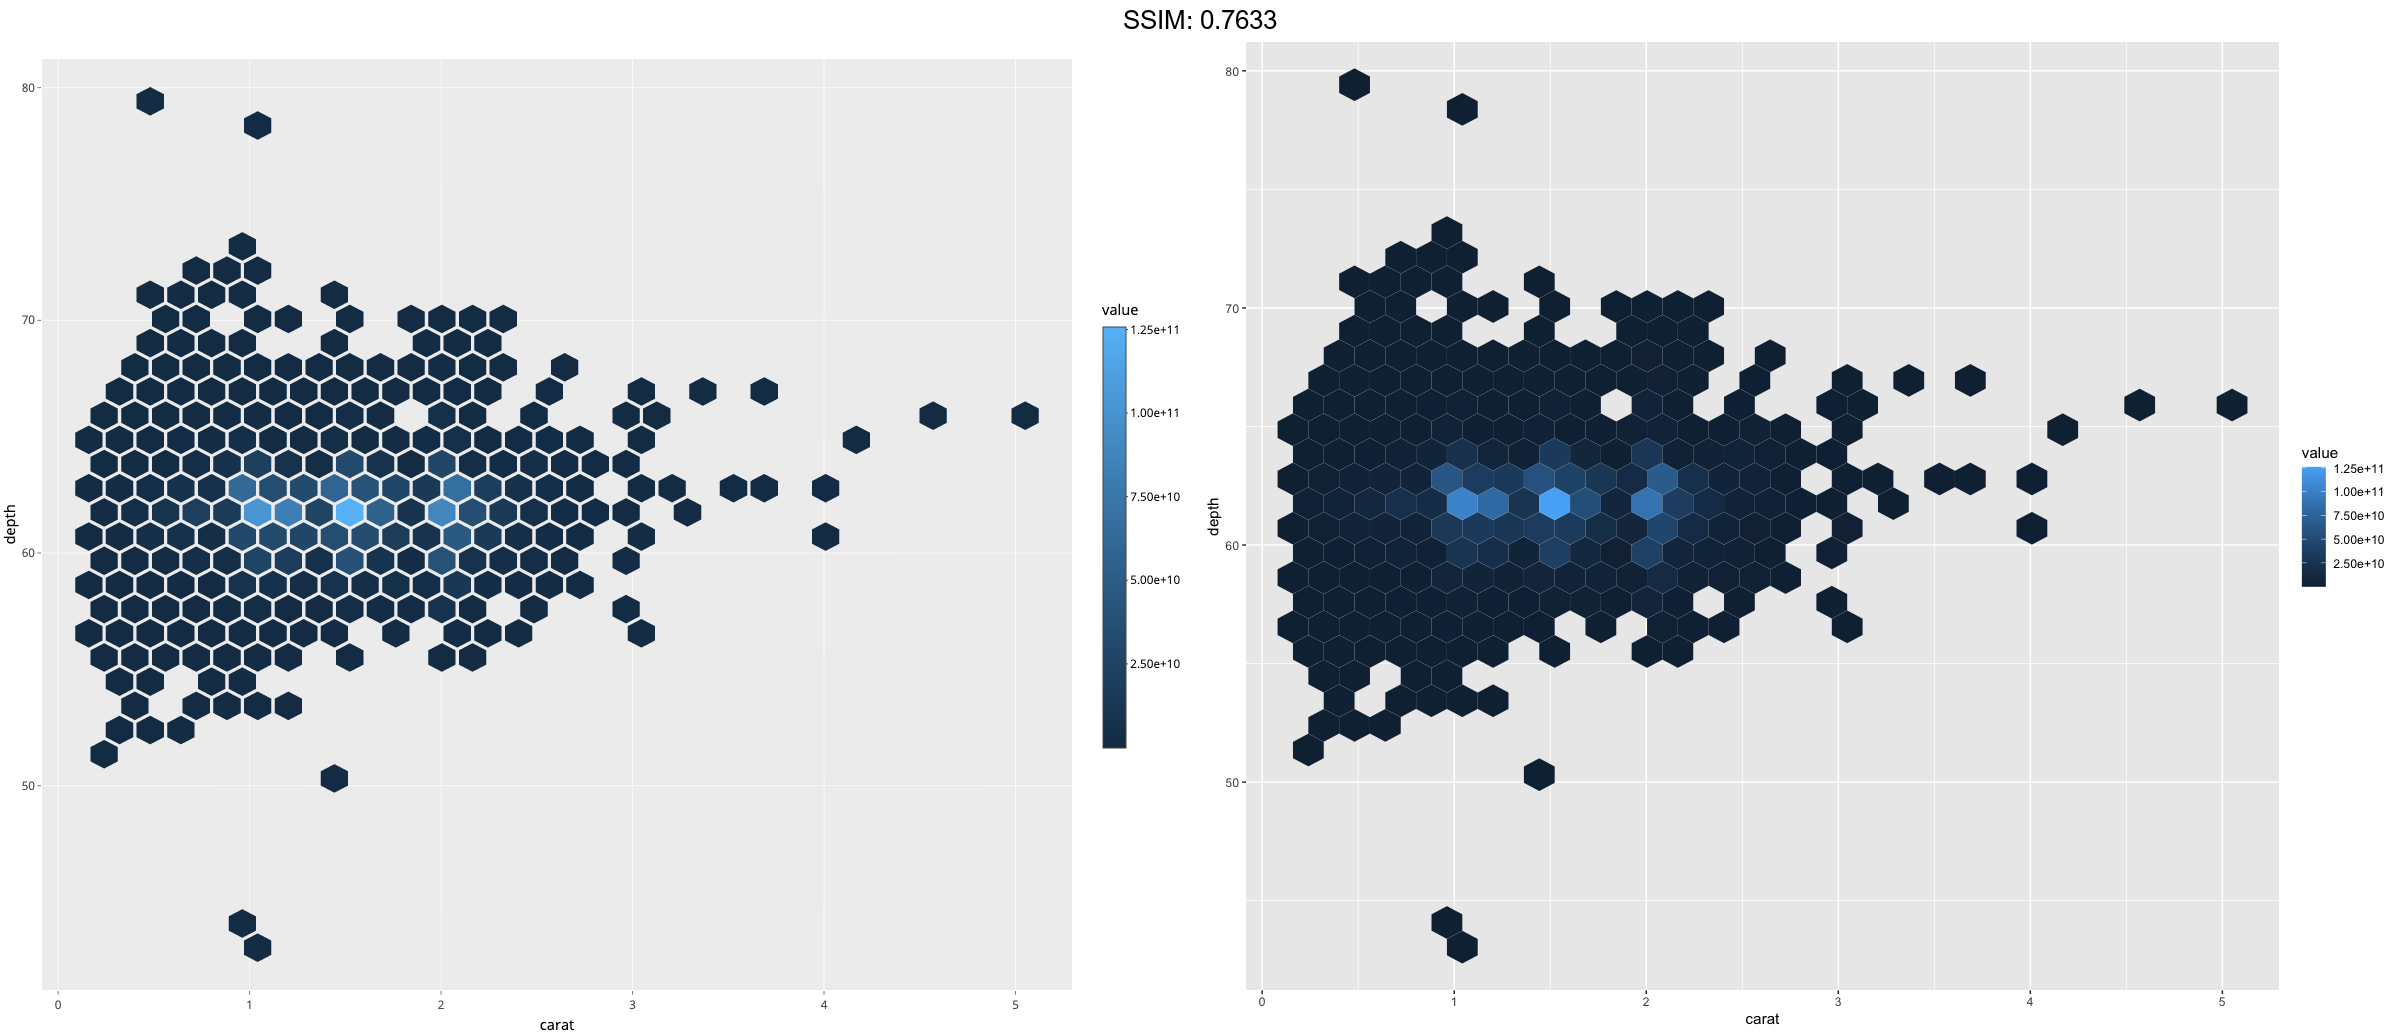
if (requireNamespace("hexbin")) {
d + stat_summary_hex()
d + stat_summary_hex(fun = ~ sum(.x^2))
}
plotly::ggplotly(p)