GGPLOT - stat_ecdf
Creates plot from empirical cumulative distribution computation and then convert them with ggplotly
df <- data.frame(
  x = c(rnorm(100, 0, 3), rnorm(100, 0, 10)),
  g = gl(2, 100)
)
p <-
 ggplot(df, aes(x)) +
  stat_ecdf(geom = "step")
plotly::ggplotly(p)

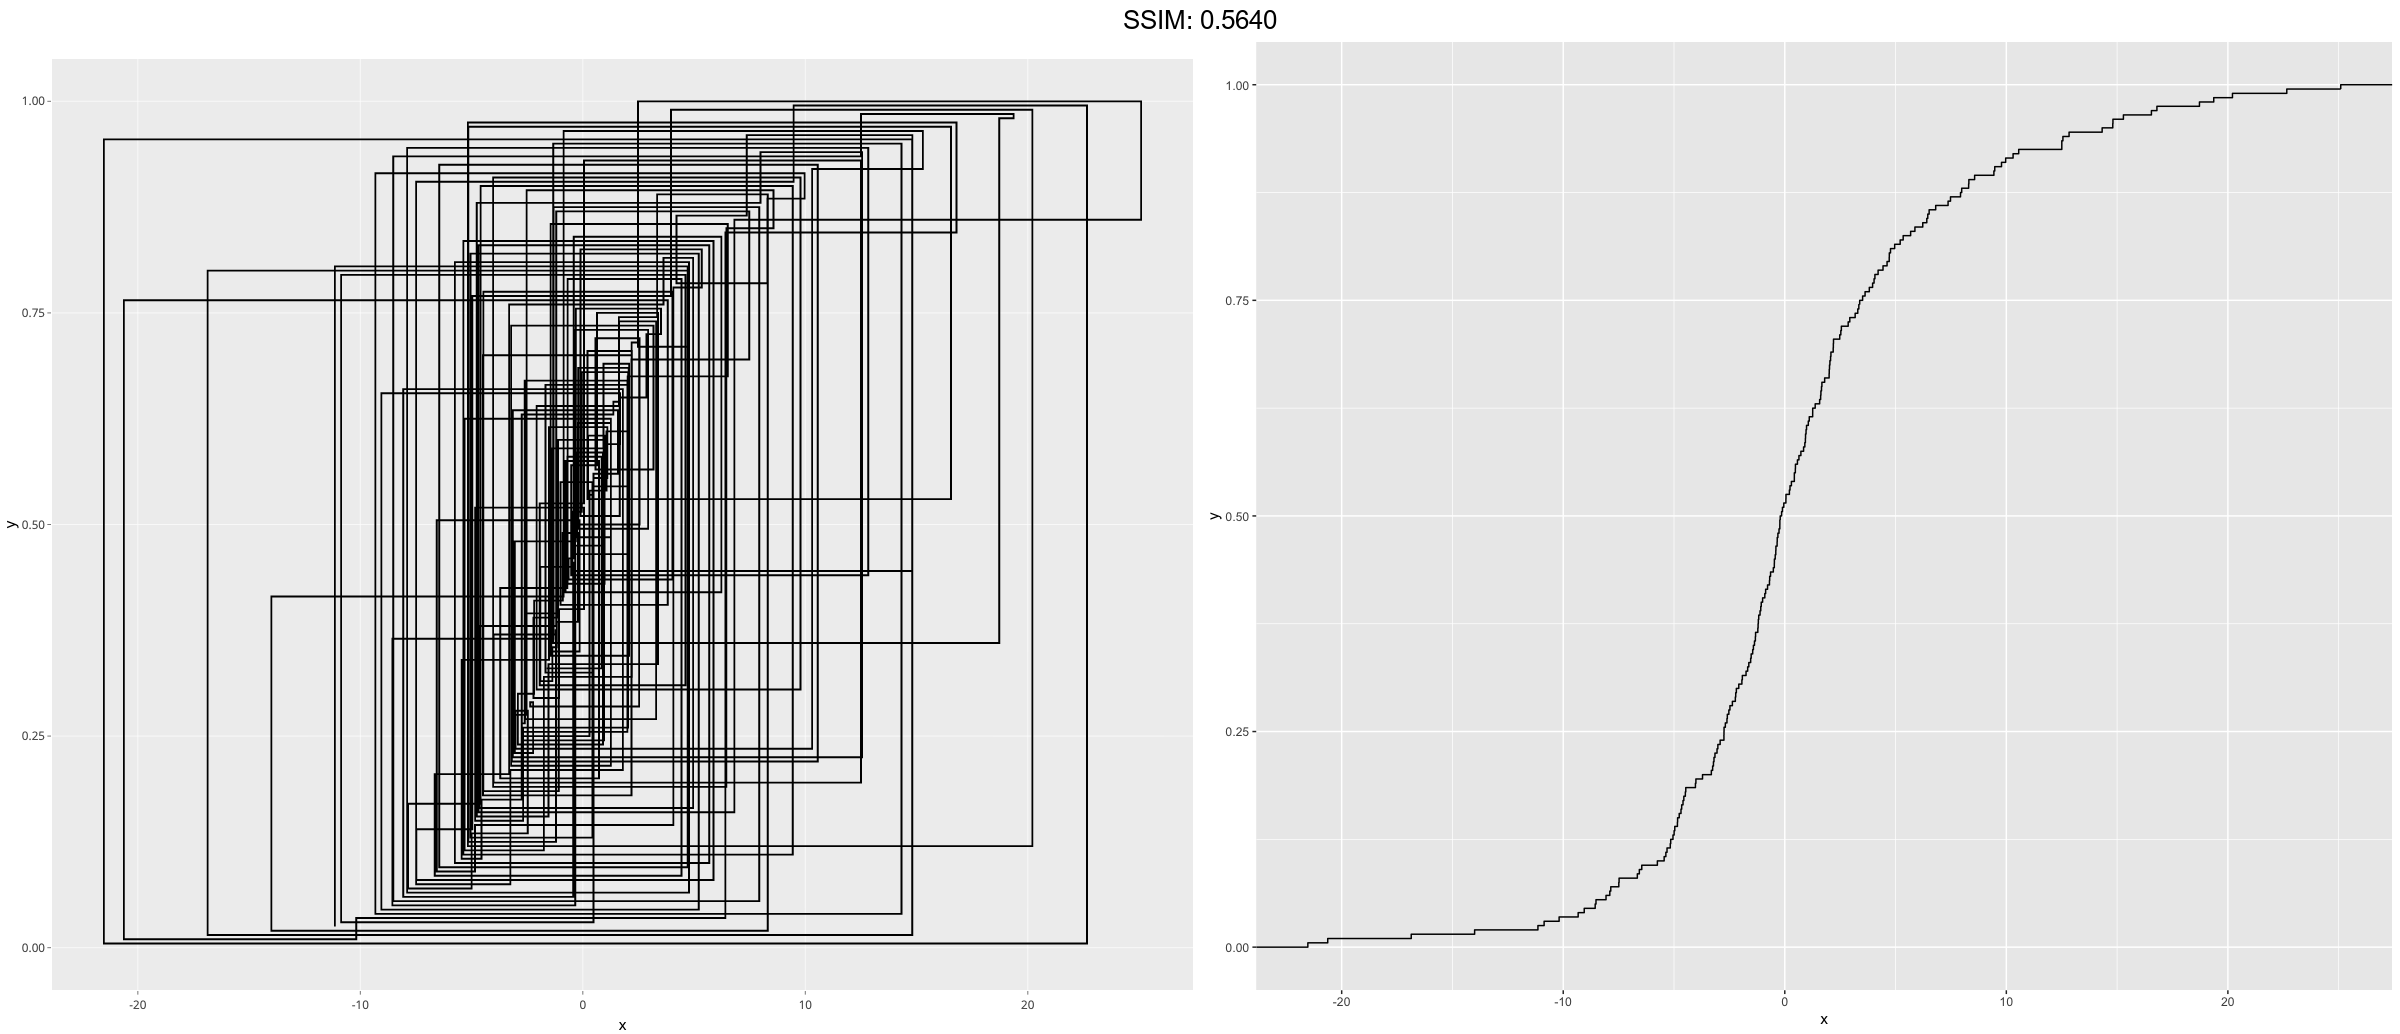
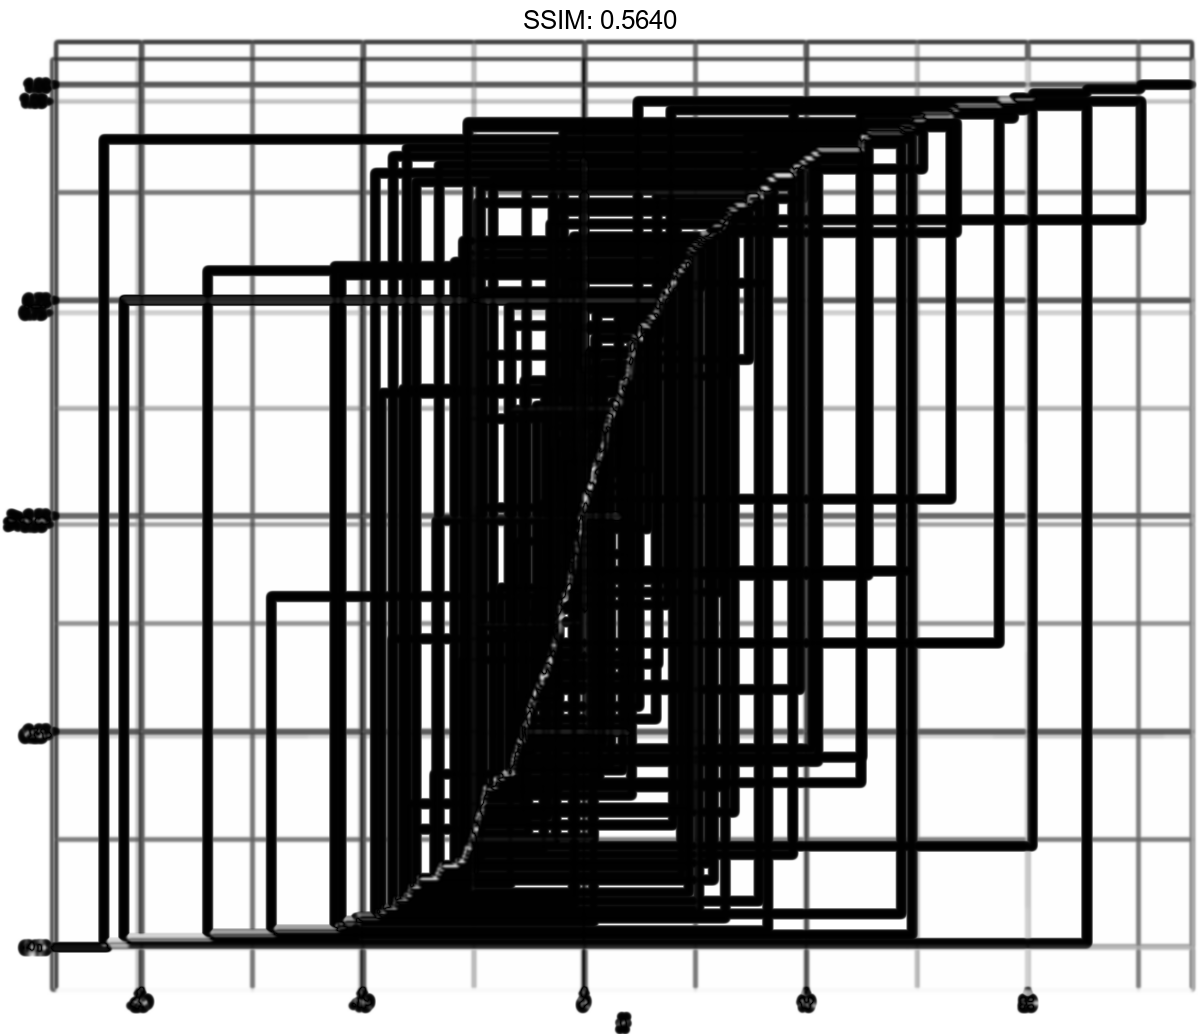
df <- data.frame(
  x = c(rnorm(100, 0, 3), rnorm(100, 0, 10)),
  g = gl(2, 100)
)
p <-
 ggplot(df, aes(x)) +
  stat_ecdf(geom = "step", pad = FALSE)
plotly::ggplotly(p)


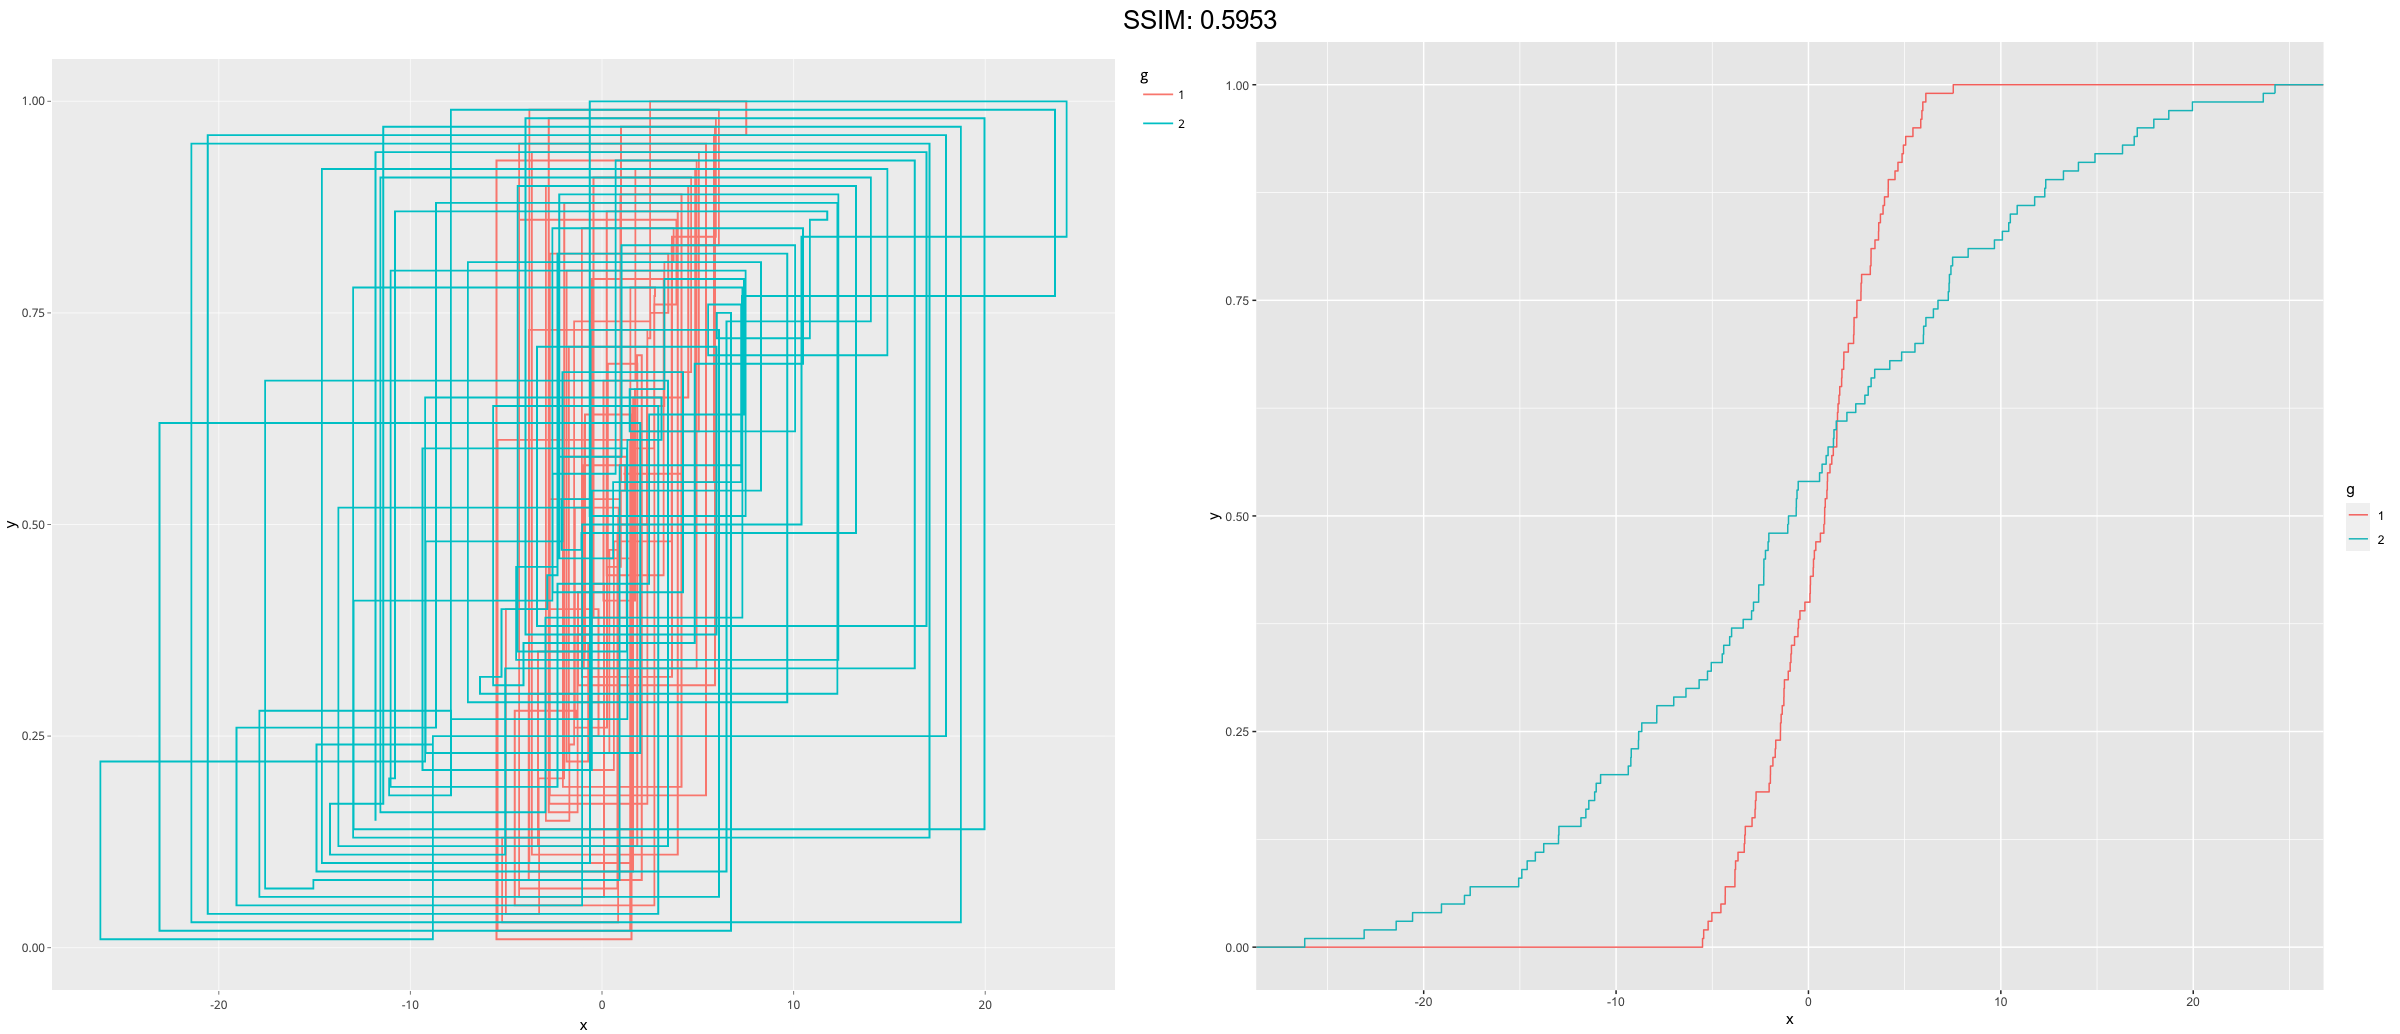
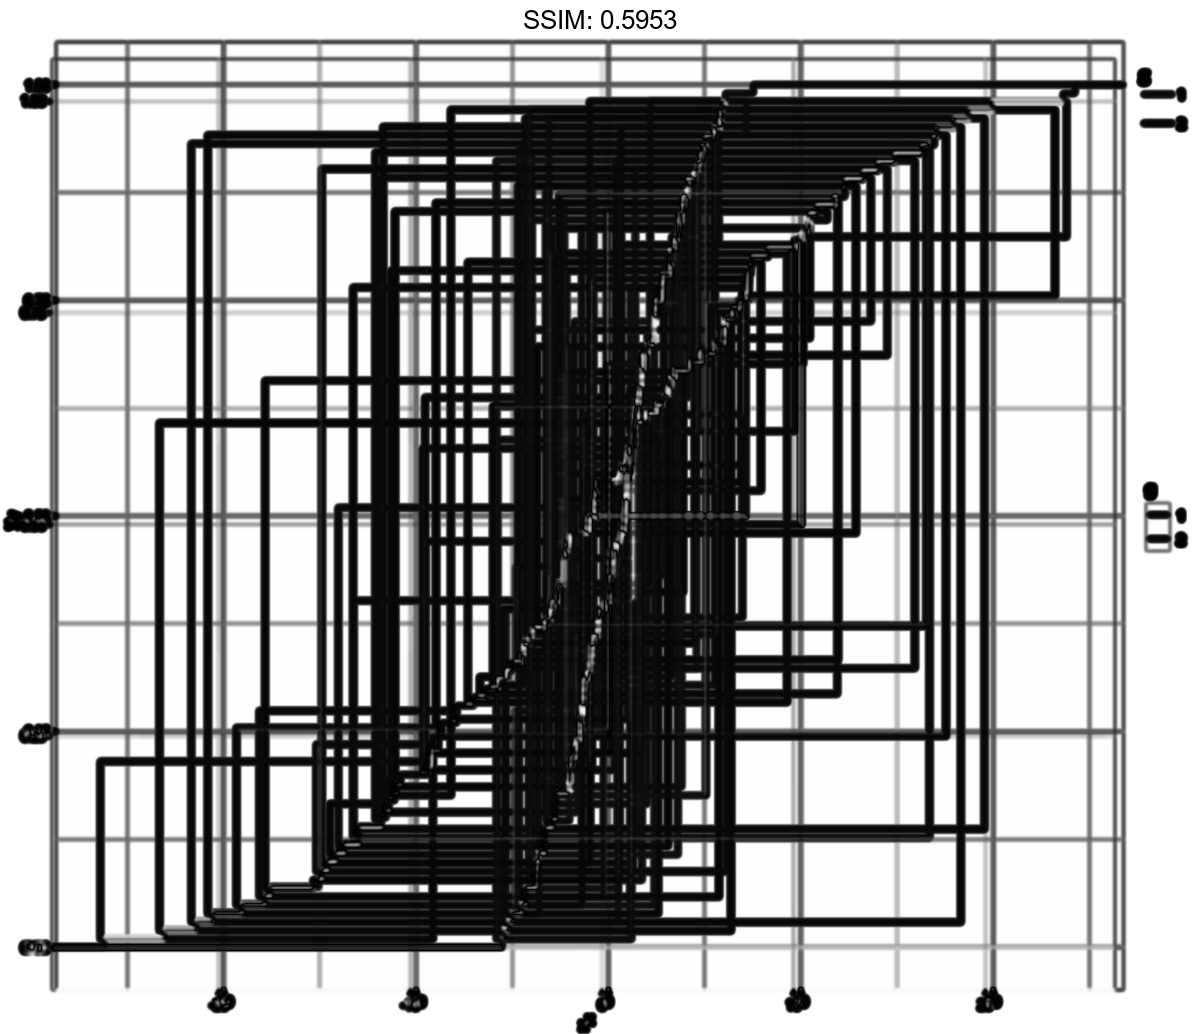
df <- data.frame(
  x = c(rnorm(100, 0, 3), rnorm(100, 0, 10)),
  g = gl(2, 100)
)
p <-
 ggplot(df, aes(x, colour = g)) +
  stat_ecdf()
plotly::ggplotly(p)