GGPLOT - annotate
Adding small annotations (such as text labels) or data in vectors and then convert them into ggplotly
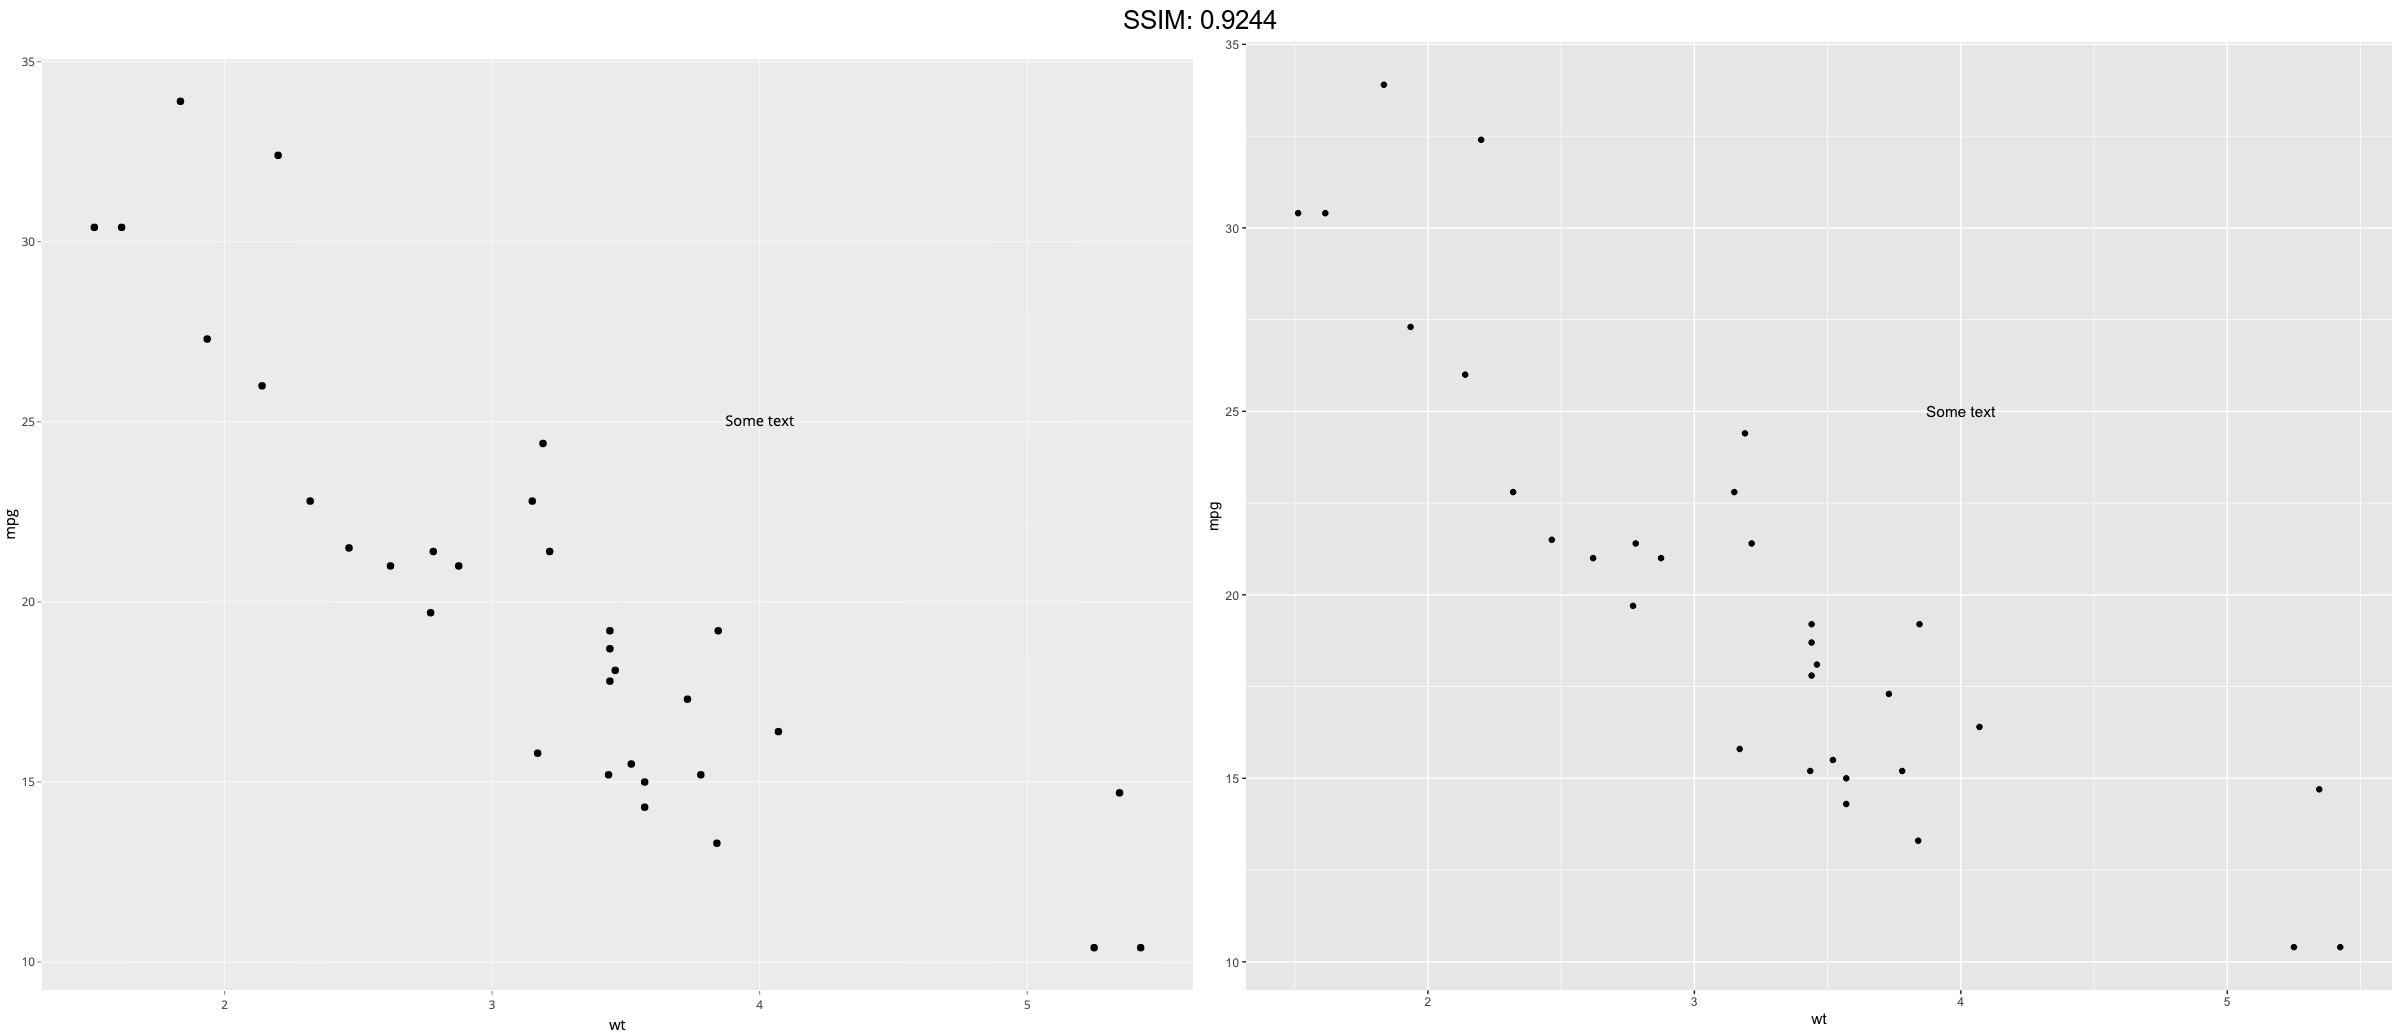
p <- ggplot(mtcars, aes(x = wt, y = mpg)) + geom_point()
p <-  p + annotate("text", x = 4, y = 25, label = "Some text")
plotly::ggplotly(p)

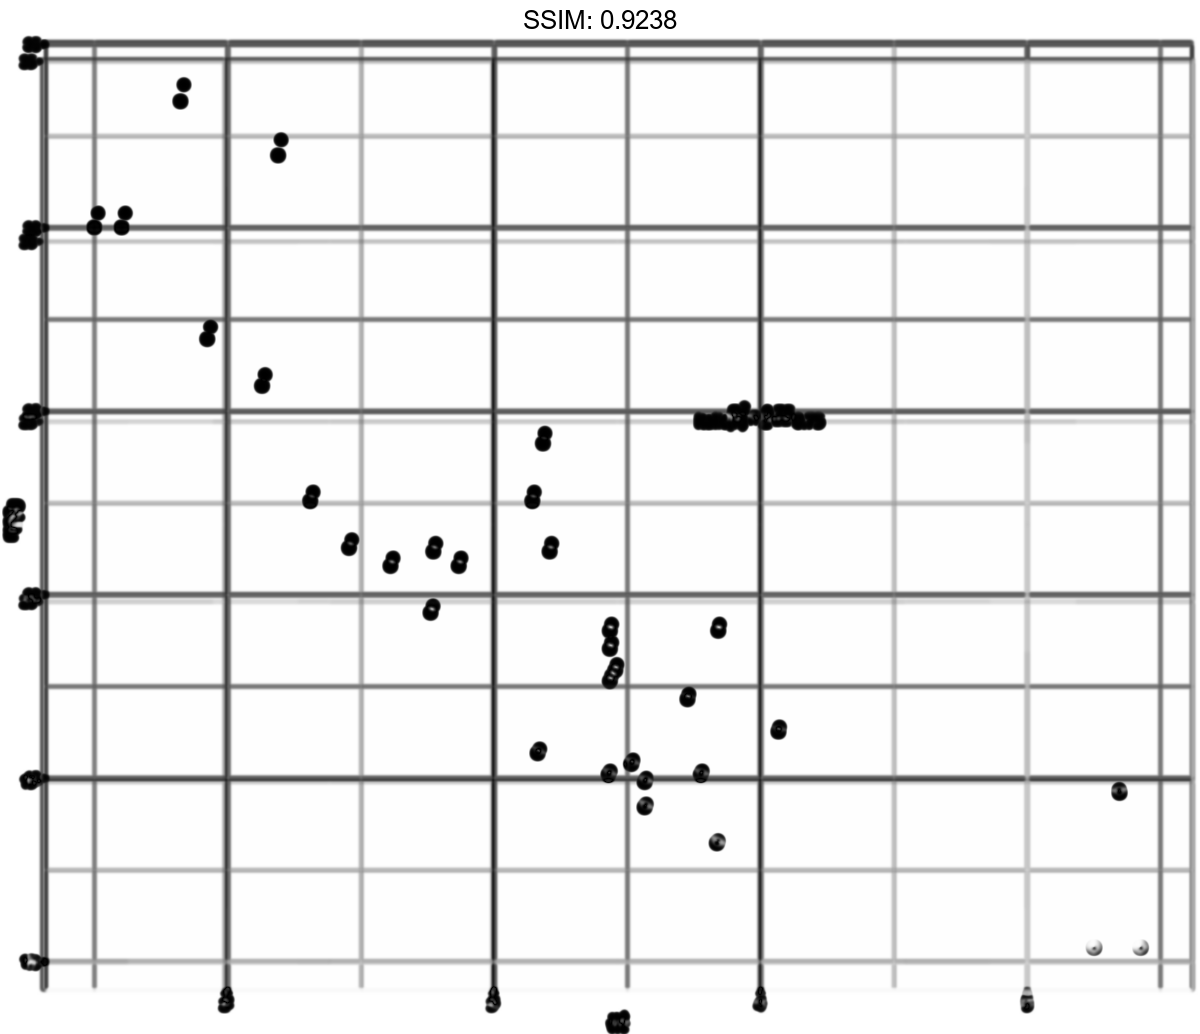
p <- ggplot(mtcars, aes(x = wt, y = mpg)) + geom_point()
p <-  p + annotate("text", x = 2:5, y = 25, label = "Some text")
plotly::ggplotly(p)

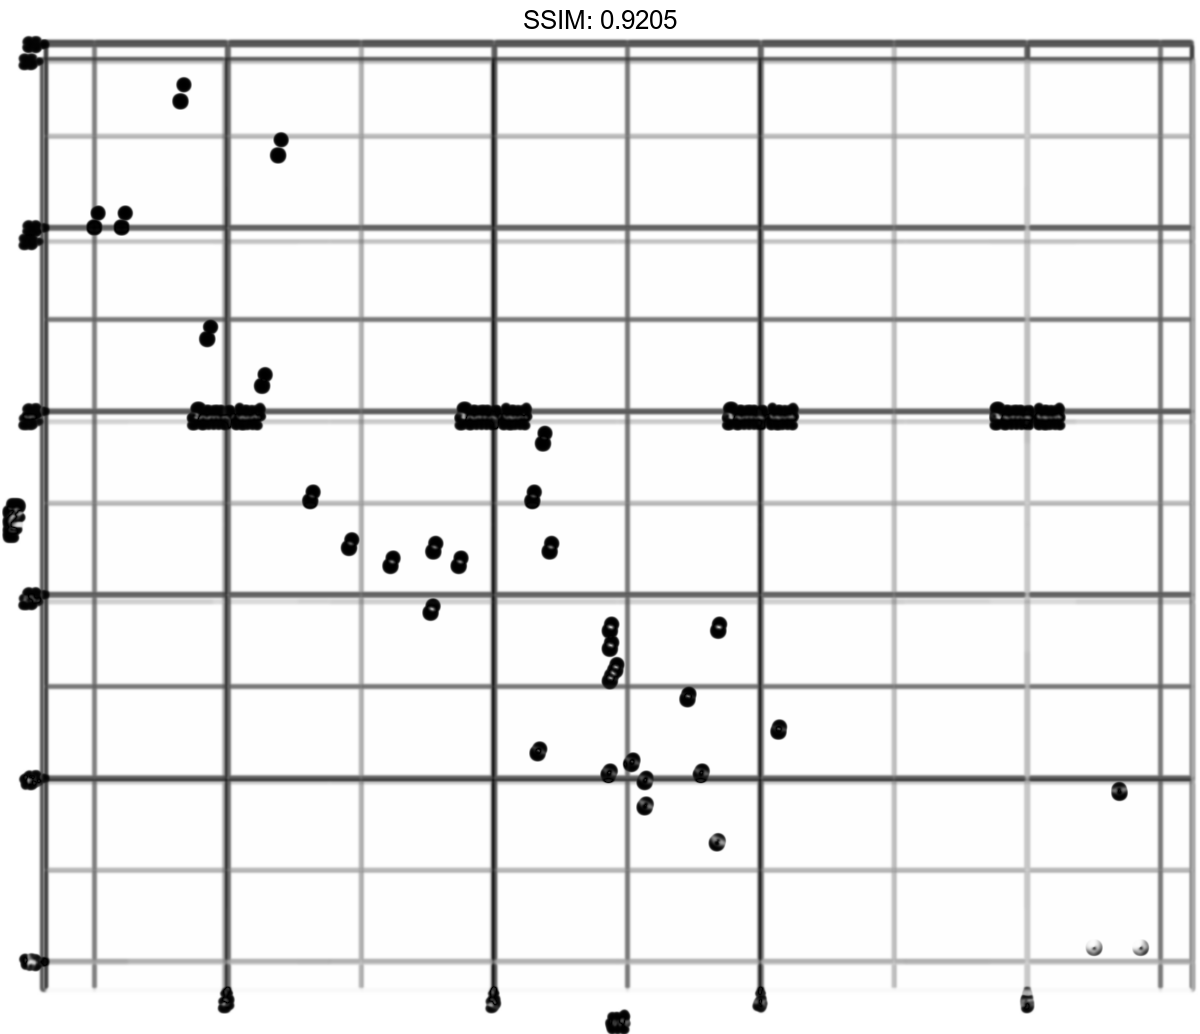
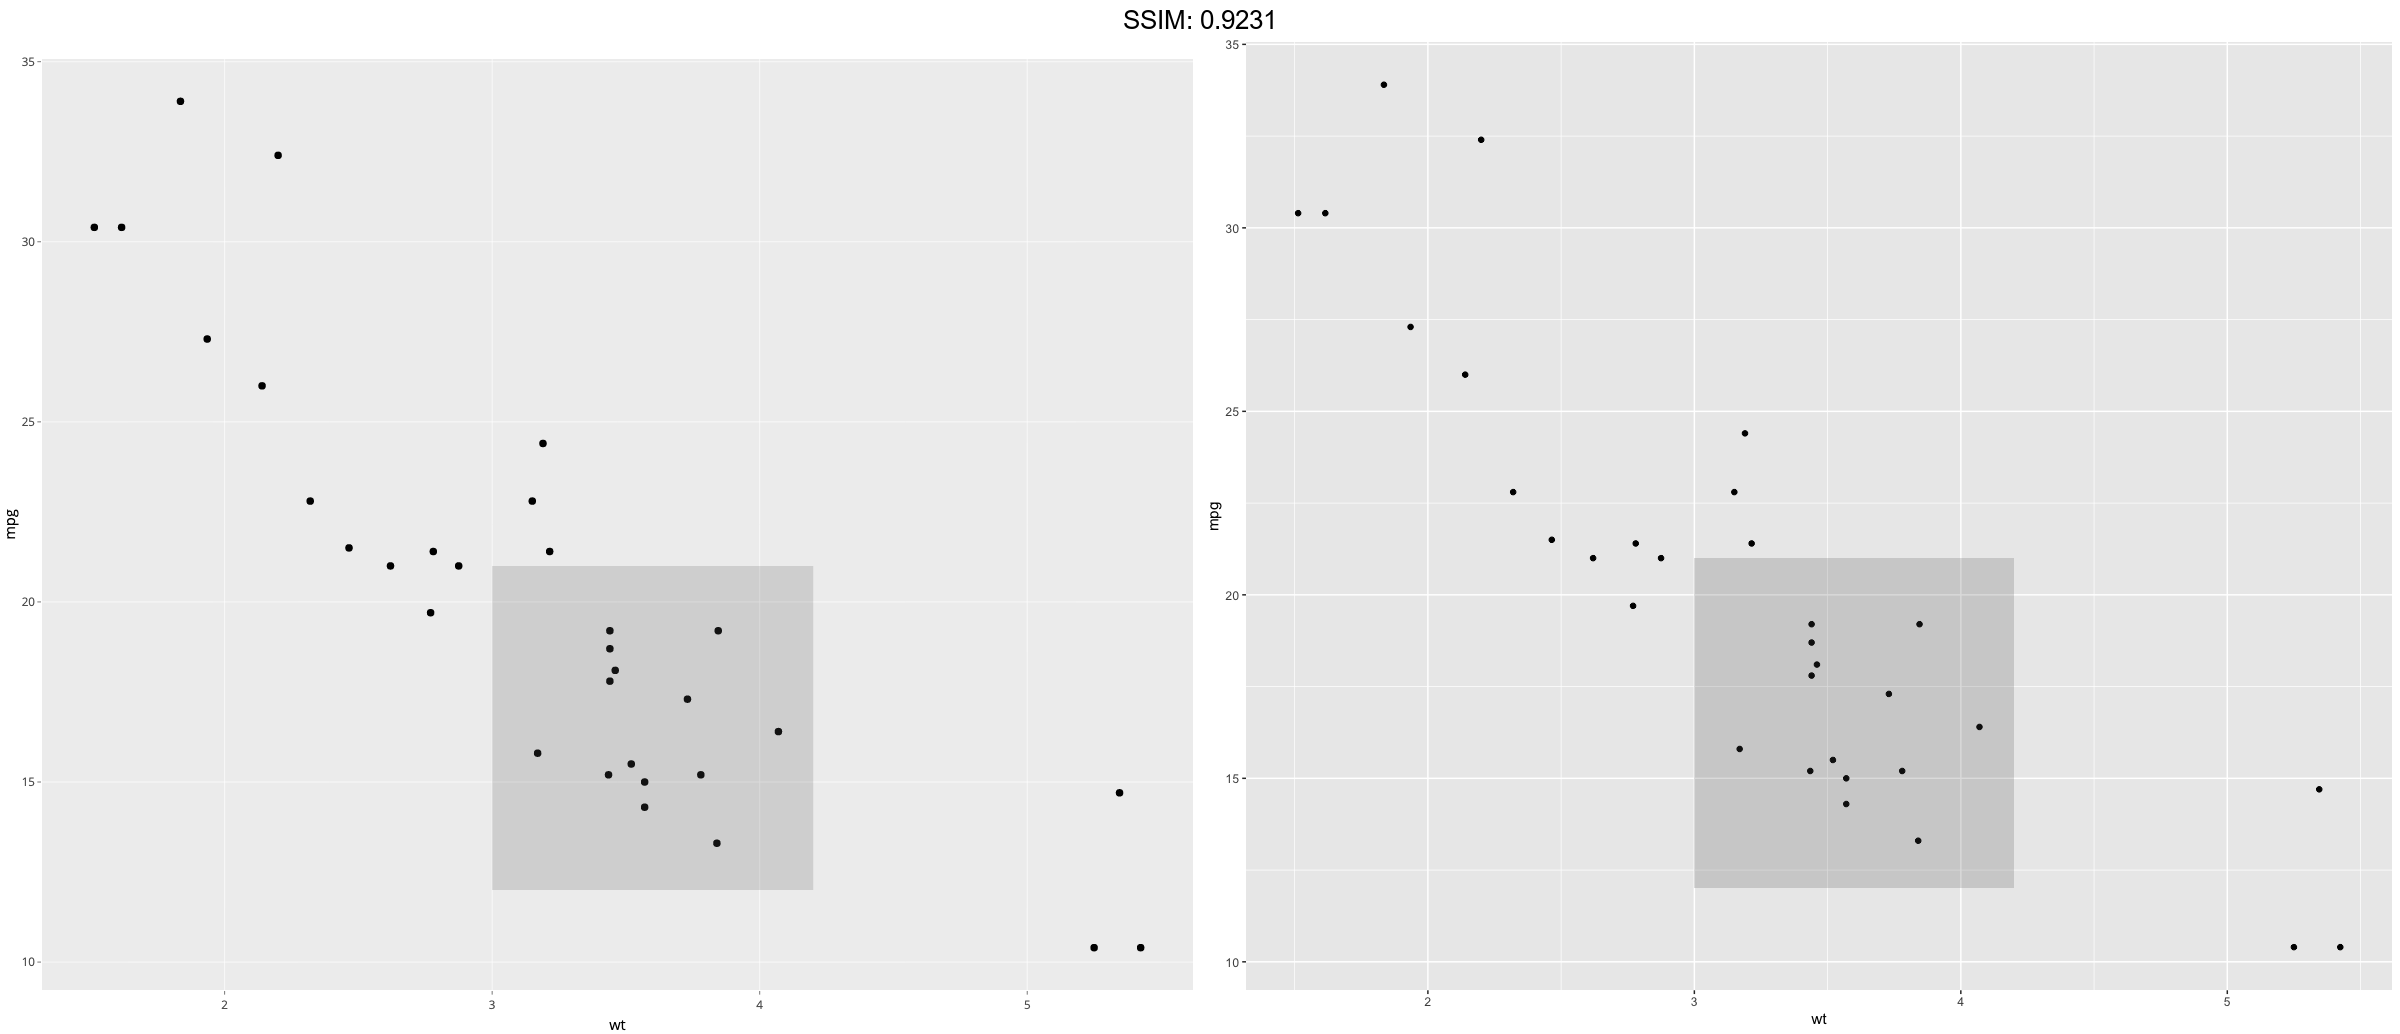
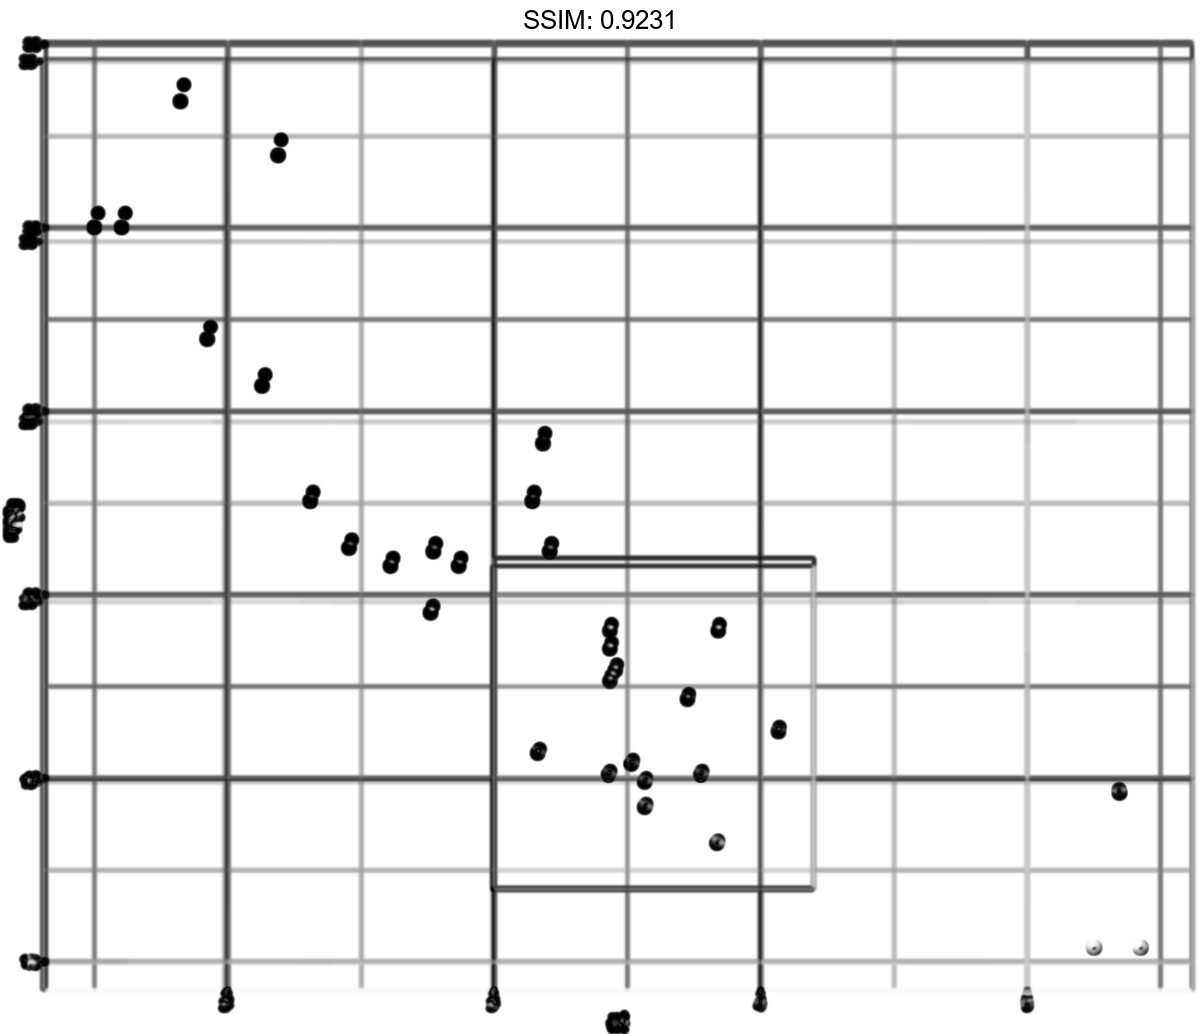
p <- ggplot(mtcars, aes(x = wt, y = mpg)) + geom_point()
p <-
 p + annotate("rect", xmin = 3, xmax = 4.2, ymin = 12, ymax = 21,
  alpha = .2)
plotly::ggplotly(p)
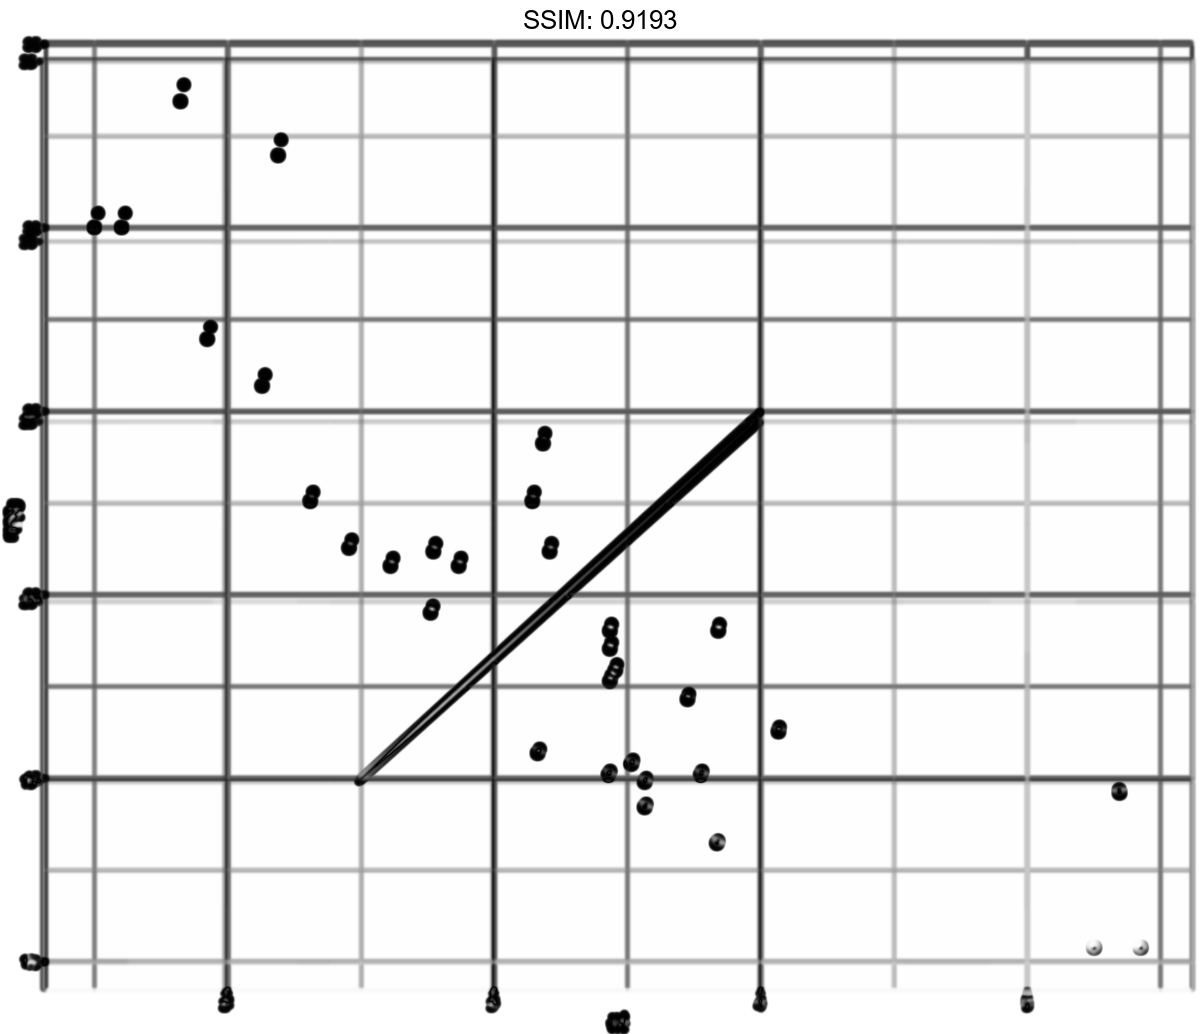
p <- ggplot(mtcars, aes(x = wt, y = mpg)) + geom_point()
p <-
 p + annotate("segment", x = 2.5, xend = 4, y = 15, yend = 25,
  colour = "blue")
plotly::ggplotly(p)

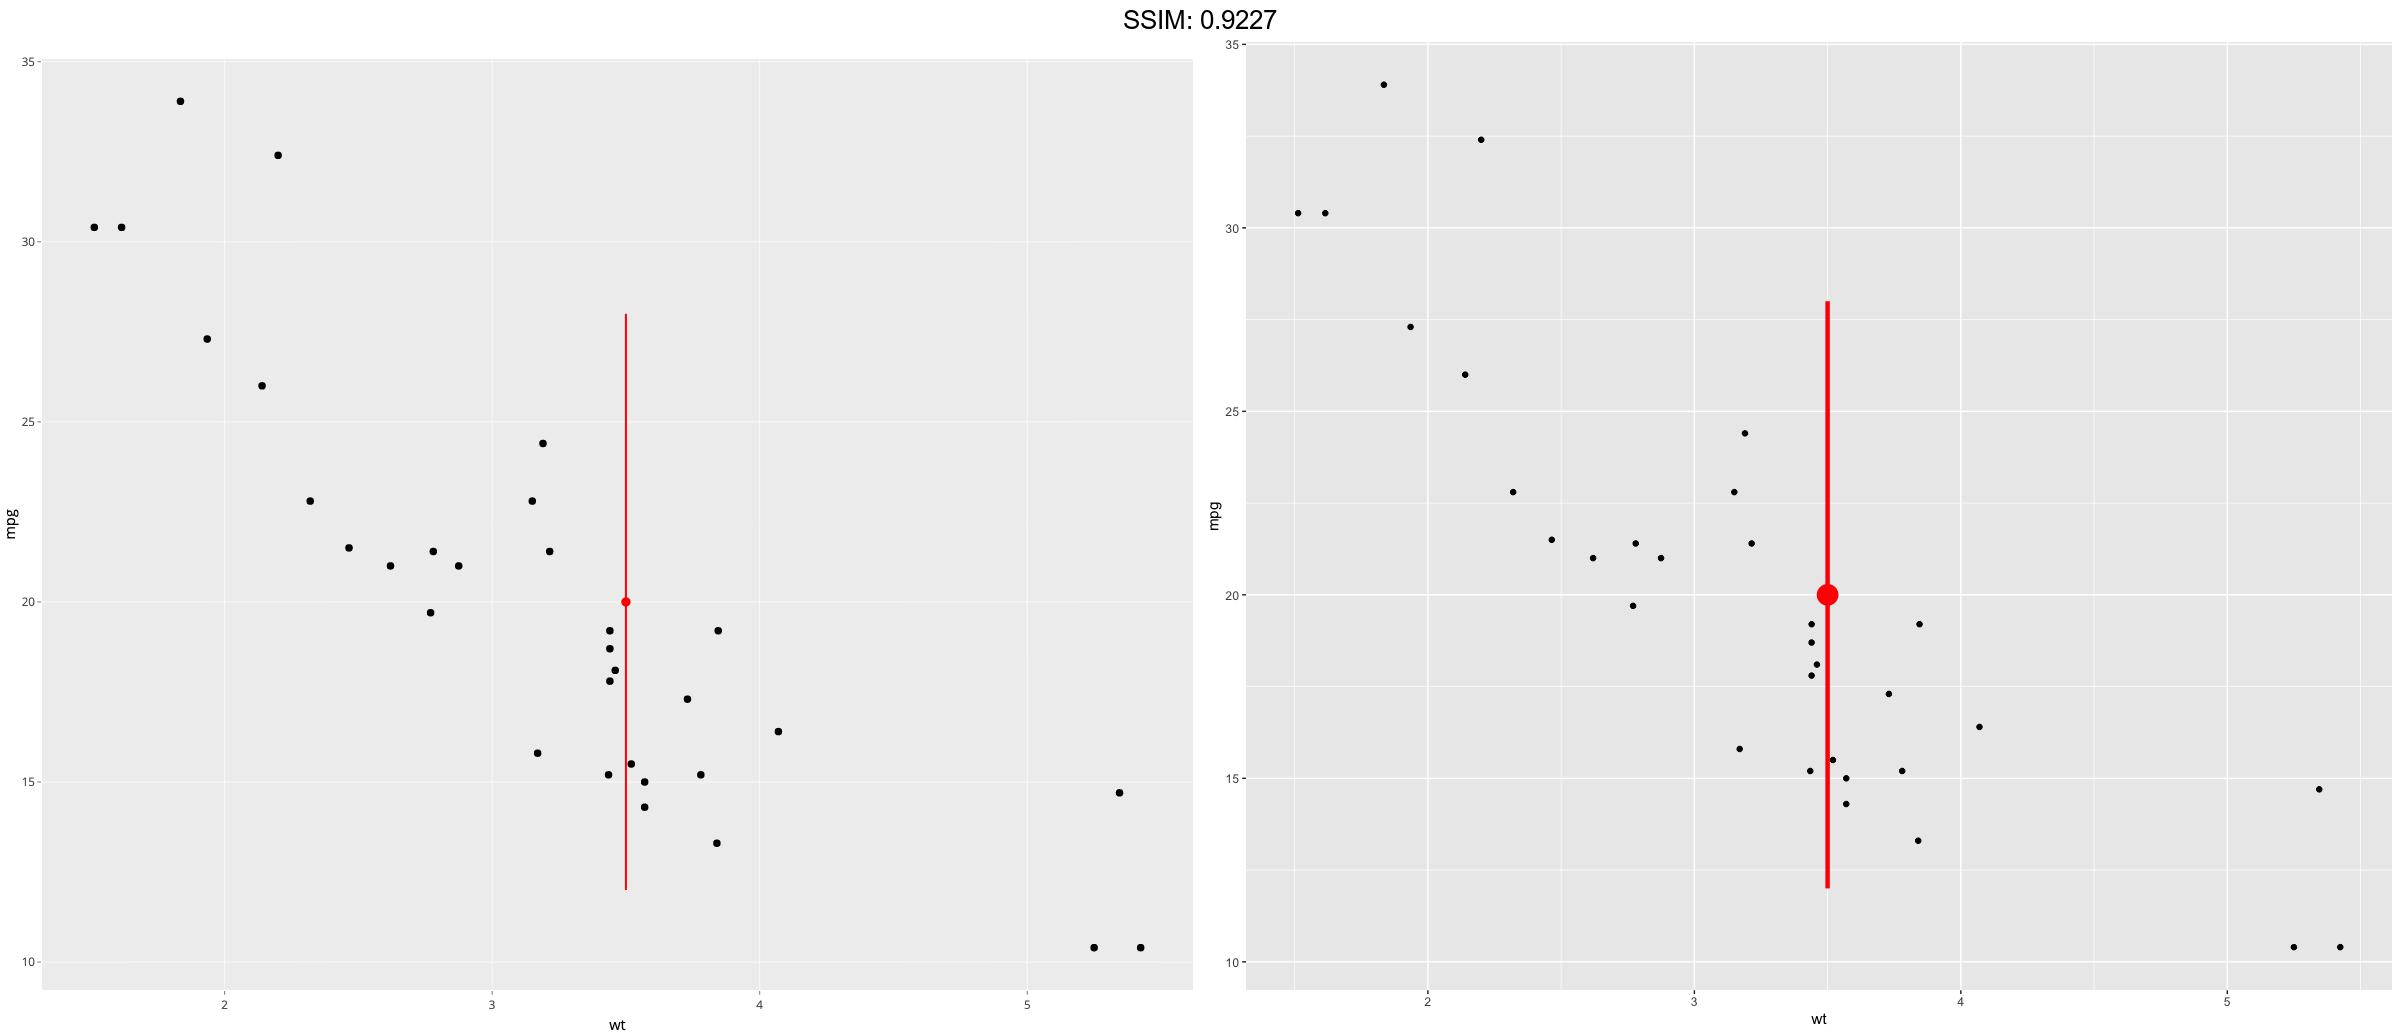
p <- ggplot(mtcars, aes(x = wt, y = mpg)) + geom_point()
p <-
 p + annotate("pointrange", x = 3.5, y = 20, ymin = 12, ymax = 28,
  colour = "red", size = 1.5)
plotly::ggplotly(p)
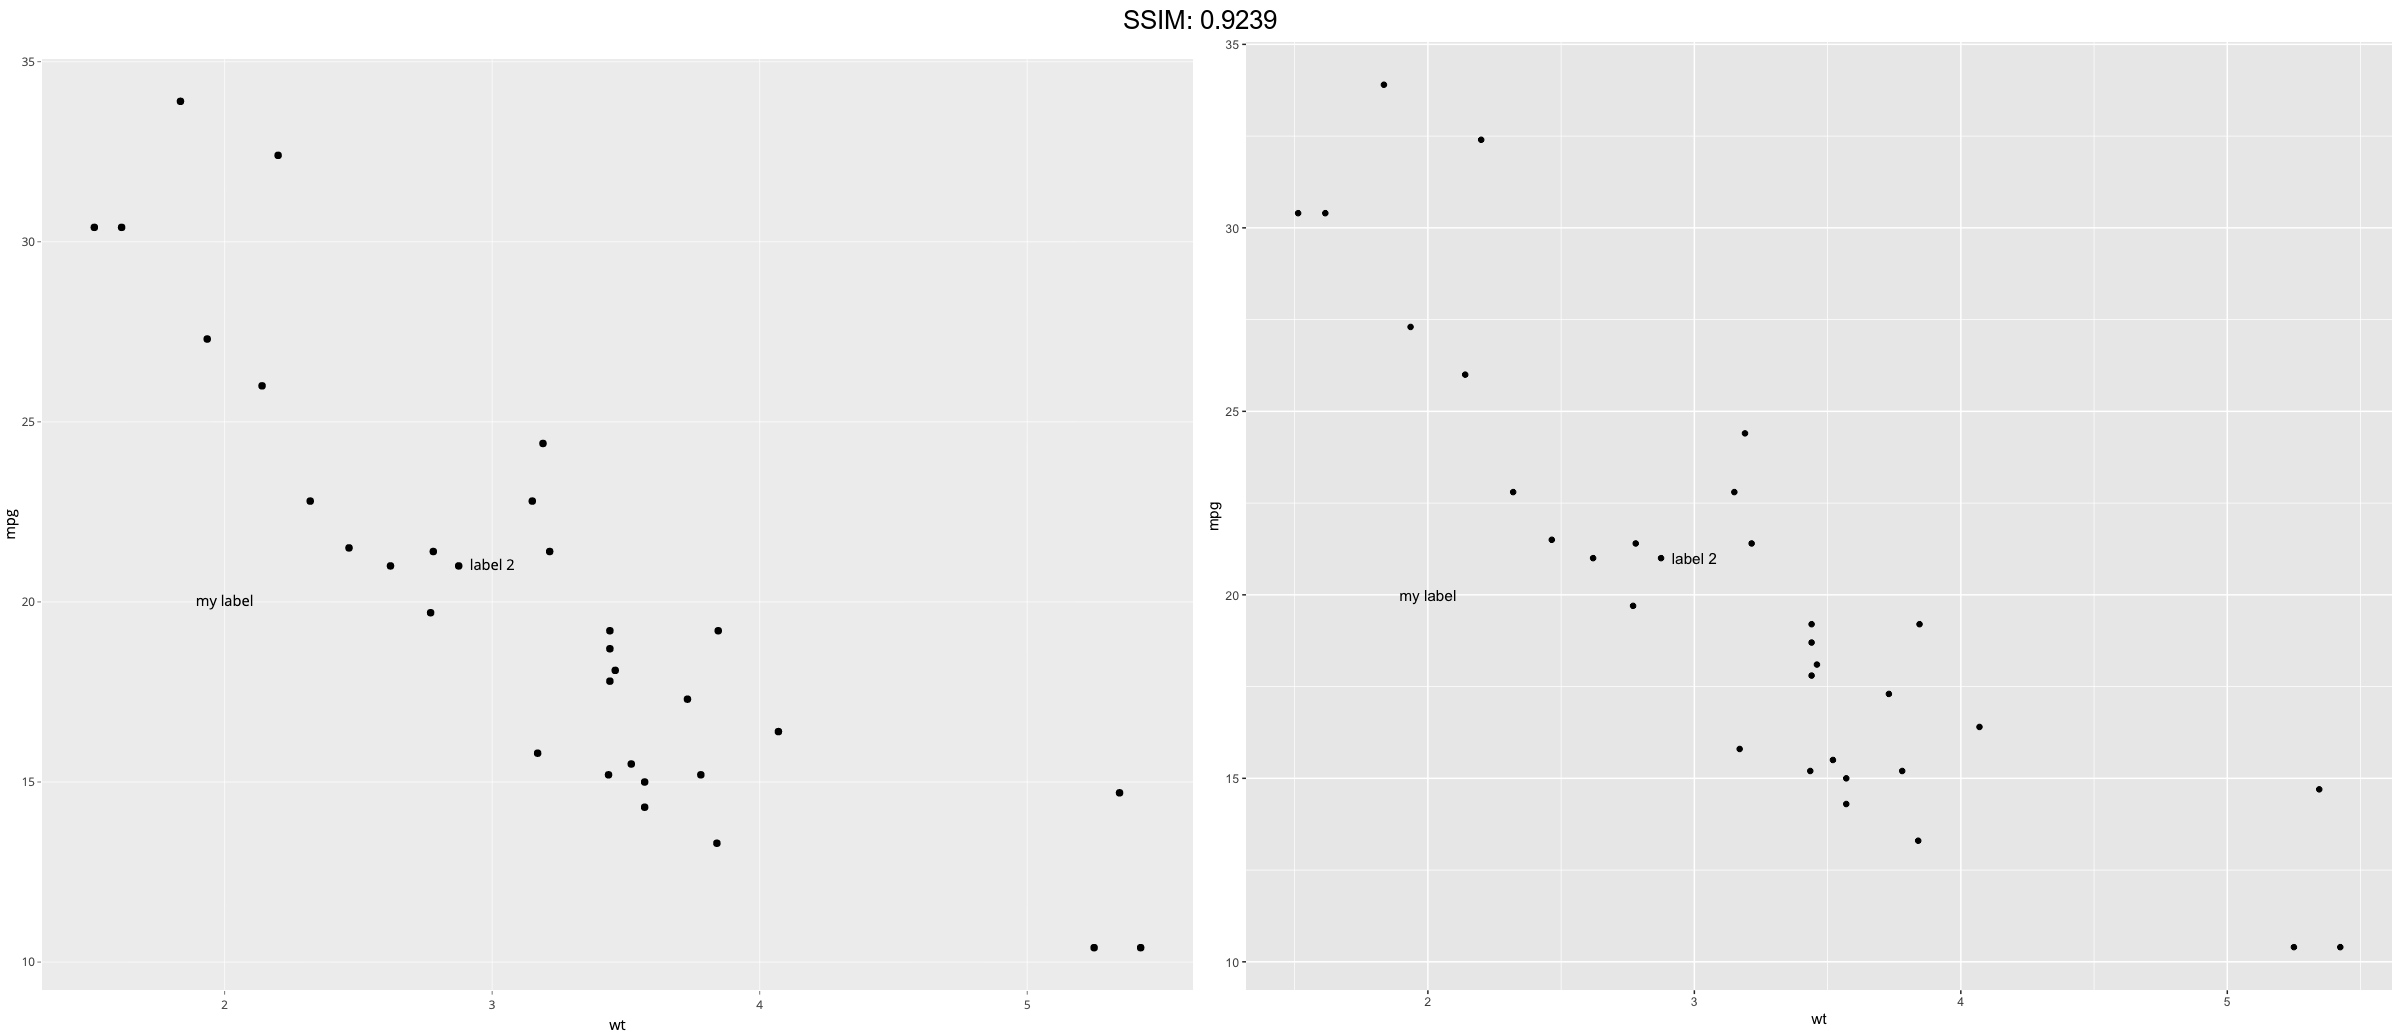
p <- ggplot(mtcars, aes(x = wt, y = mpg)) + geom_point()
p <-  p + annotate("text", x = 2:3, y = 20:21, label = c("my label", "label 2"))
plotly::ggplotly(p)
p <- ggplot(mtcars, aes(x = wt, y = mpg)) + geom_point()
p <-
 p + annotate("text", x = 4, y = 25, label = "italic(R) ^ 2 == 0.75",
  parse = TRUE)
plotly::ggplotly(p)

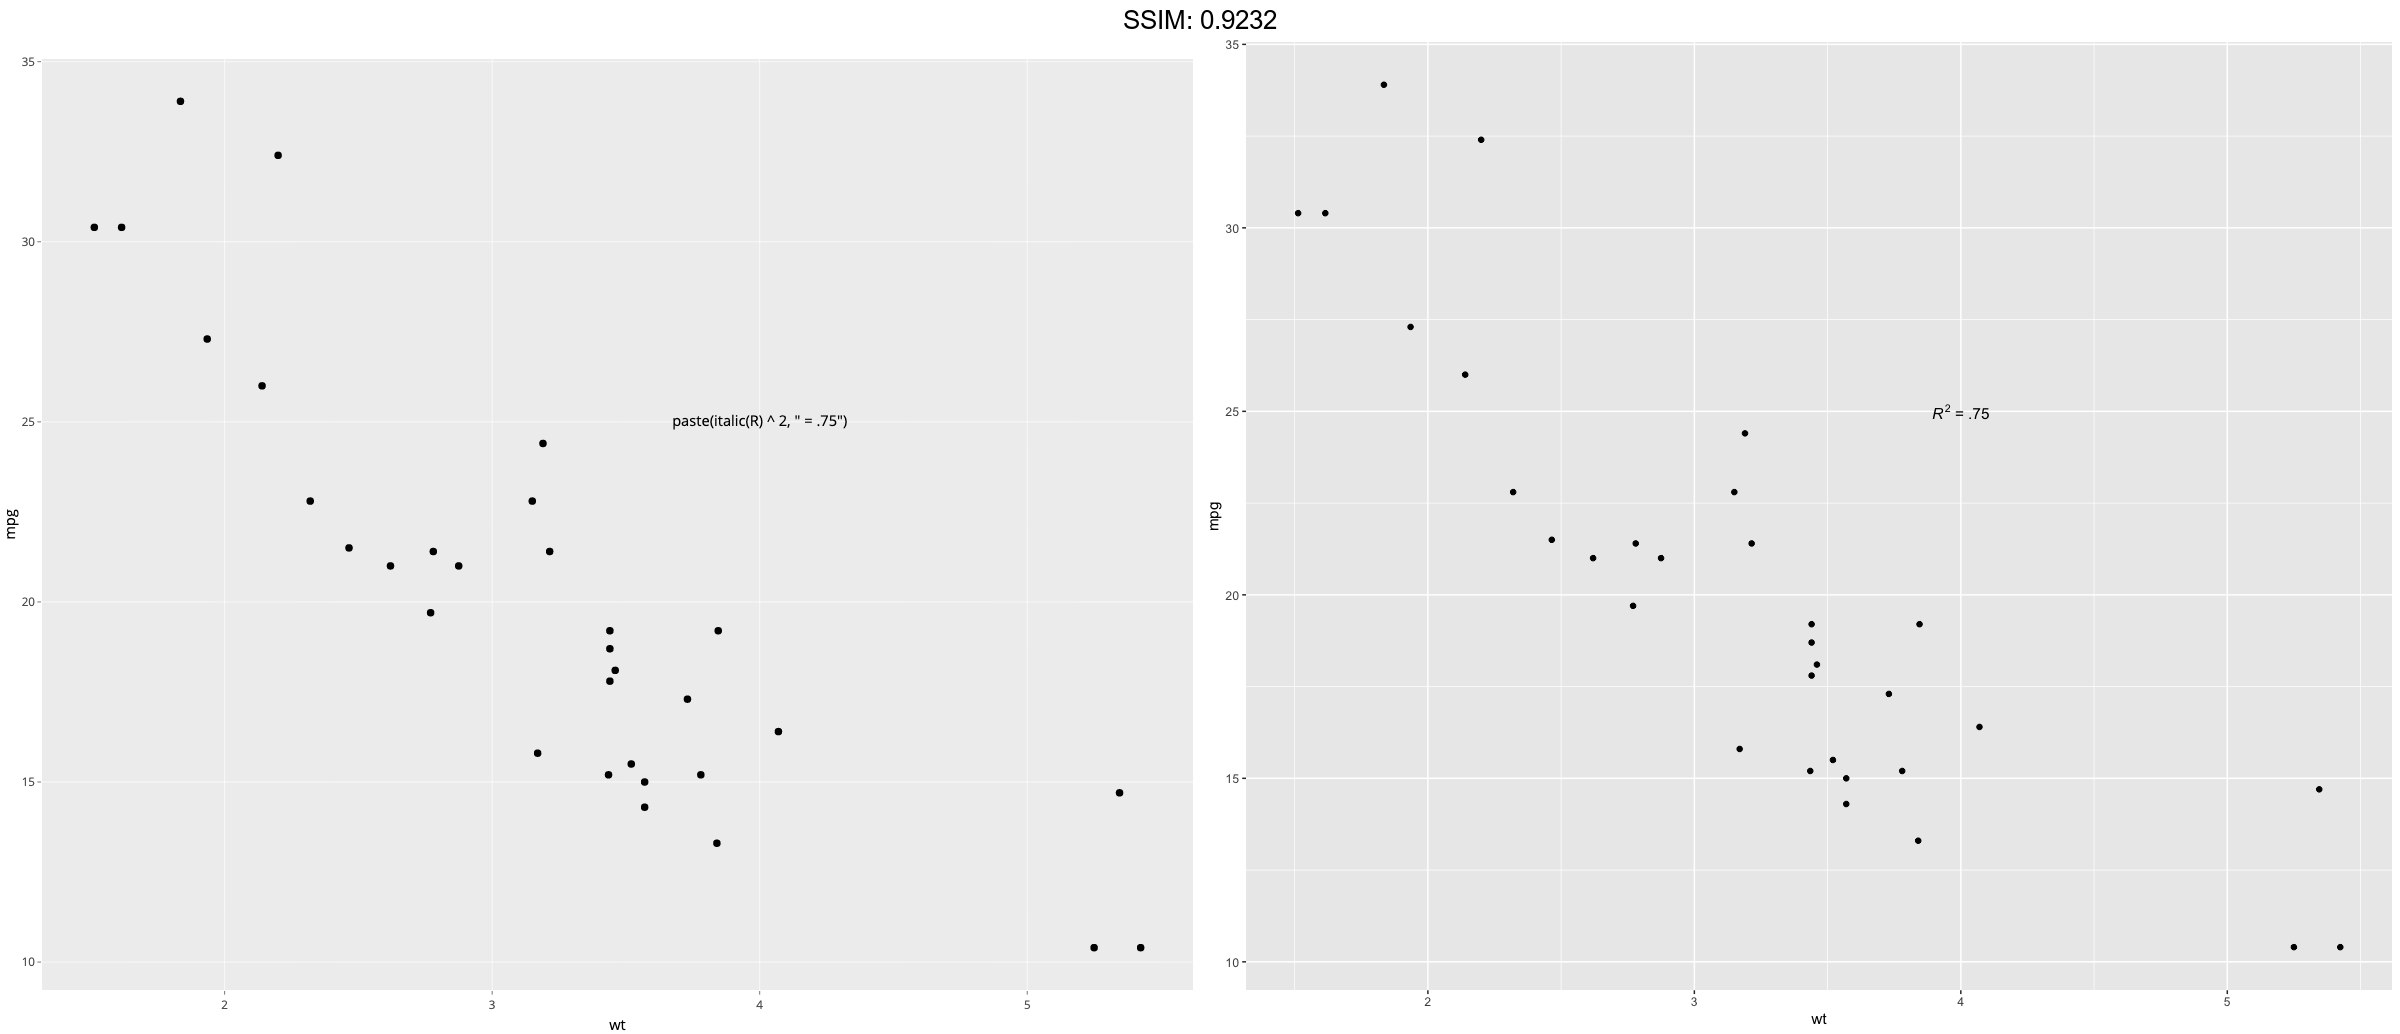
p <- ggplot(mtcars, aes(x = wt, y = mpg)) + geom_point()
p <-
 p + annotate("text", x = 4, y = 25,
  label = "paste(italic(R) ^ 2, \" = .75\")", parse = TRUE)
plotly::ggplotly(p)