GGPLOT - aes_position
Creates position related aesthetics: x, y, xmin, xmax, ymin, ymax, xend, yend and then convert them with ggplotly
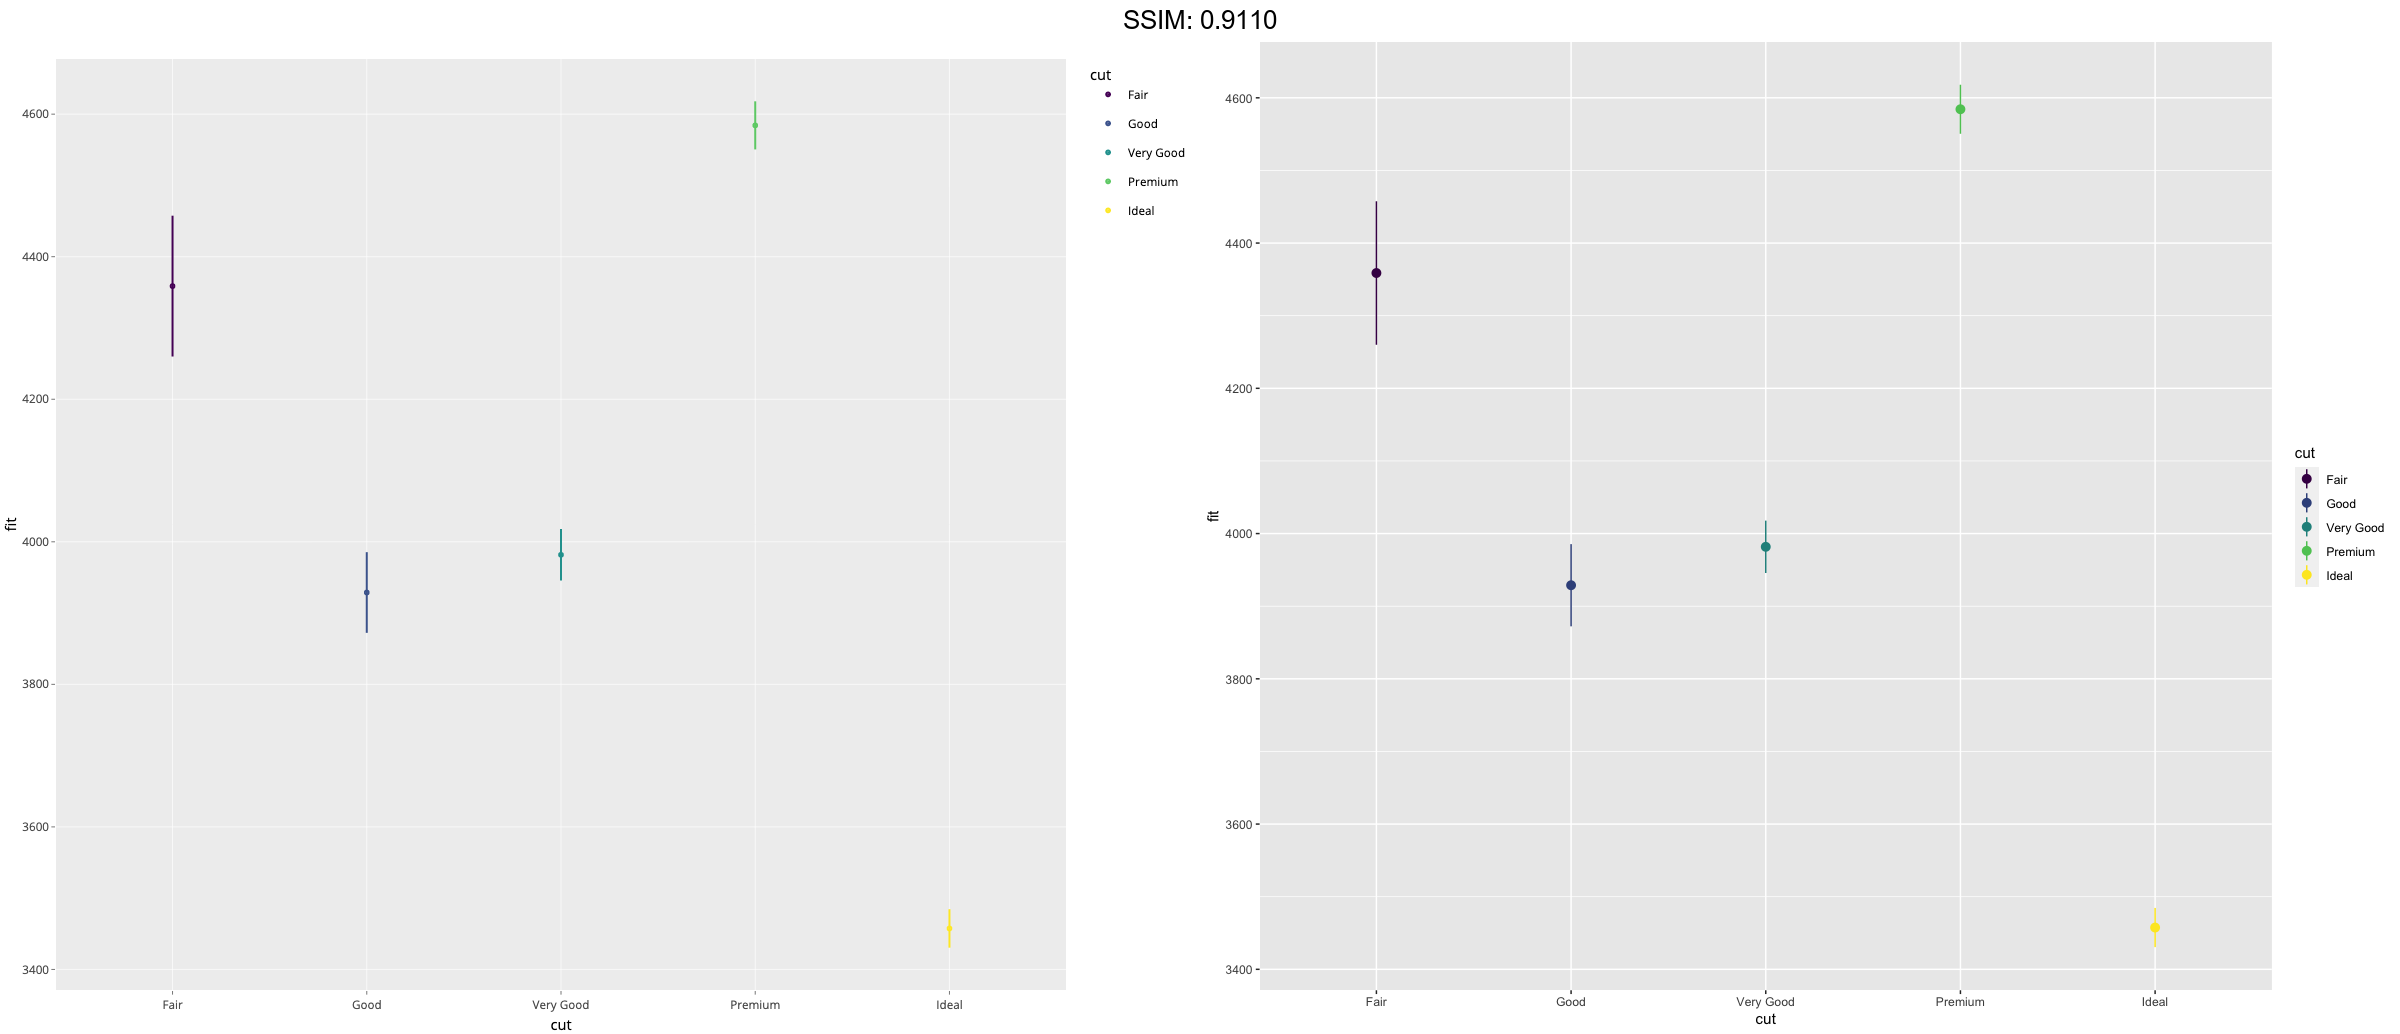
dmod <- lm(price ~ cut, data = diamonds)
cut <- unique(diamonds$cut)
cuts_df <- data.frame(
  cut,
  predict(dmod, data.frame(cut), se = TRUE)[c("fit", "se.fit")]
)
p <-
 ggplot(cuts_df) +
  aes(
   x = cut,
   y = fit,
   ymin = fit - se.fit,
   ymax = fit + se.fit,
   colour = cut
  ) +
  geom_pointrange()
plotly::ggplotly(p)


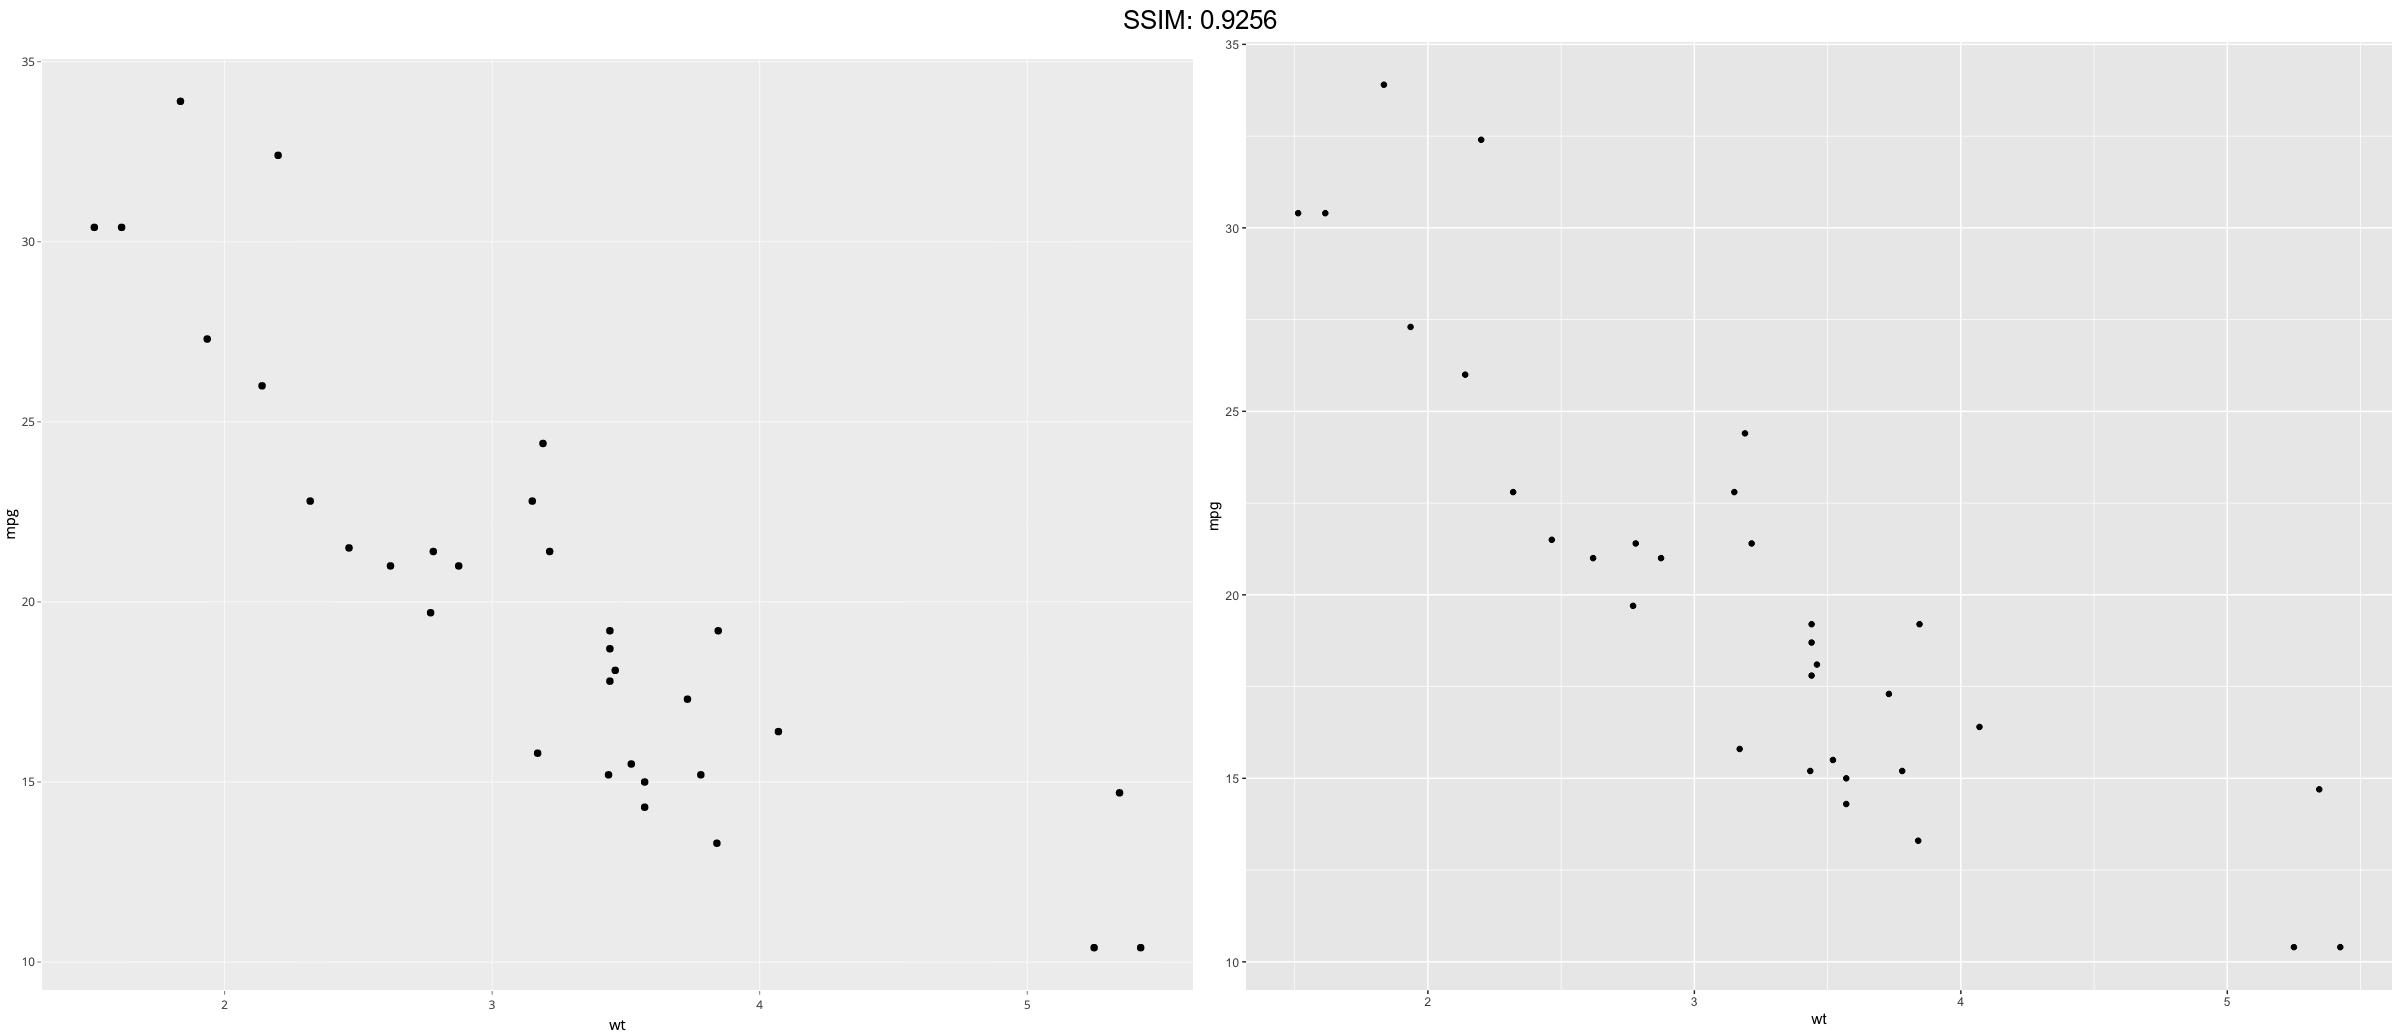
p <- ggplot(mtcars, aes(x = wt, y = mpg)) + geom_point()
plotly::ggplotly(p)

p <- ggplot(mtcars, aes(x = wt, y = mpg)) + geom_point()
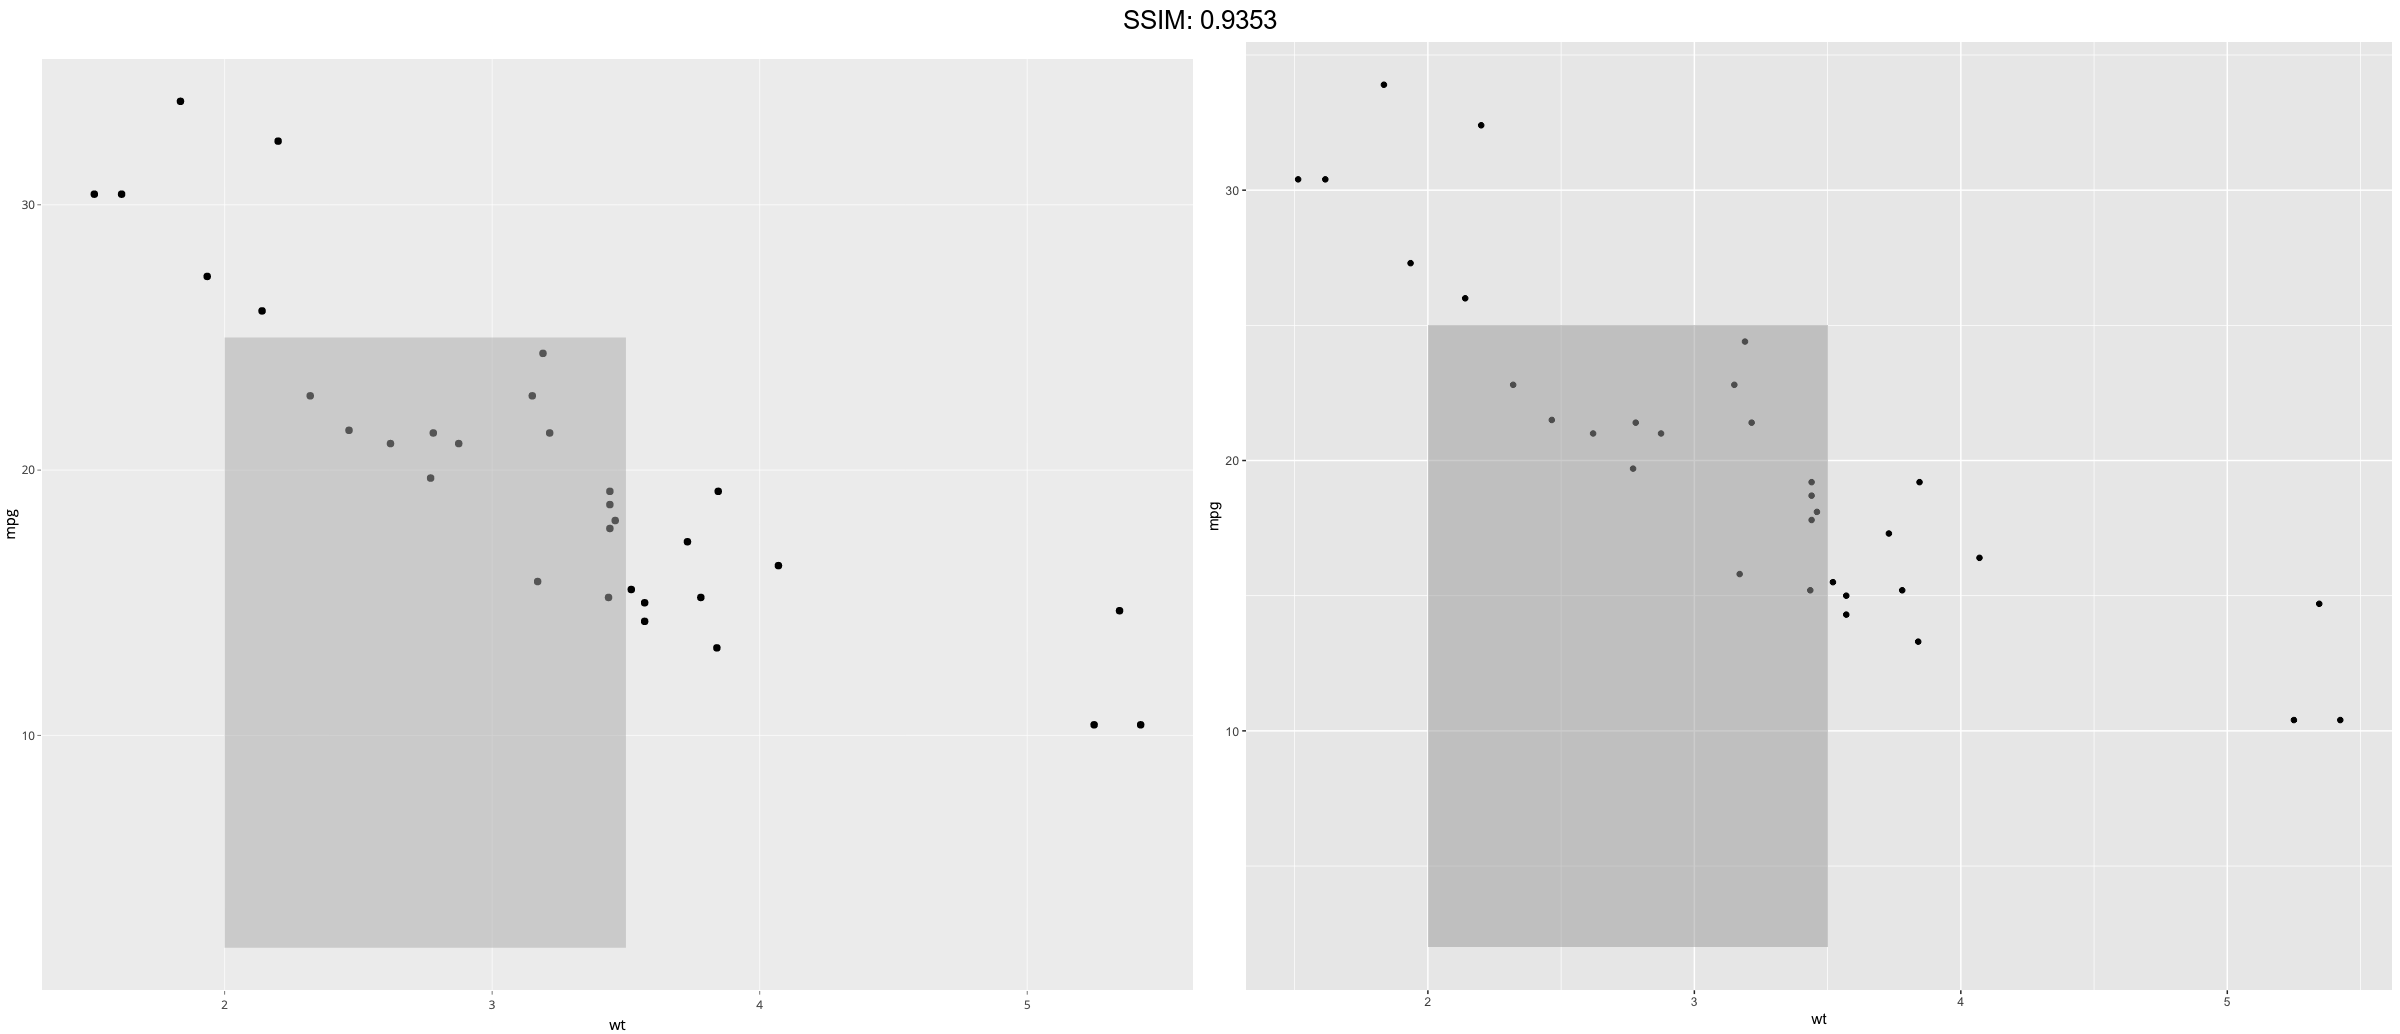
p <-
 p + annotate(
  "rect", xmin = 2, xmax = 3.5, ymin = 2, ymax = 25,
  fill = "dark grey", alpha = .5
)
plotly::ggplotly(p)

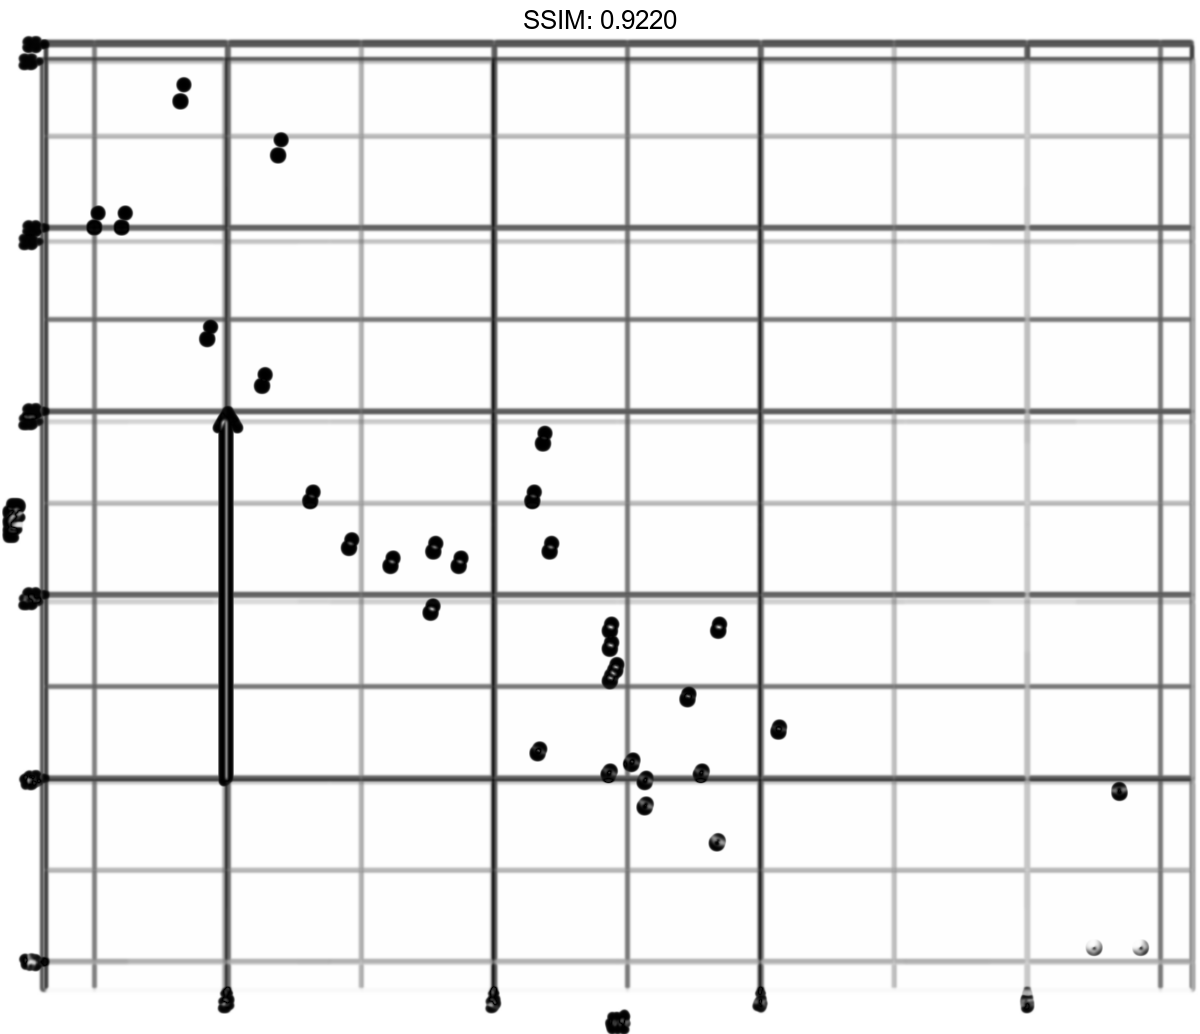
p <- ggplot(mtcars, aes(x = wt, y = mpg)) + geom_point()
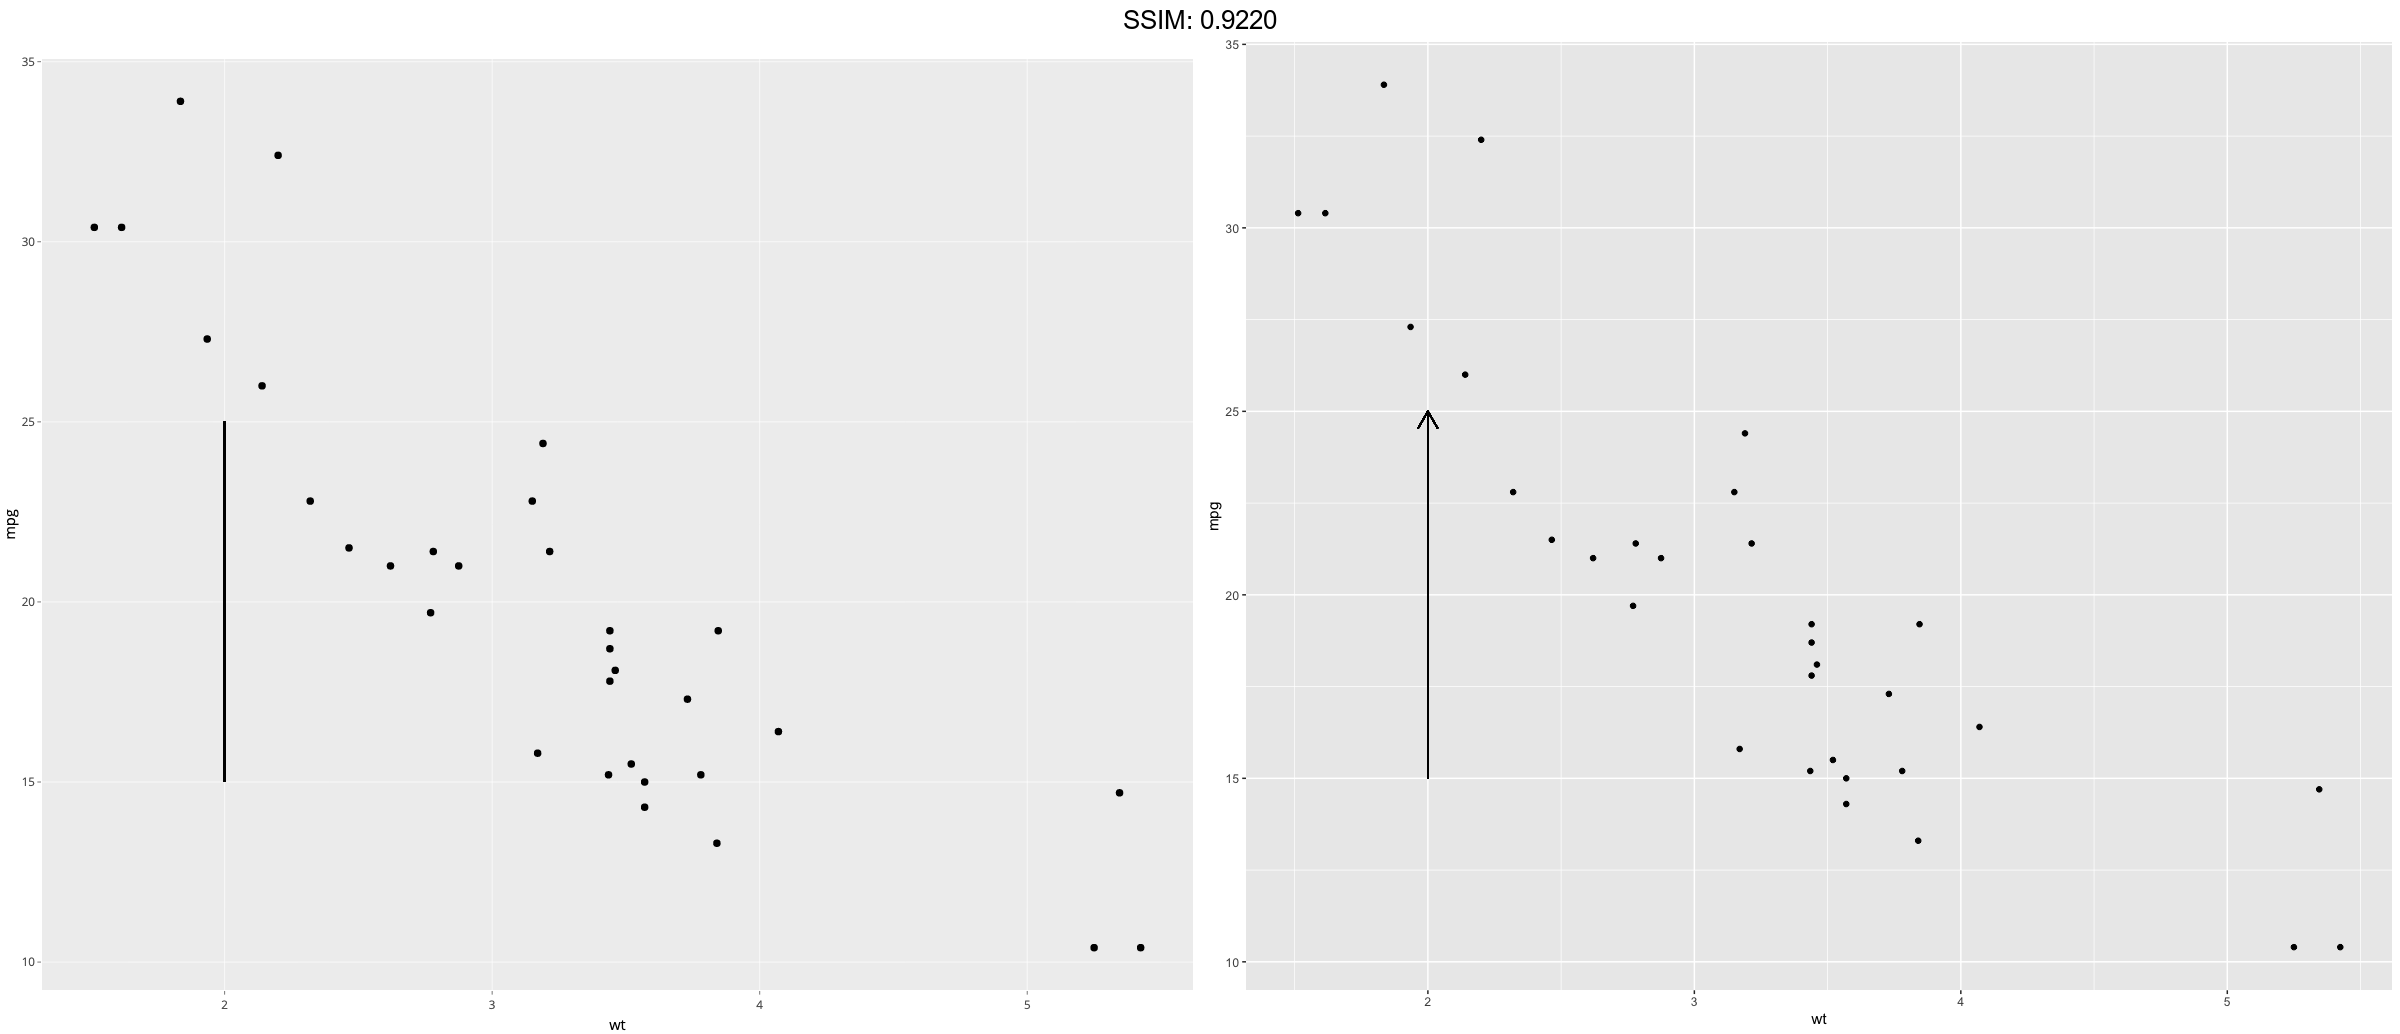
p <-
 p + geom_segment(
  aes(x = 2, y = 15, xend = 2, yend = 25),
  arrow = arrow(length = unit(0.5, "cm"))
)
plotly::ggplotly(p)

p <- ggplot(mtcars, aes(x = wt, y = mpg)) + geom_point()
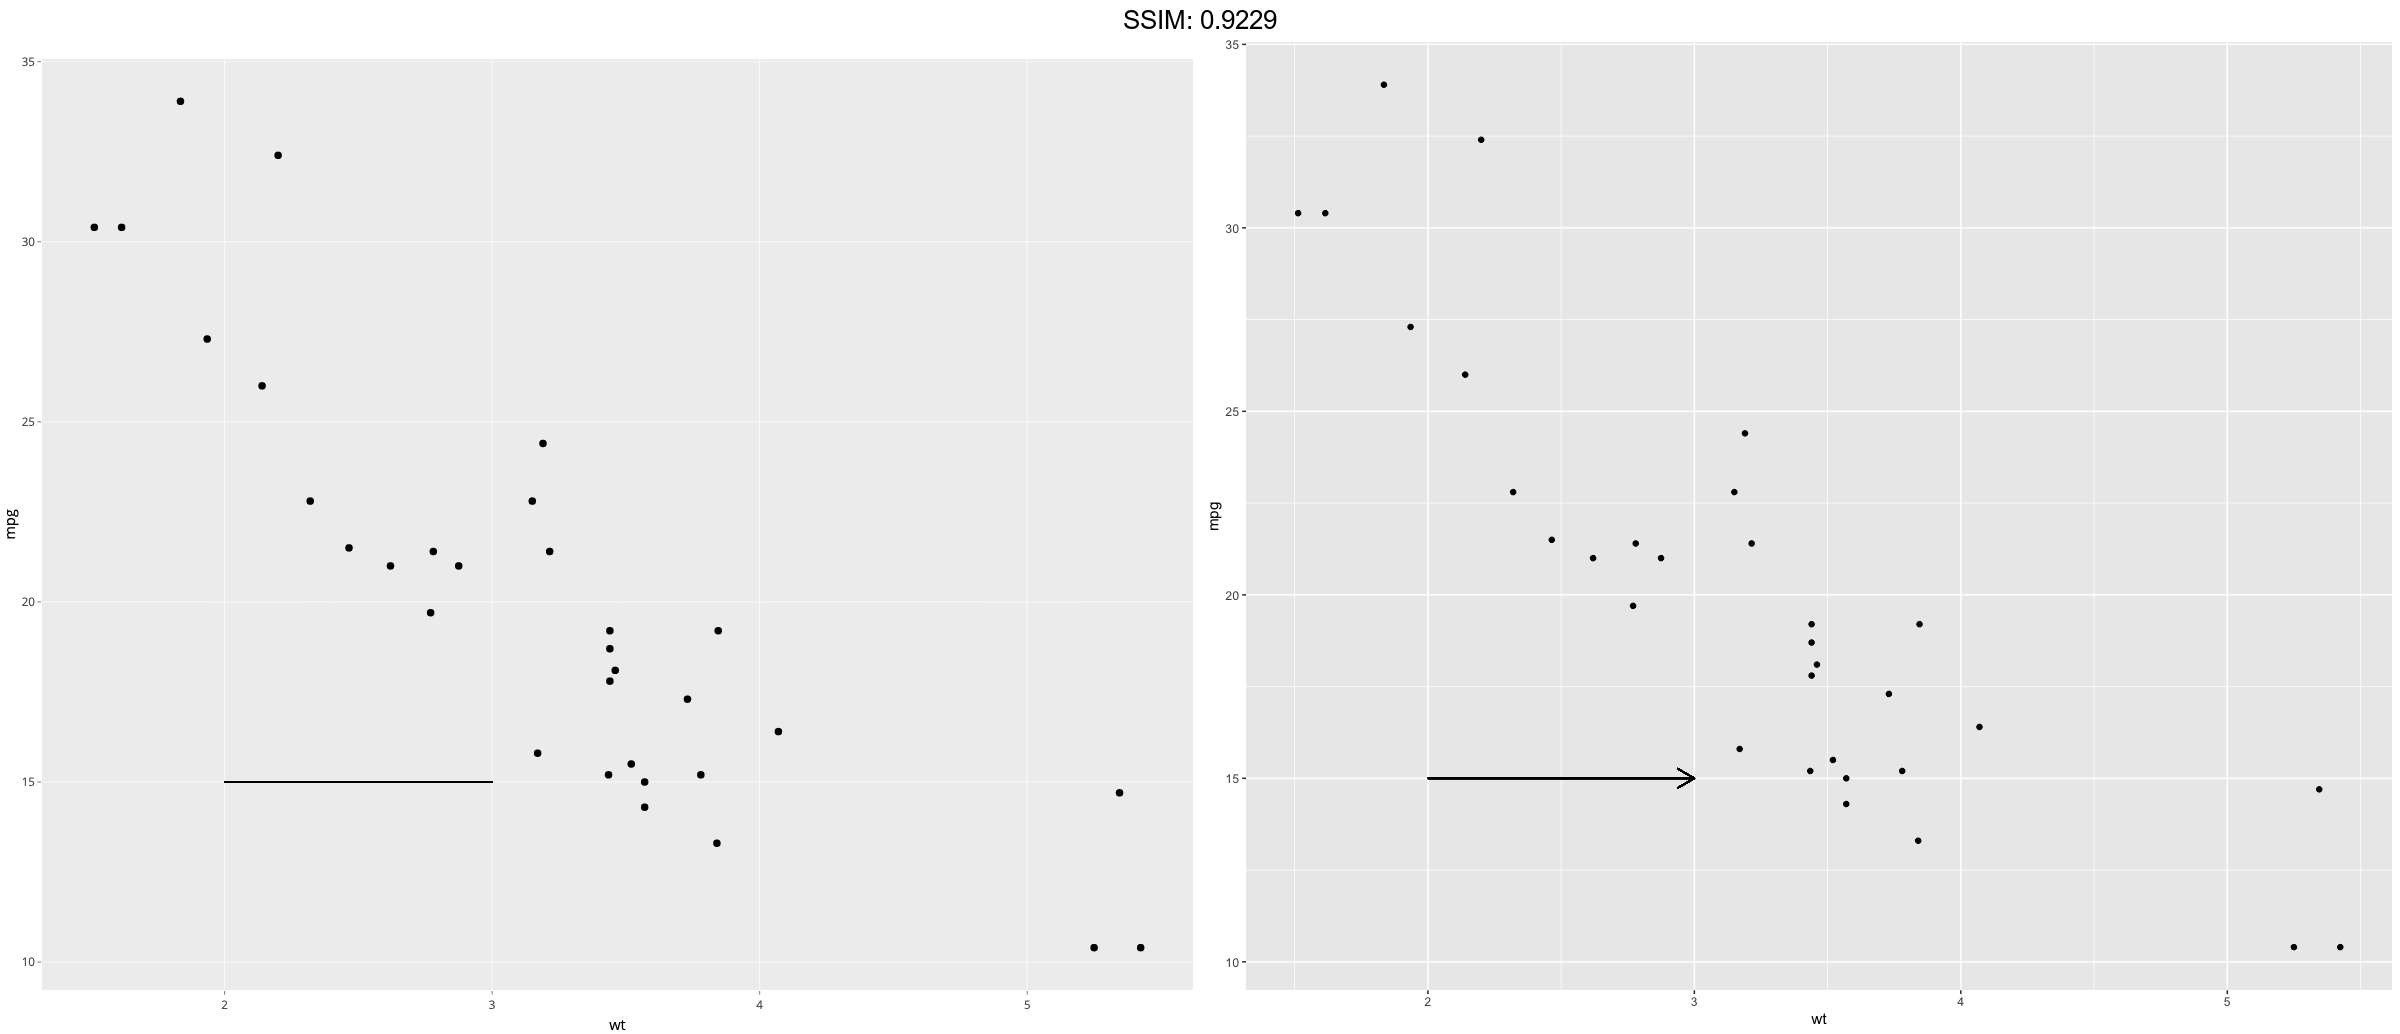
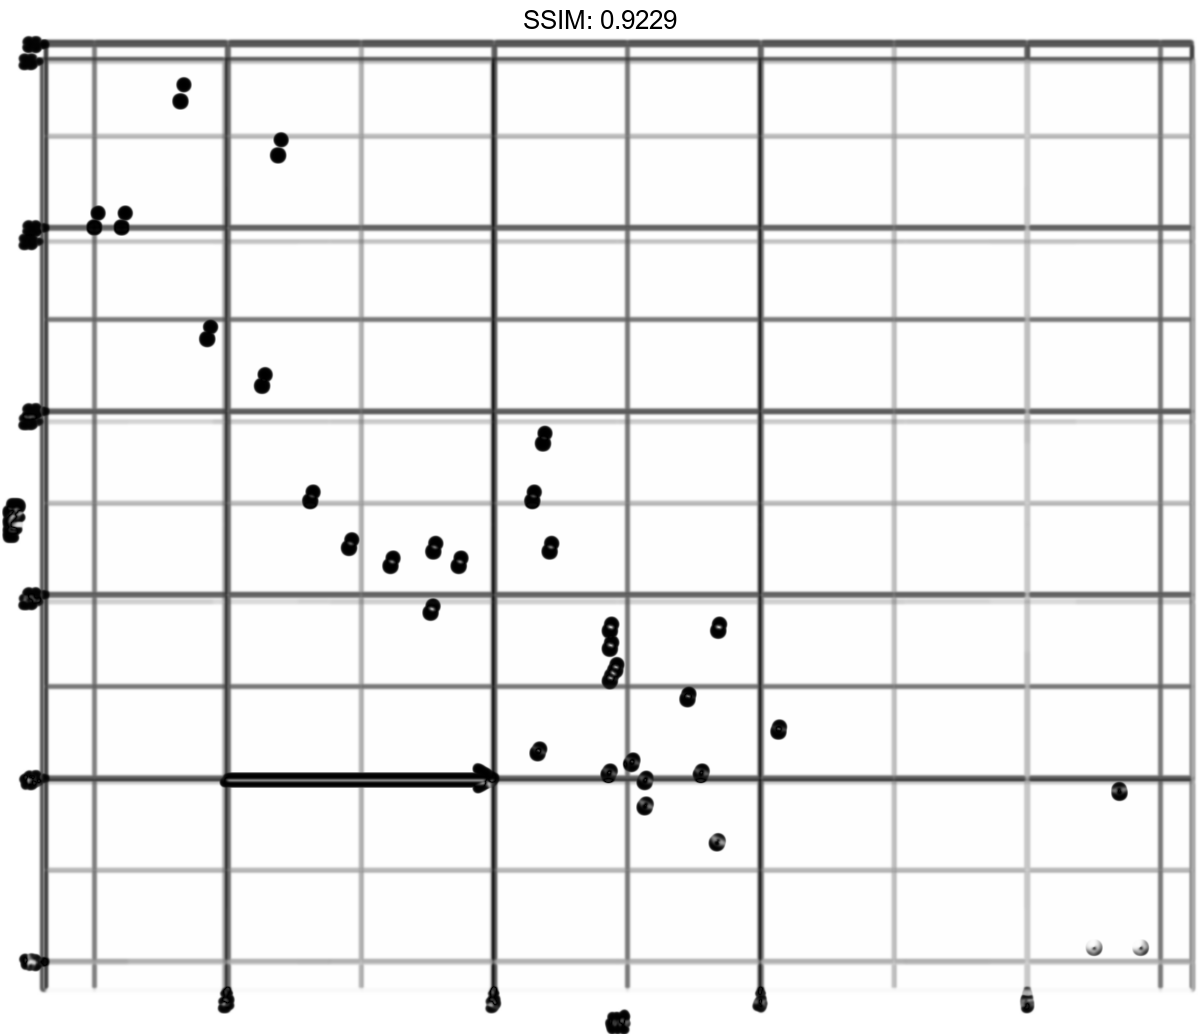
p <-
 p + geom_segment(
  aes(x = 2, y = 15, xend = 3, yend = 15),
  arrow = arrow(length = unit(0.5, "cm"))
)
plotly::ggplotly(p)

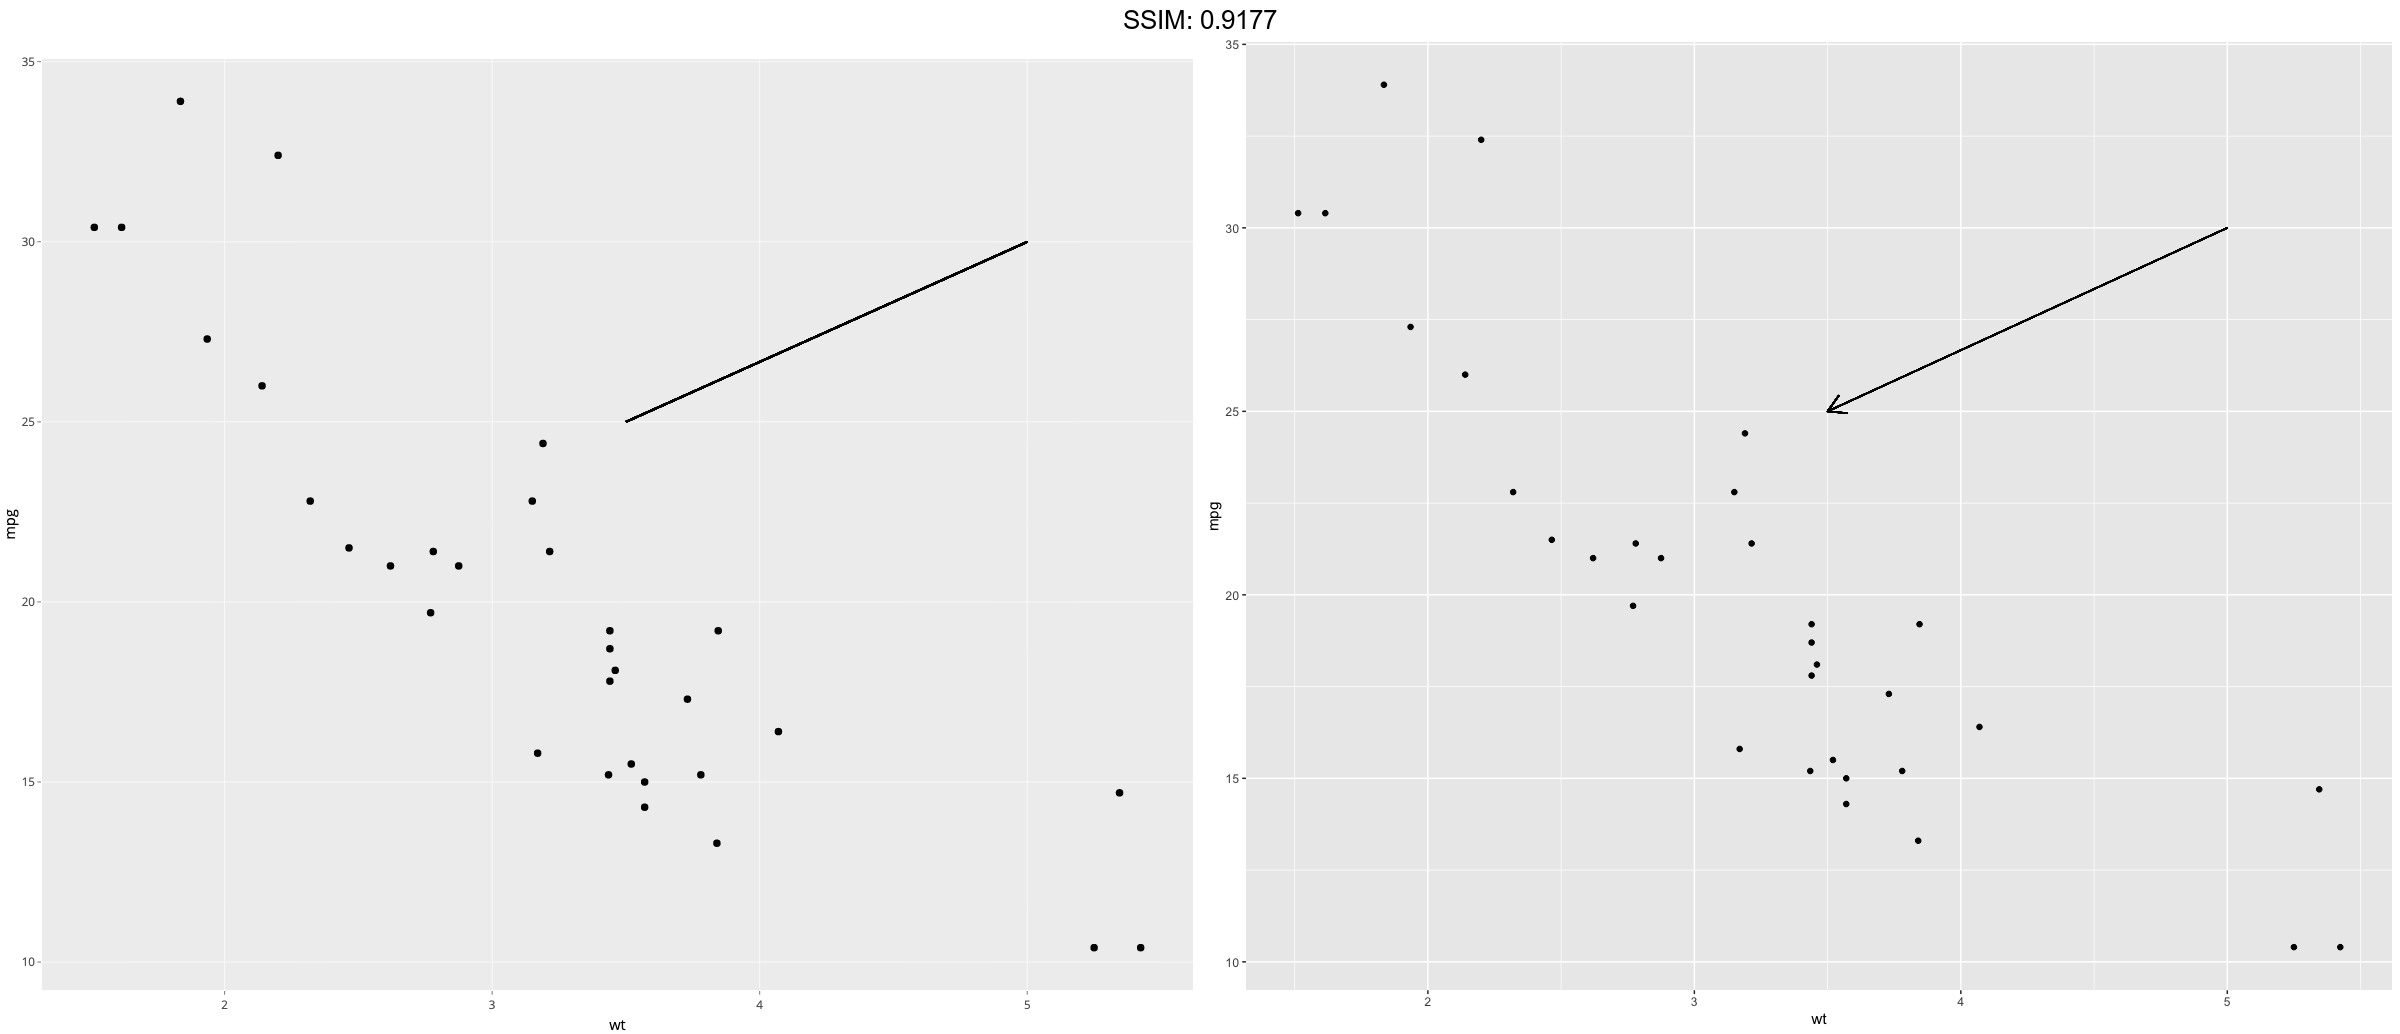
p <- ggplot(mtcars, aes(x = wt, y = mpg)) + geom_point()
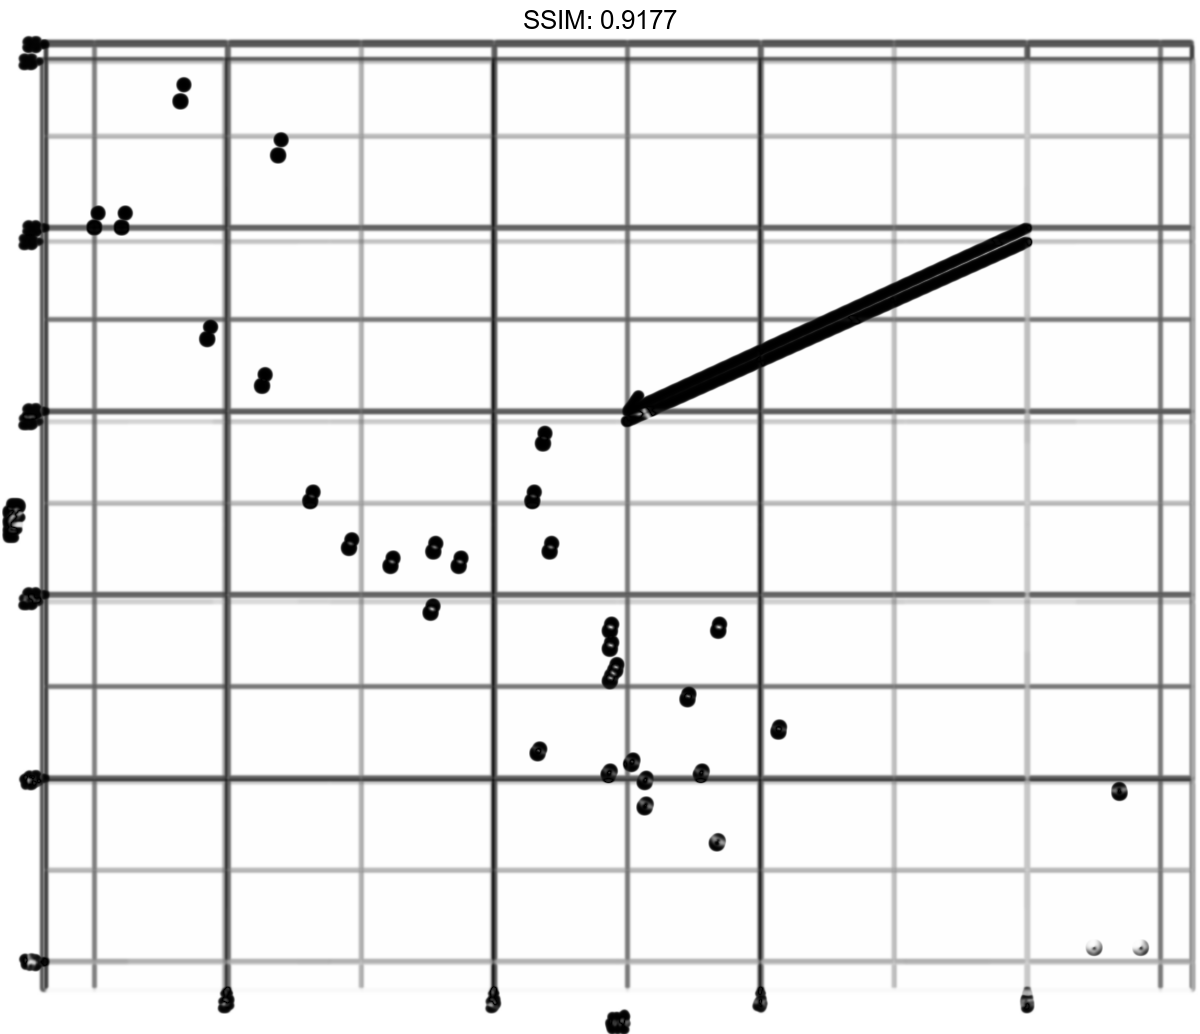
p <-
 p + geom_segment(
  aes(x = 5, y = 30, xend = 3.5, yend = 25),
  arrow = arrow(length = unit(0.5, "cm"))
)
plotly::ggplotly(p)


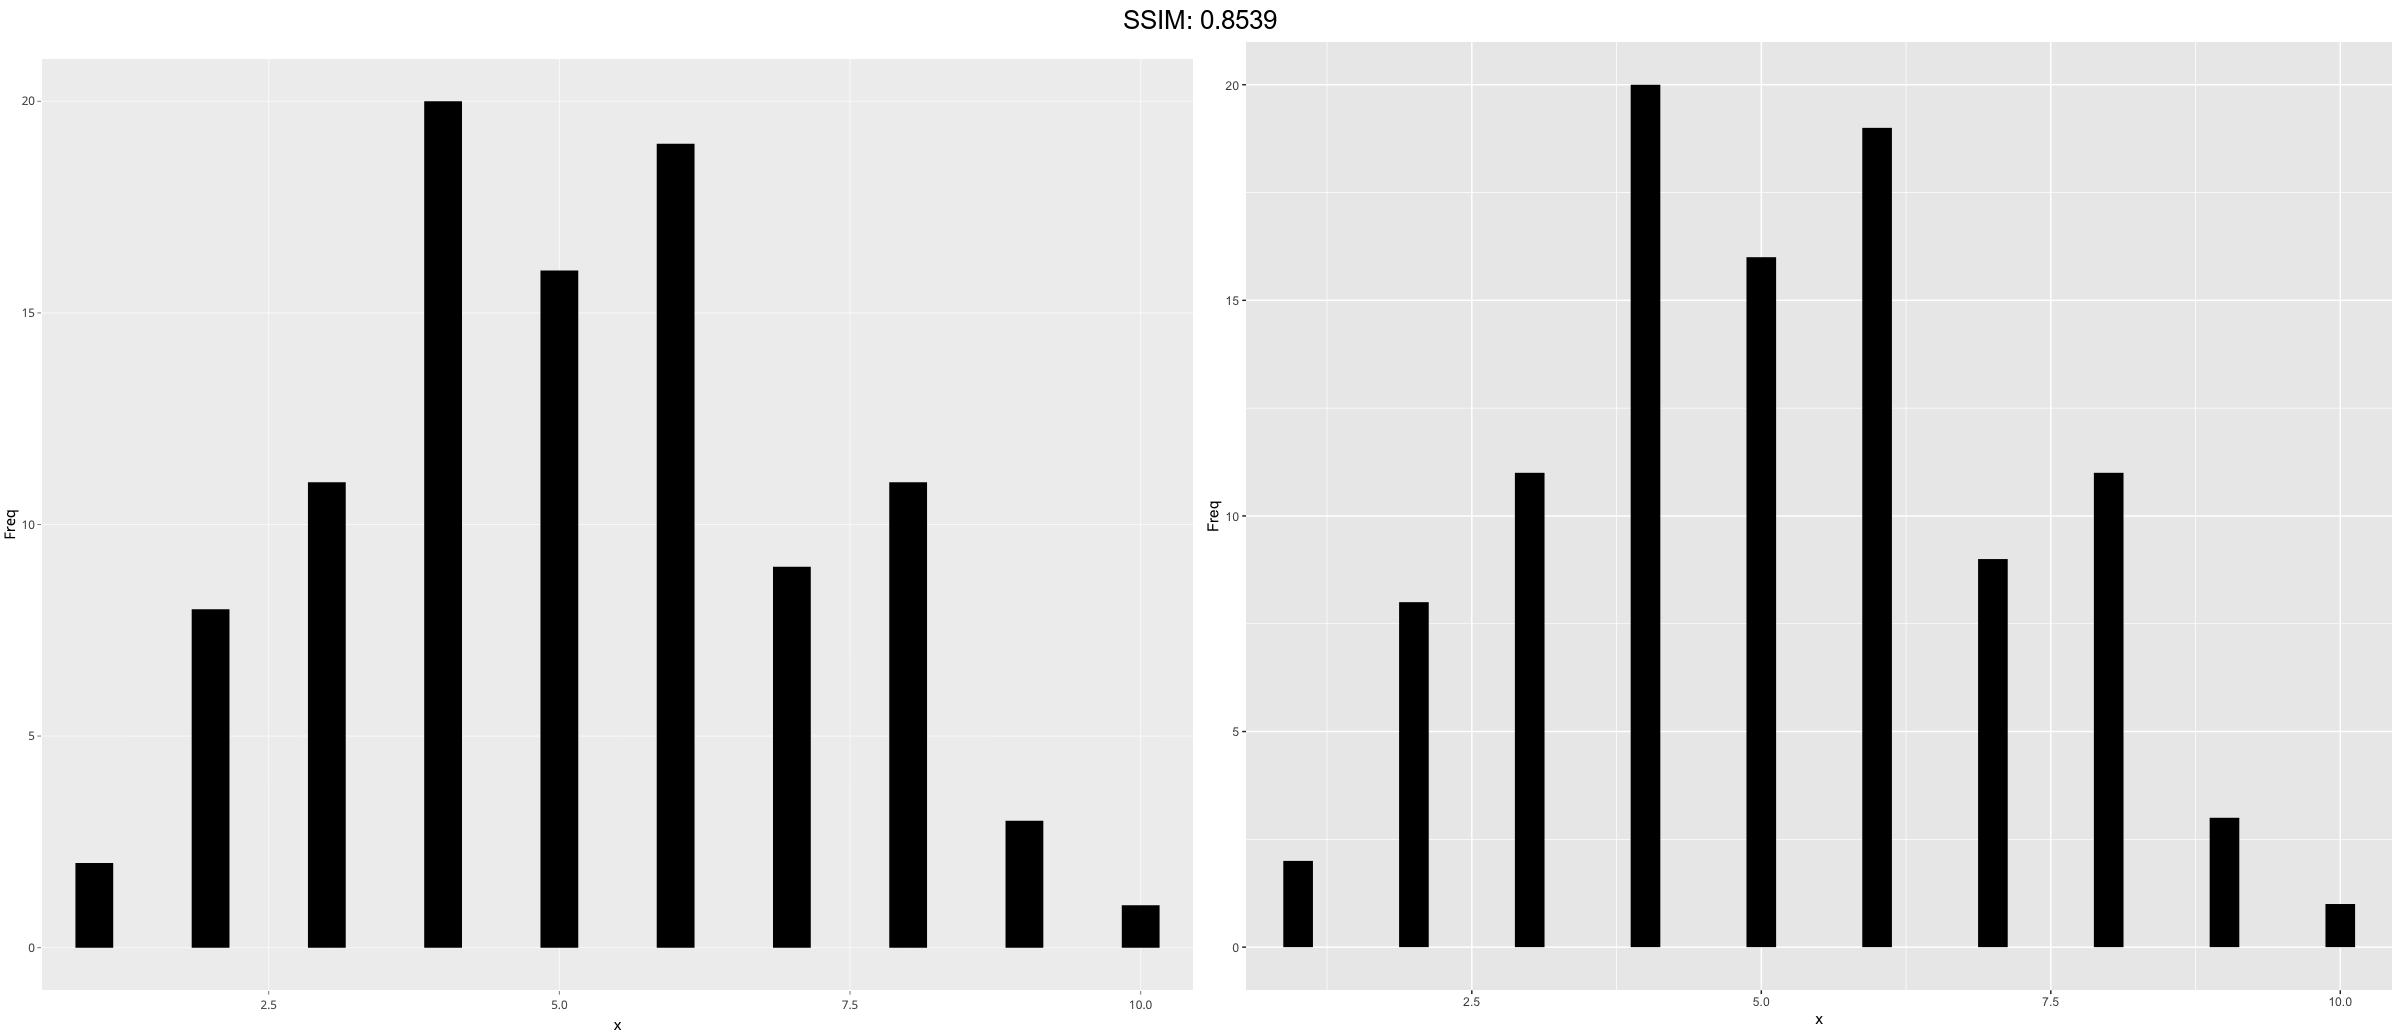
counts <- as.data.frame(table(x = rpois(100, 5)))
counts$x <- as.numeric(as.character(counts$x))
p <-  with(counts, plot(x, Freq, type = "h", lwd = 10))
plotly::ggplotly(p)

counts <- as.data.frame(table(x = rpois(100, 5)))
counts$x <- as.numeric(as.character(counts$x))
p <-
 ggplot(counts, aes(x = x, y = Freq)) +
  geom_segment(aes(yend = 0, xend = x), size = 10)
plotly::ggplotly(p)

