GGPLOT - aes_linetype_size_shape
Modify the appearance of lines and/or points and then convert them with ggplotly
df <- data.frame(x = 1:10 , y = 1:10)
p <- ggplot(df, aes(x, y))
p <-  p + geom_line(linetype = 2)
plotly::ggplotly(p)

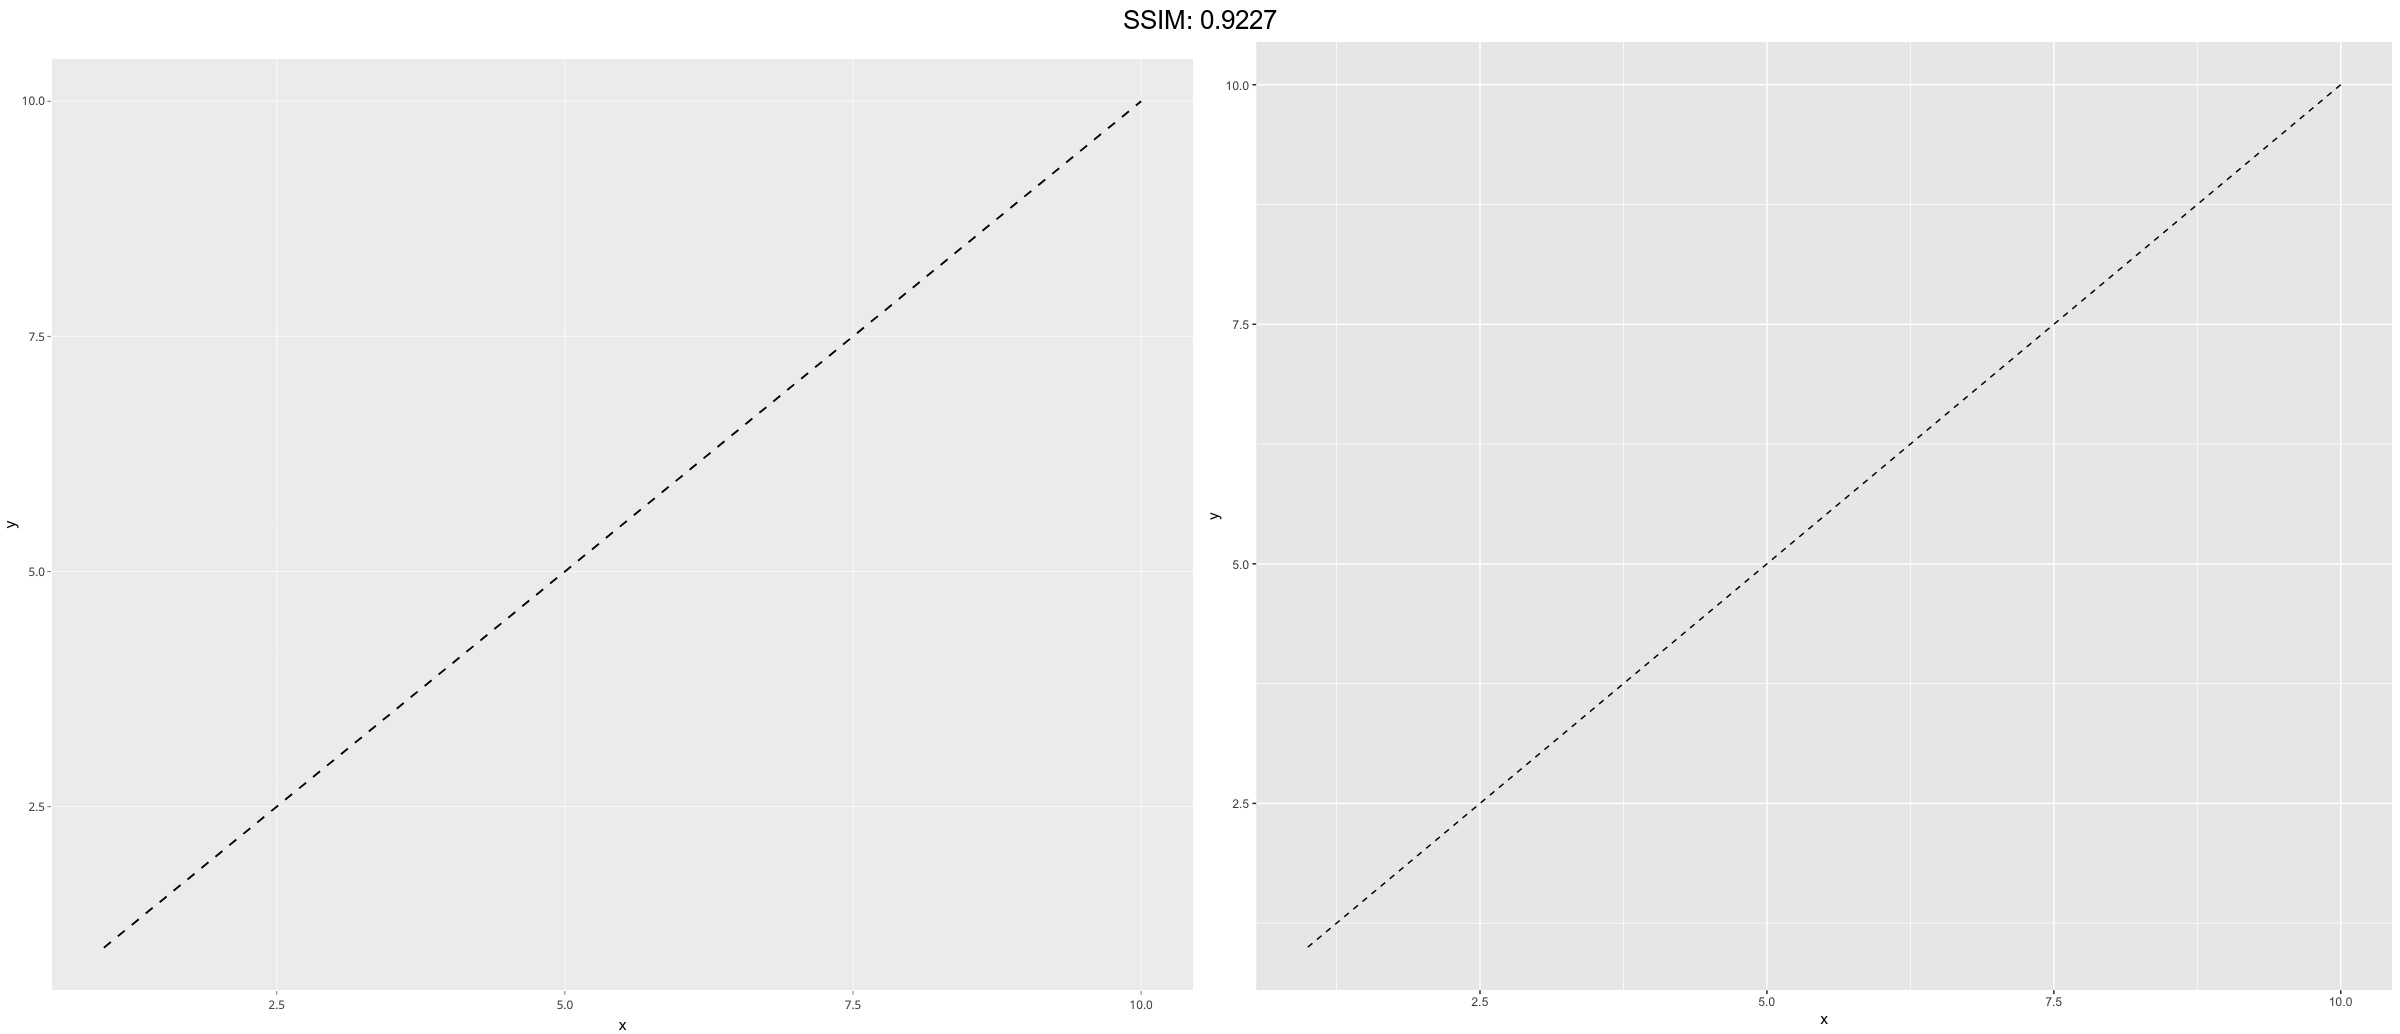

df <- data.frame(x = 1:10 , y = 1:10)
p <- ggplot(df, aes(x, y))
p <-  p + geom_line(linetype = "dotdash")
plotly::ggplotly(p)

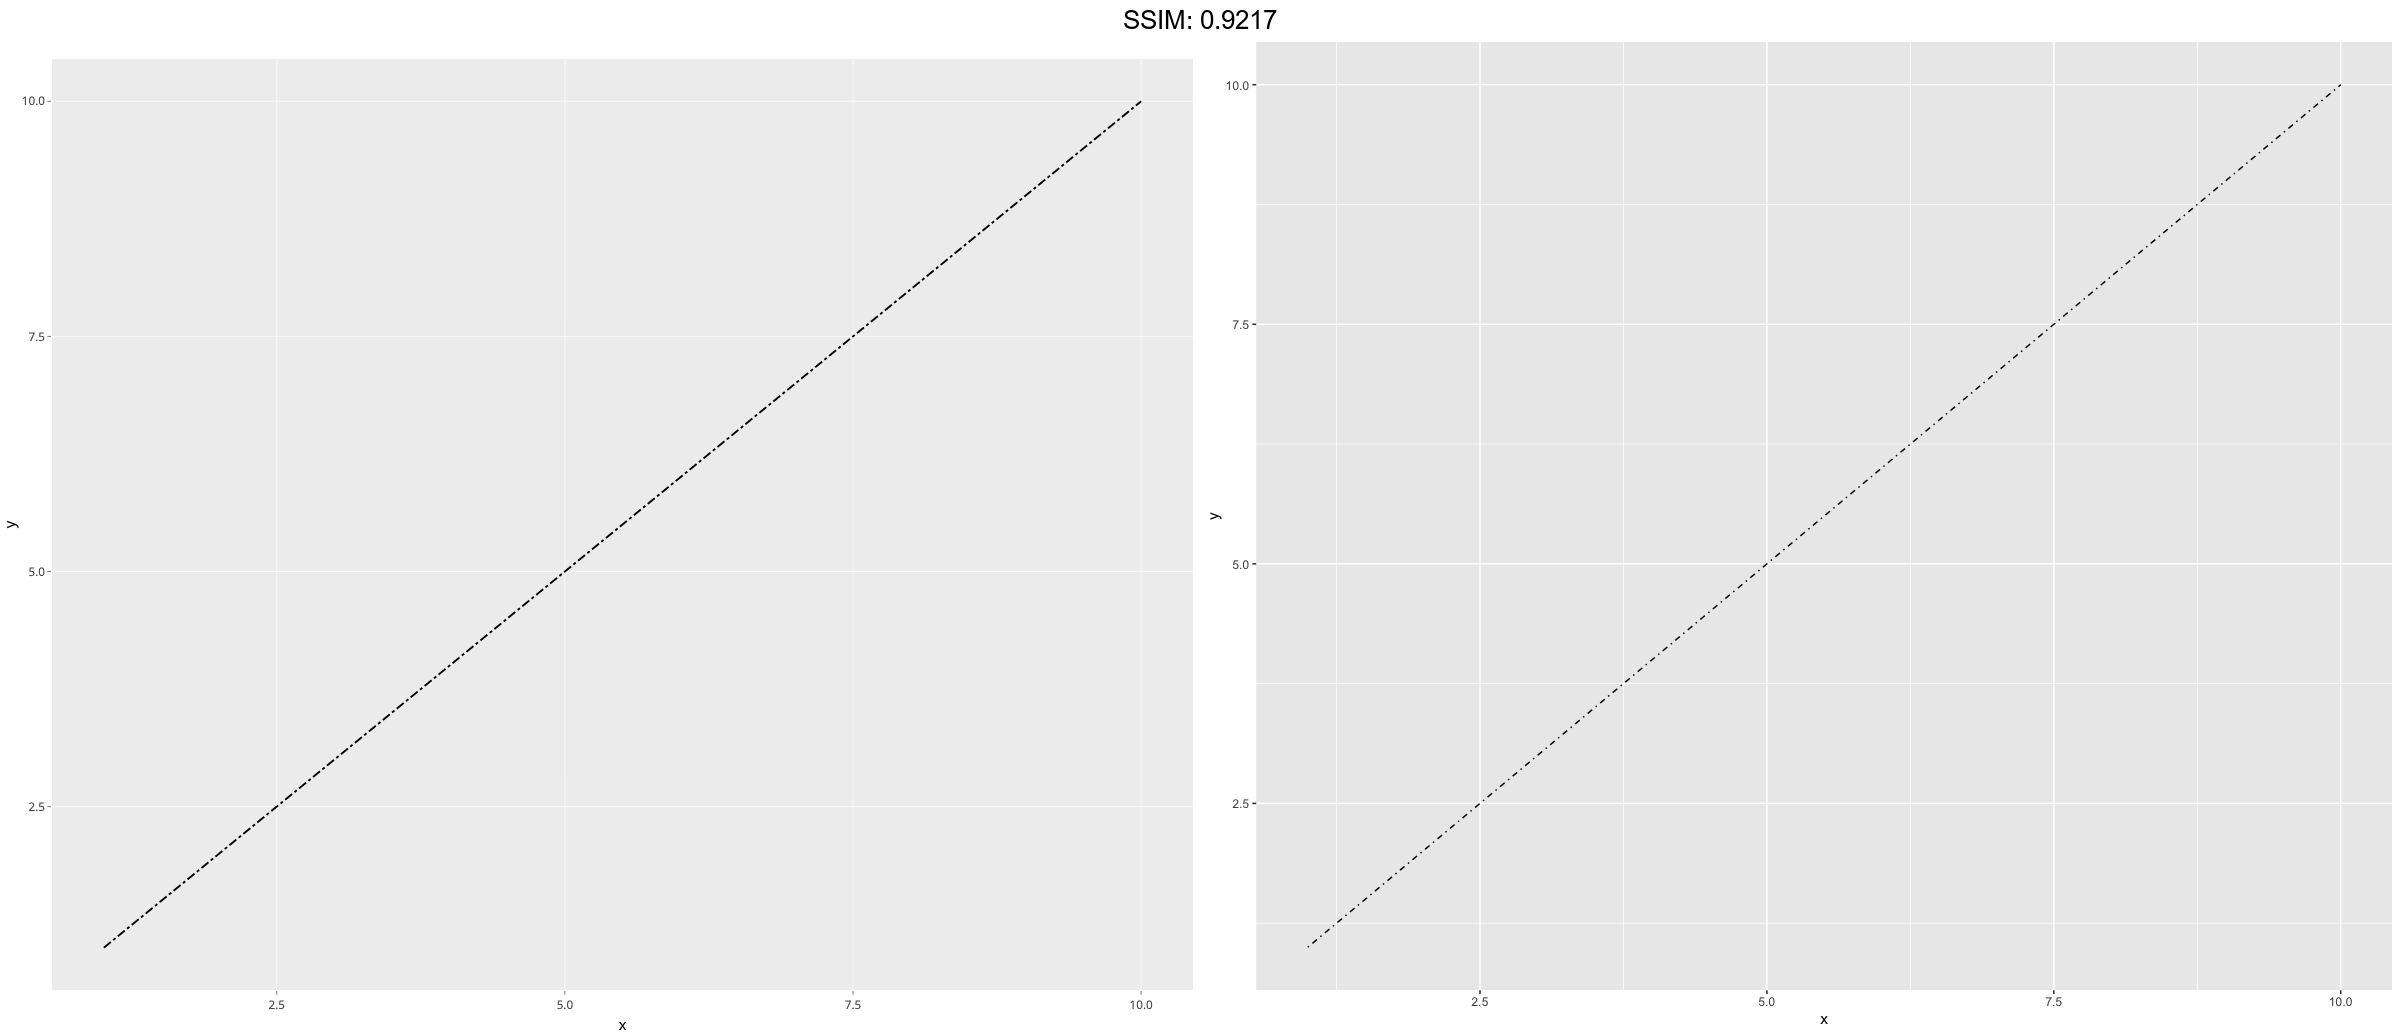

df <- data.frame(x = 1:10 , y = 1:10)
p <- ggplot(df, aes(x, y))
p <-  p + geom_line(linetype = "3313")
plotly::ggplotly(p)


p <-
 ggplot(economics_long, aes(date, value01)) +
  geom_line(aes(linetype = variable))
plotly::ggplotly(p)


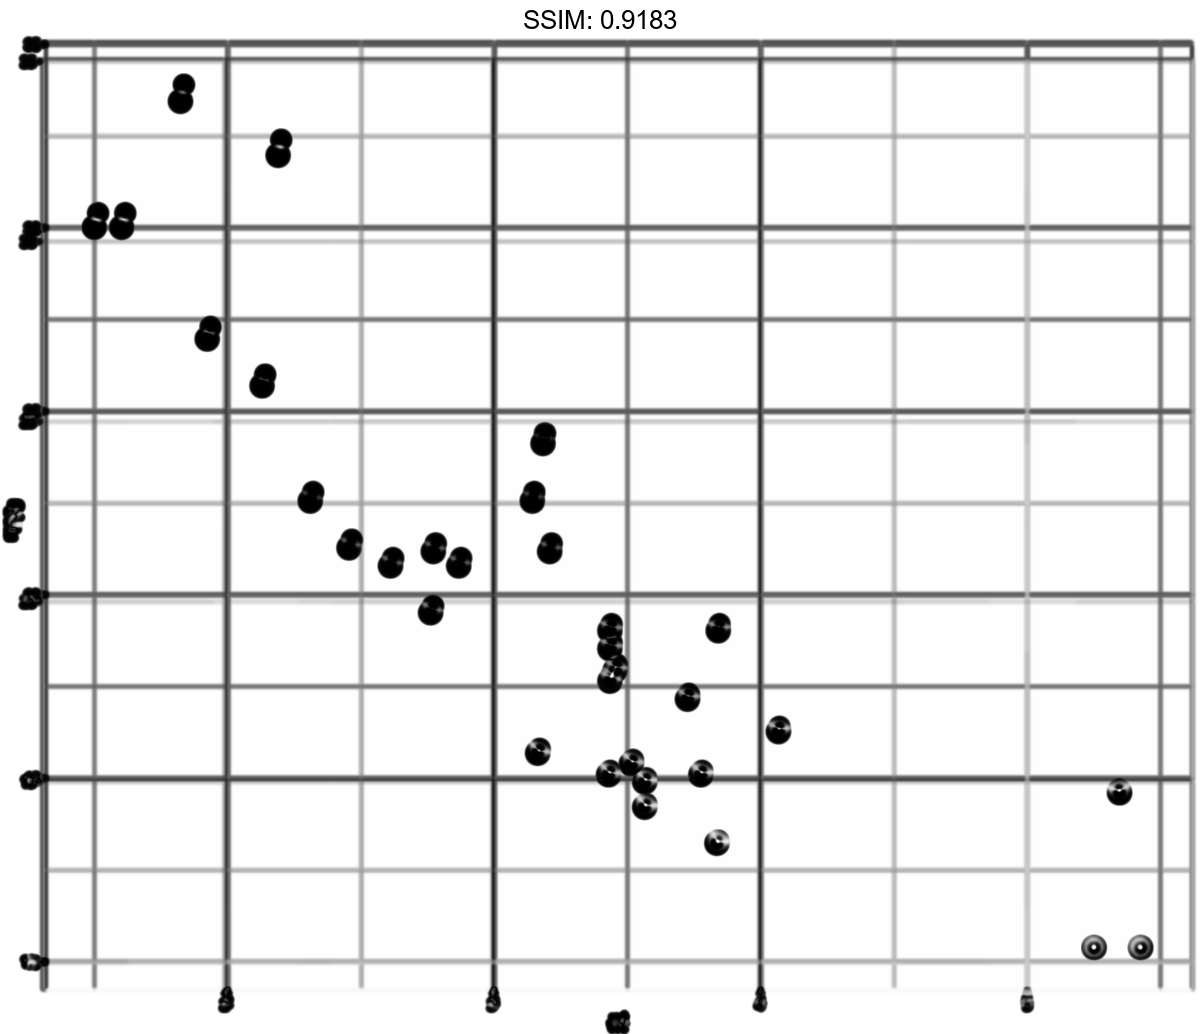
p <- ggplot(mtcars, aes(wt, mpg))
p <-  p + geom_point(size = 4)
plotly::ggplotly(p)


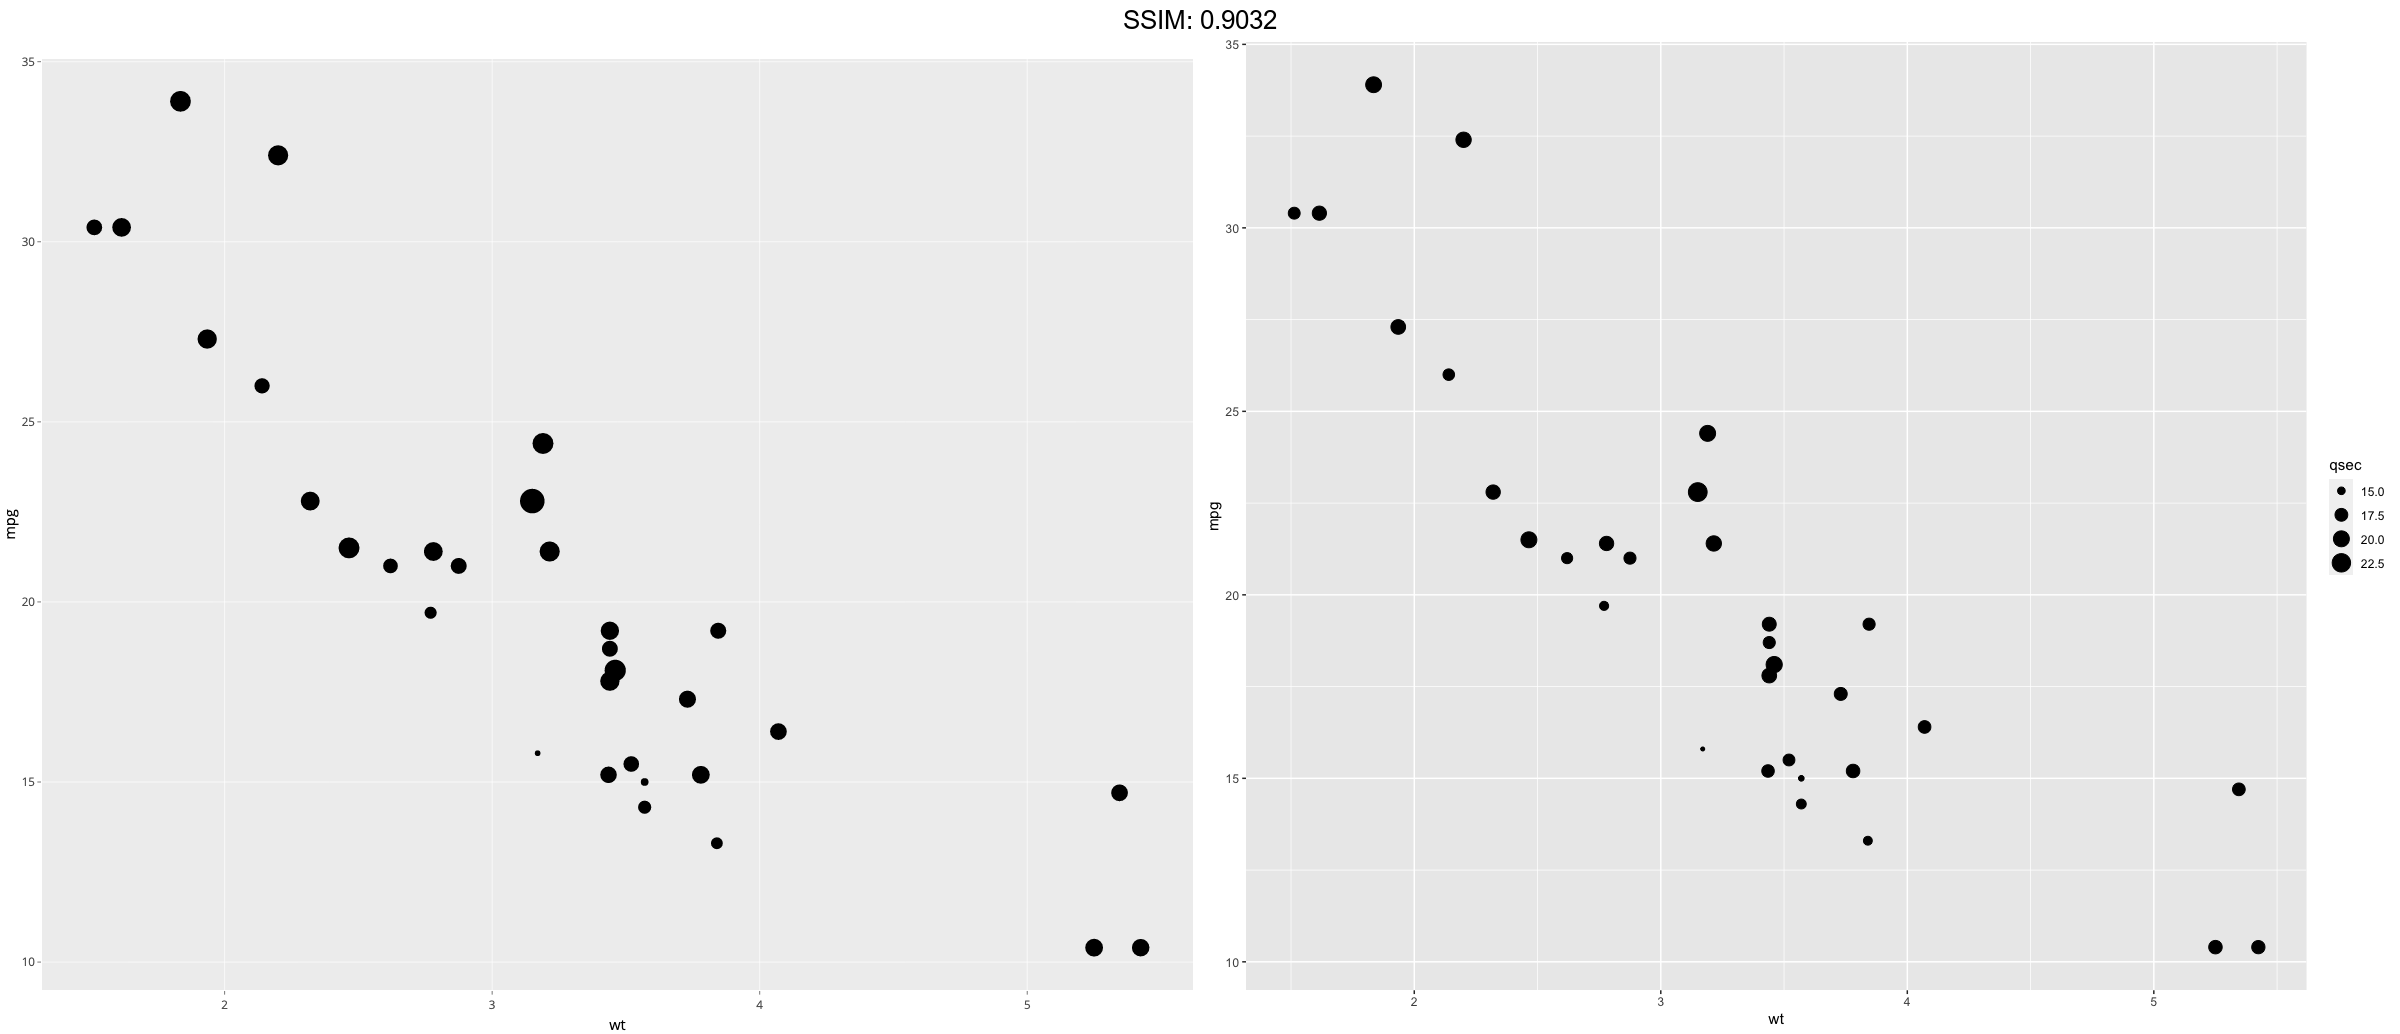
p <- ggplot(mtcars, aes(wt, mpg))
p <-  p + geom_point(aes(size = qsec))
plotly::ggplotly(p)

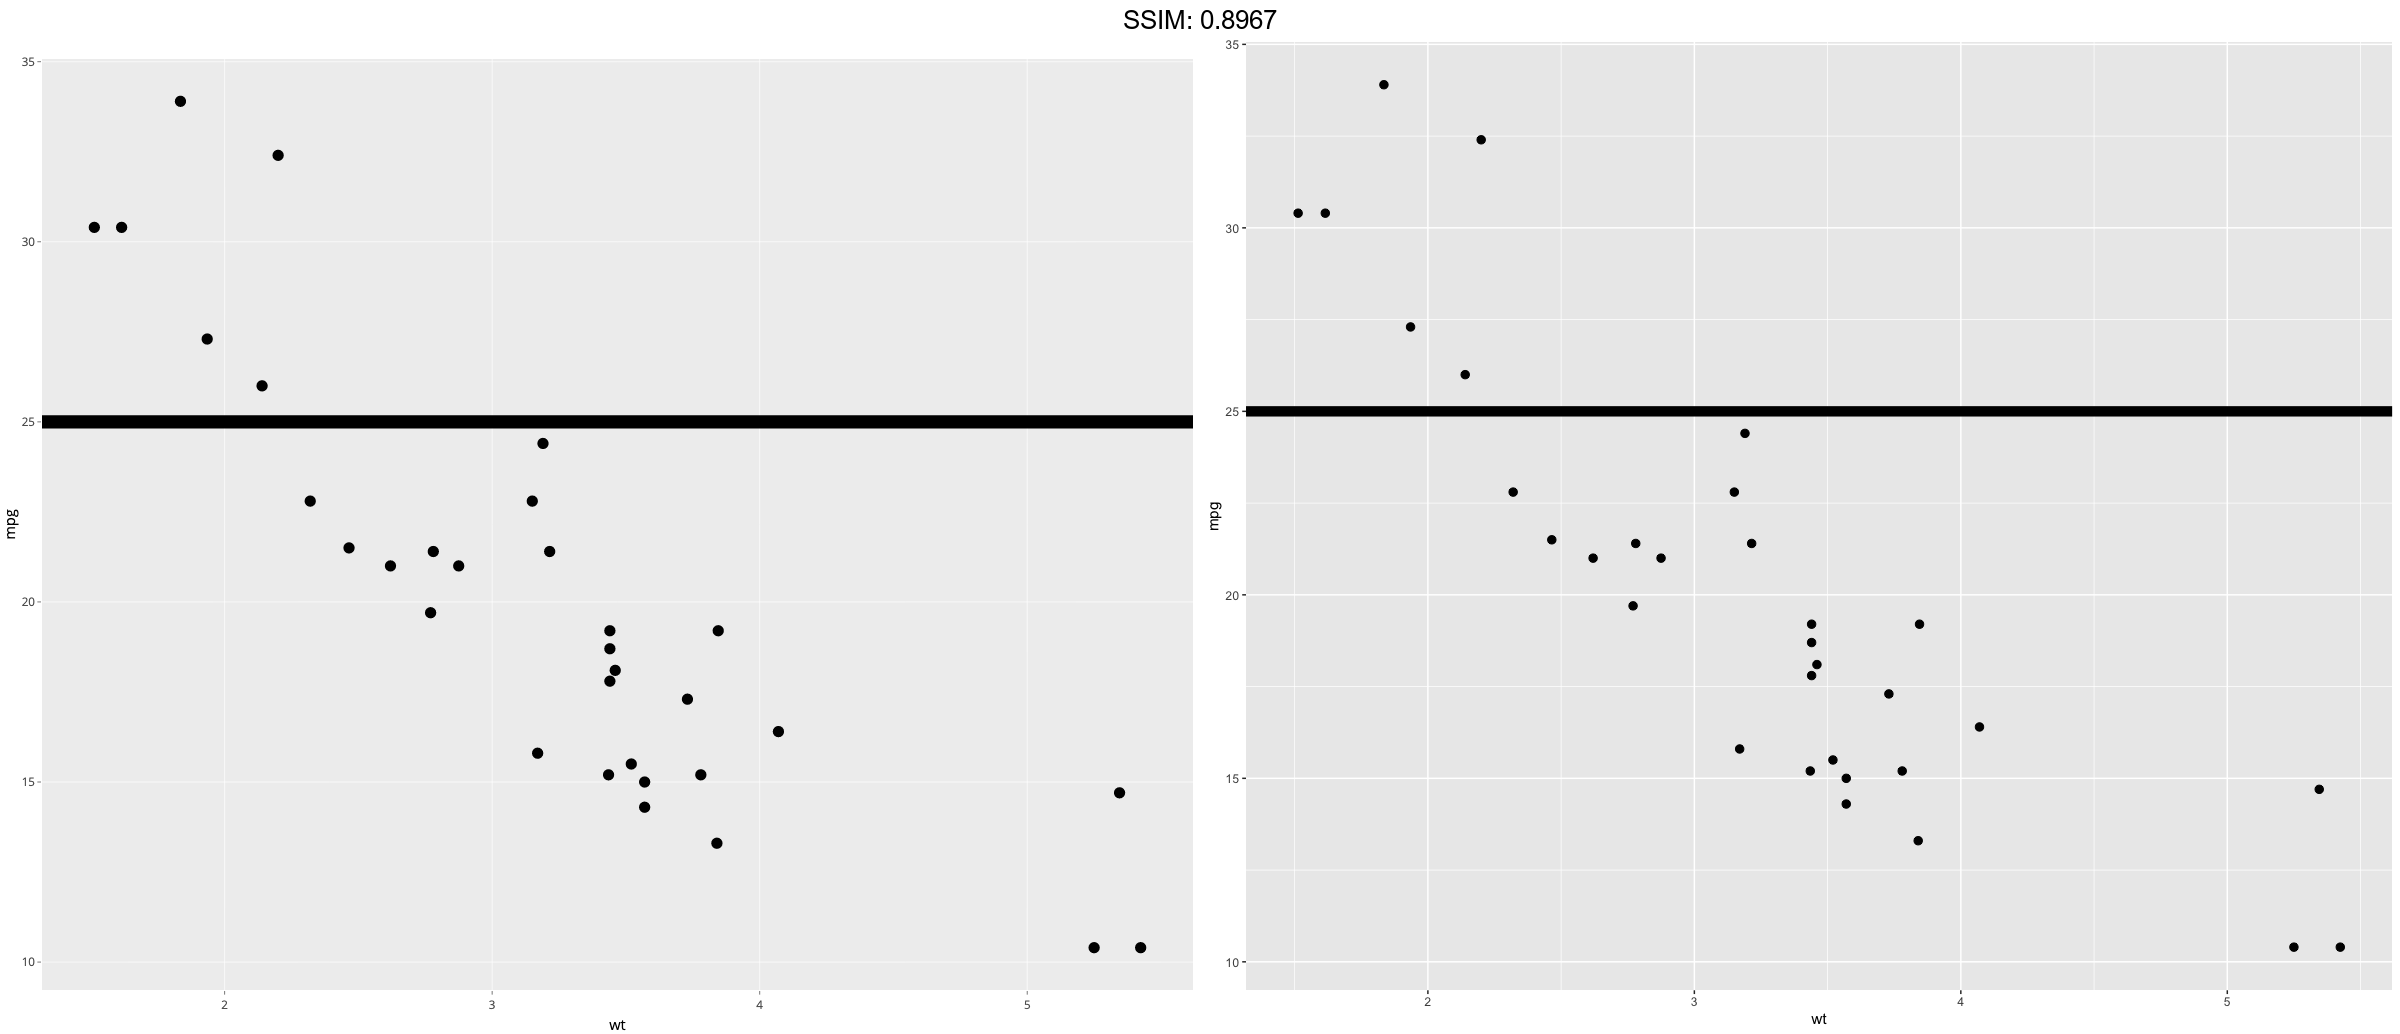
p <- ggplot(mtcars, aes(wt, mpg))
p <-
 p + geom_point(size = 2.5) +
  geom_hline(yintercept = 25, size = 3.5)
plotly::ggplotly(p)

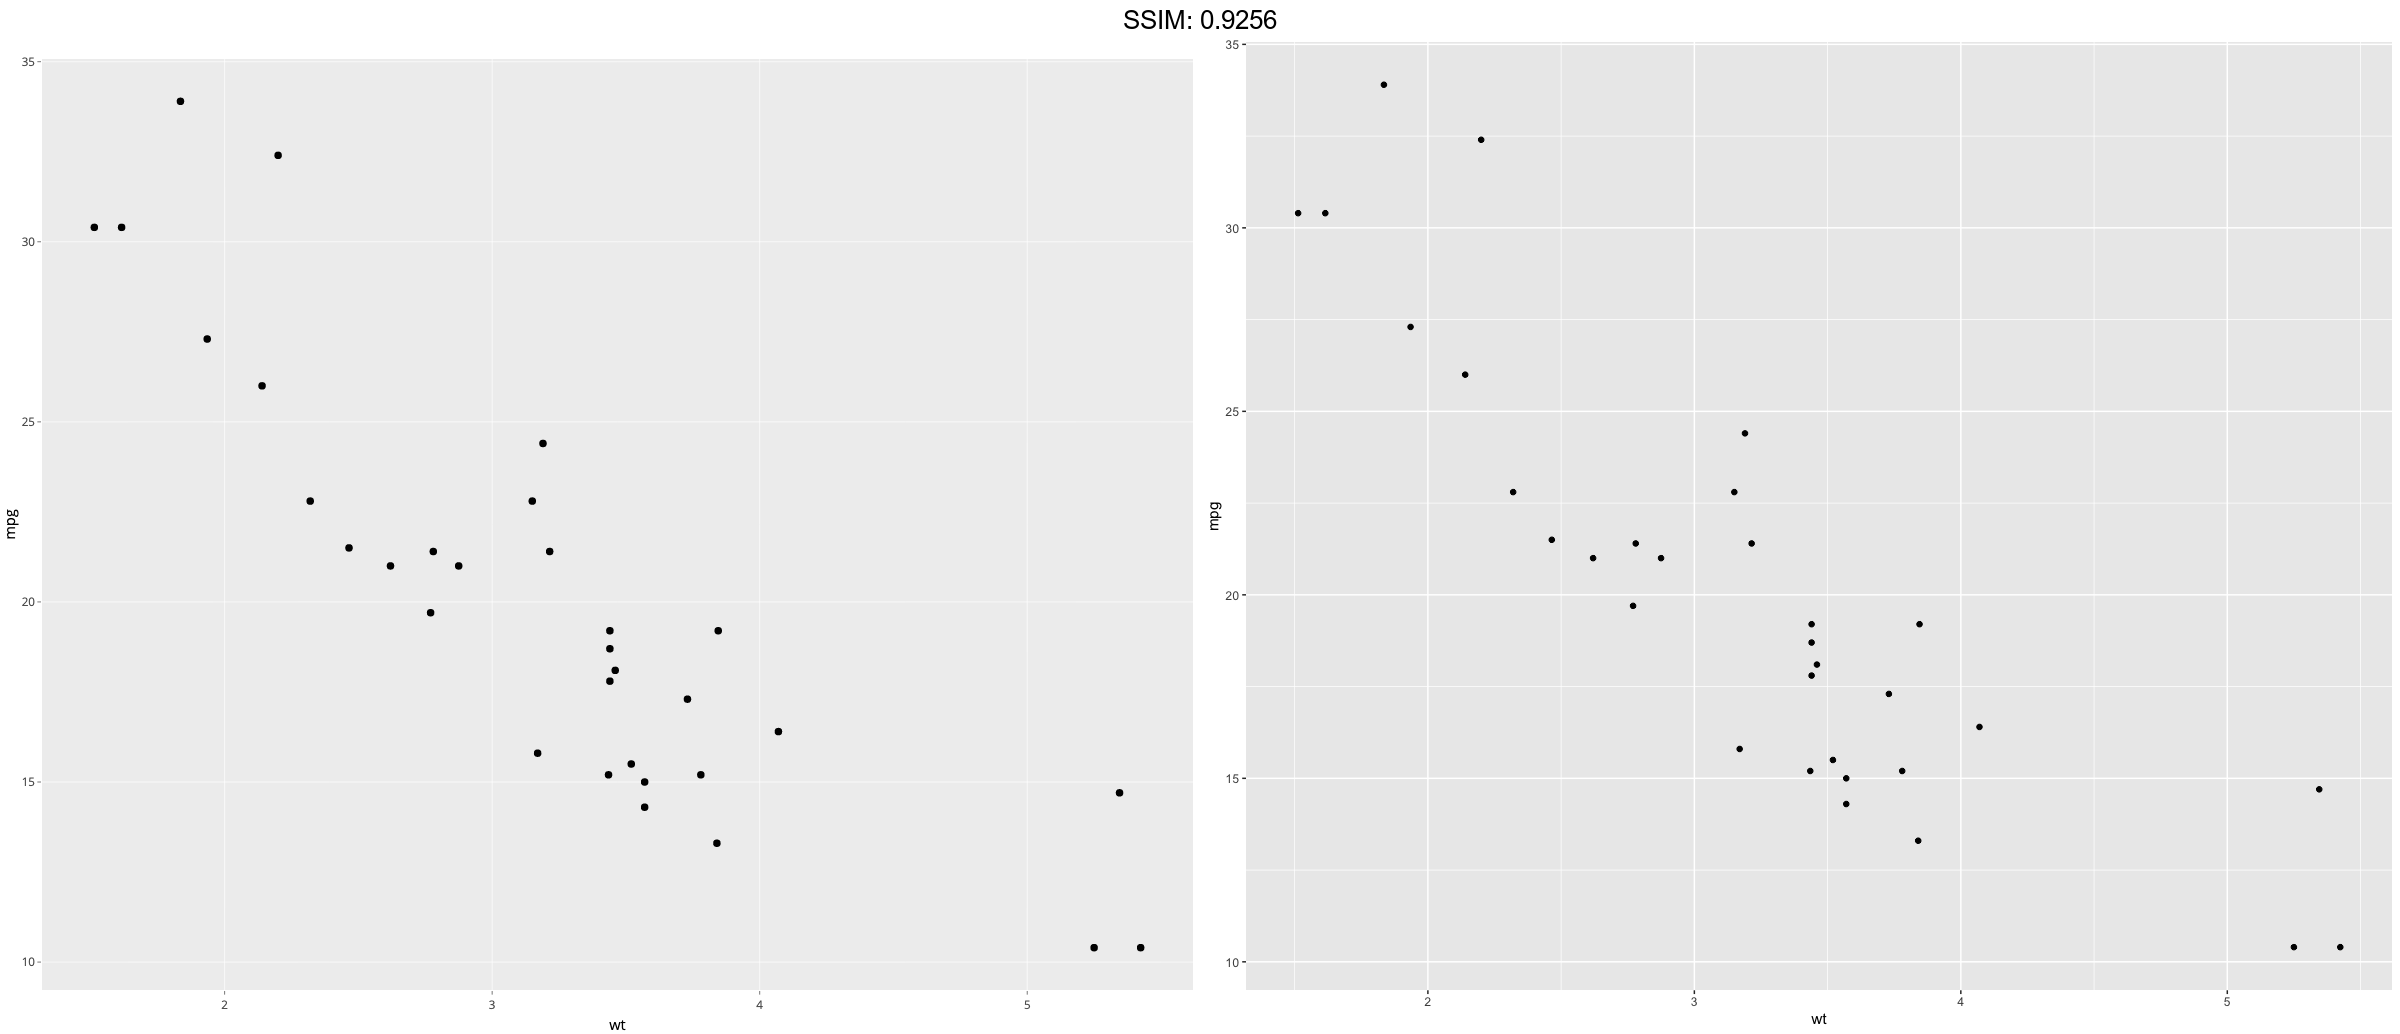
p <- ggplot(mtcars, aes(wt, mpg))
p <-  p + geom_point()
plotly::ggplotly(p)

p <- ggplot(mtcars, aes(wt, mpg))
p <-  p + geom_point(shape = 5)
plotly::ggplotly(p)


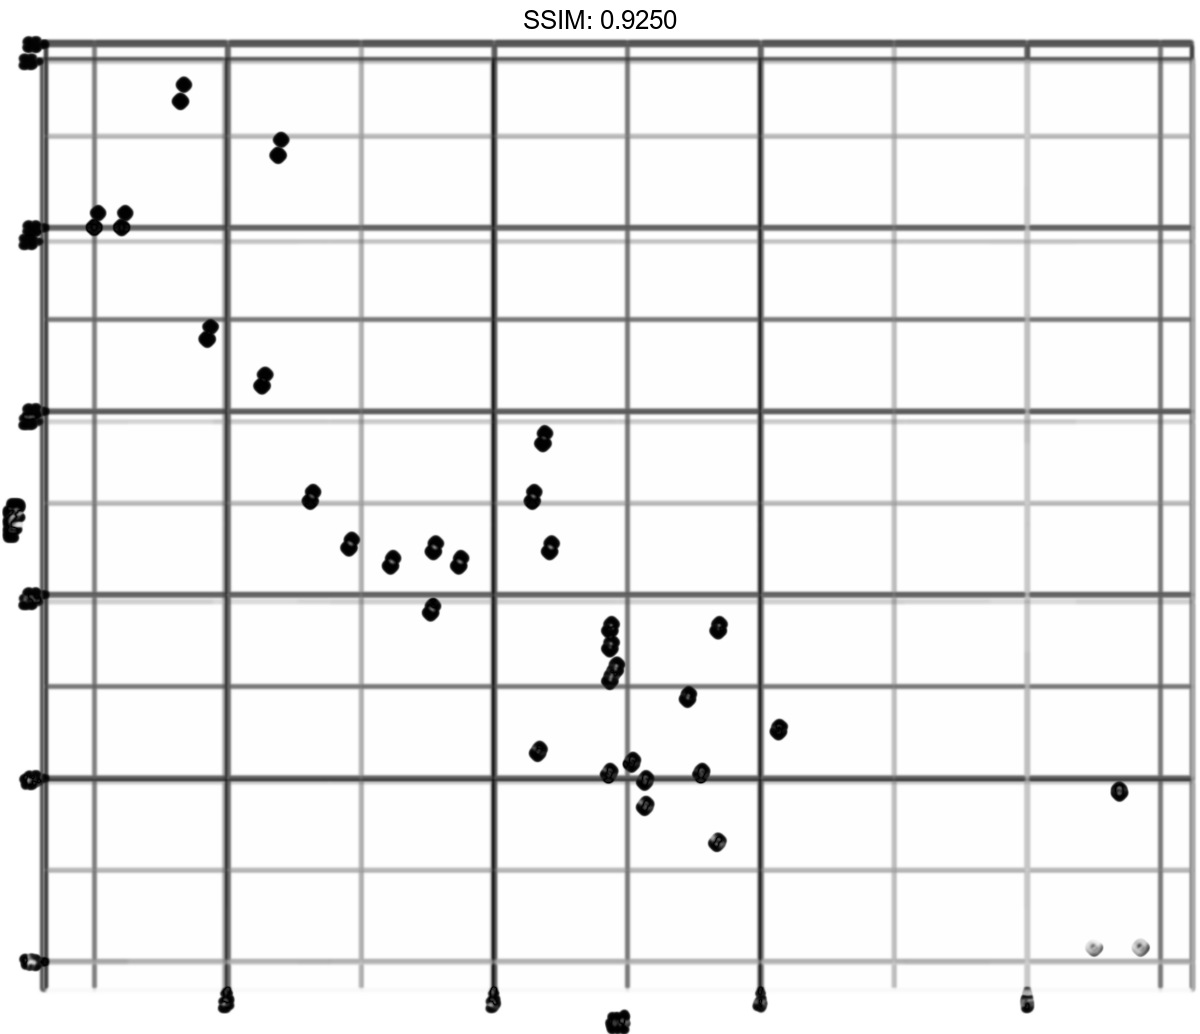
p <- ggplot(mtcars, aes(wt, mpg))
p <-  p + geom_point(shape = "k", size = 3)
plotly::ggplotly(p)

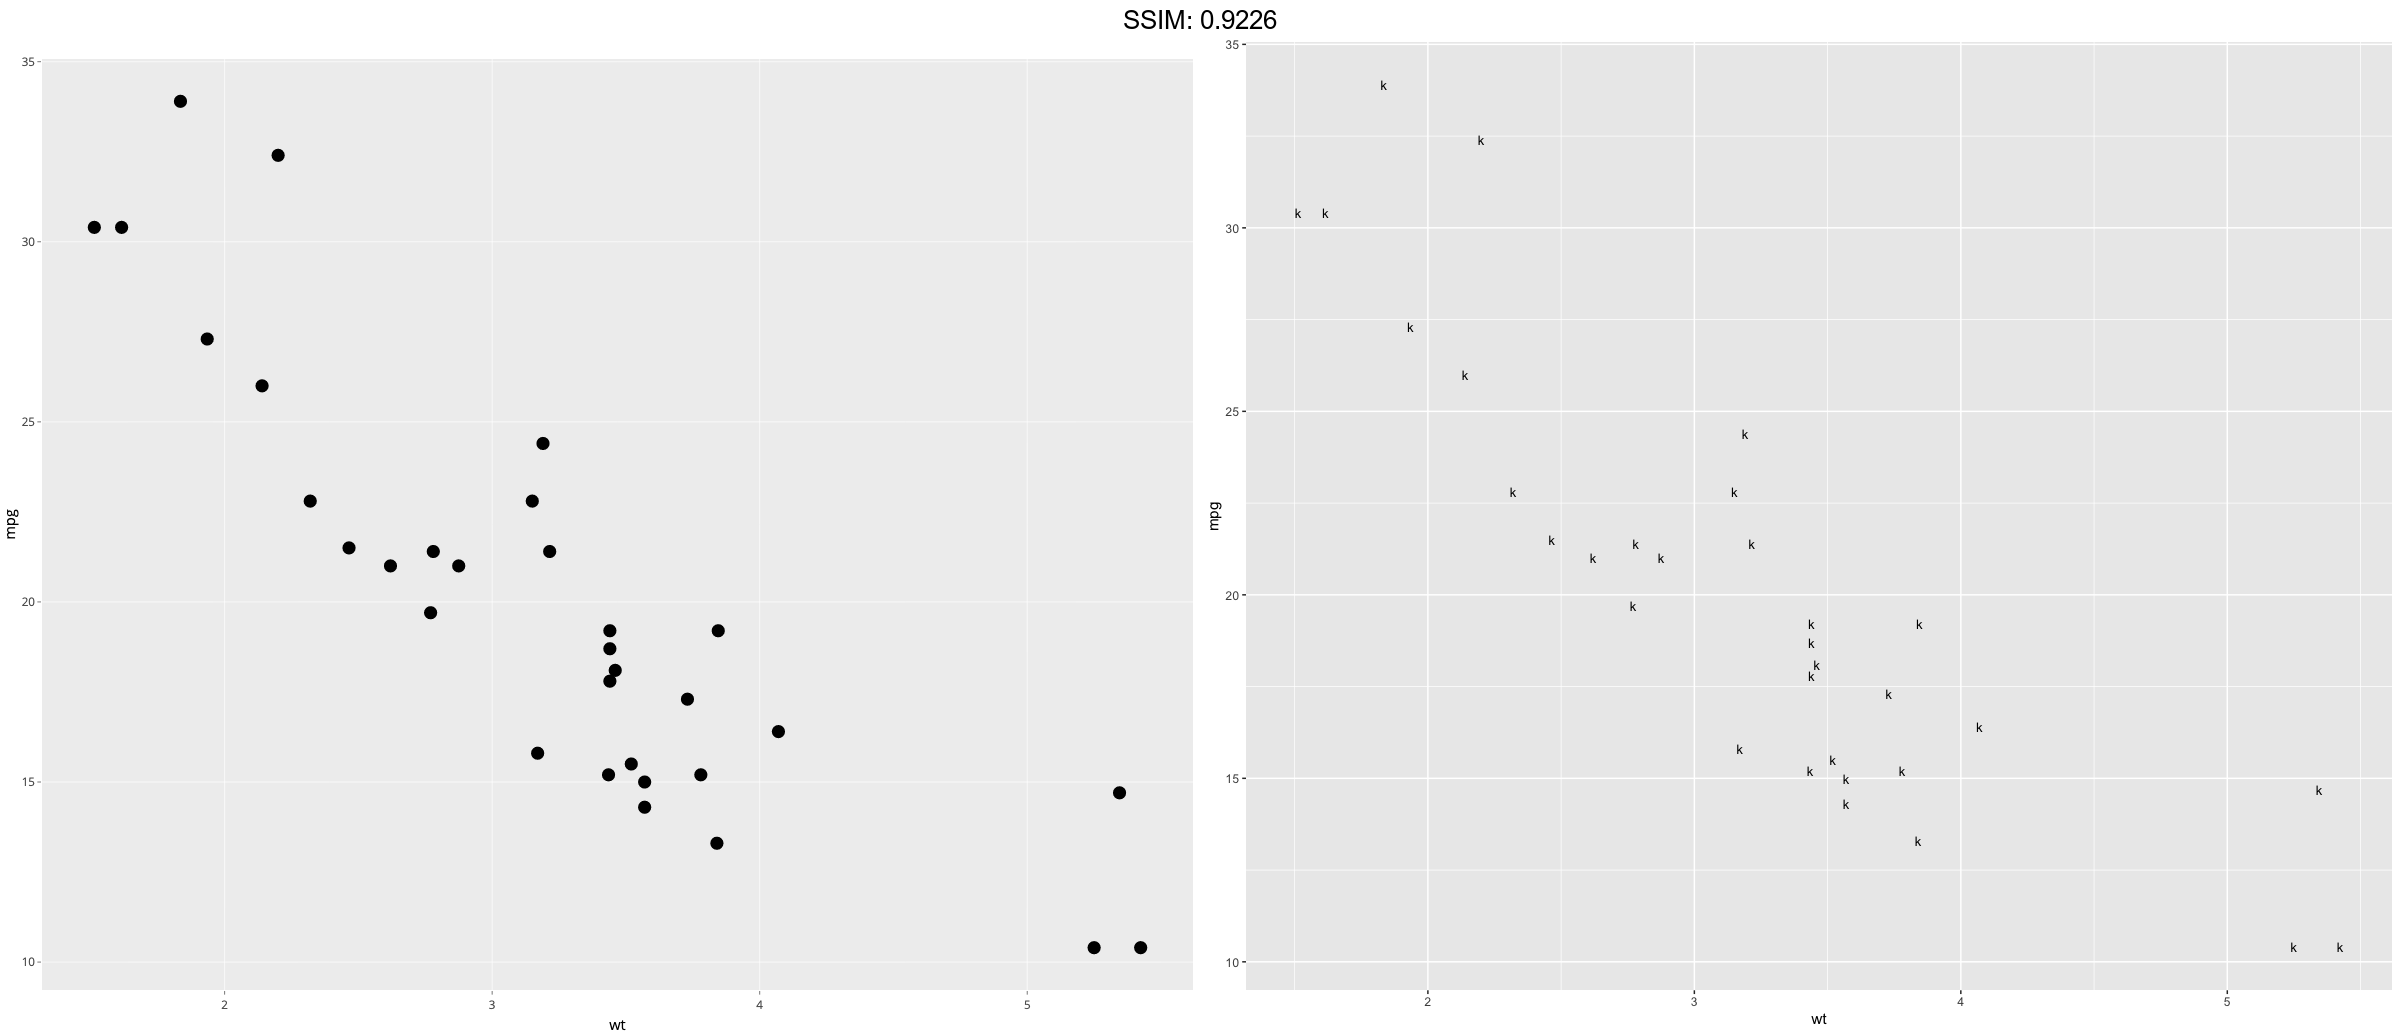

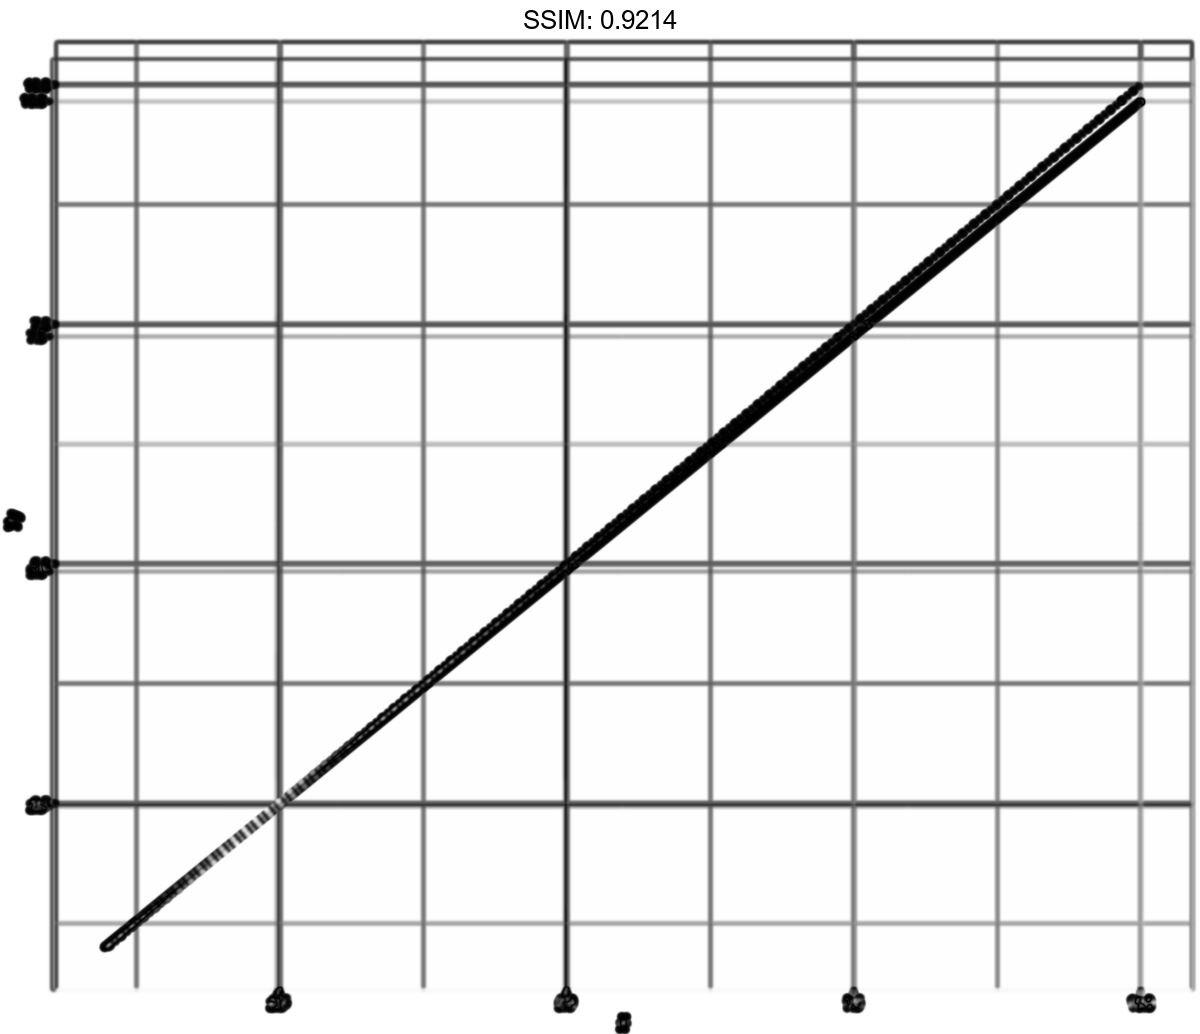
p <- ggplot(mtcars, aes(wt, mpg))
p <-  p + geom_point(shape = ".")
plotly::ggplotly(p)

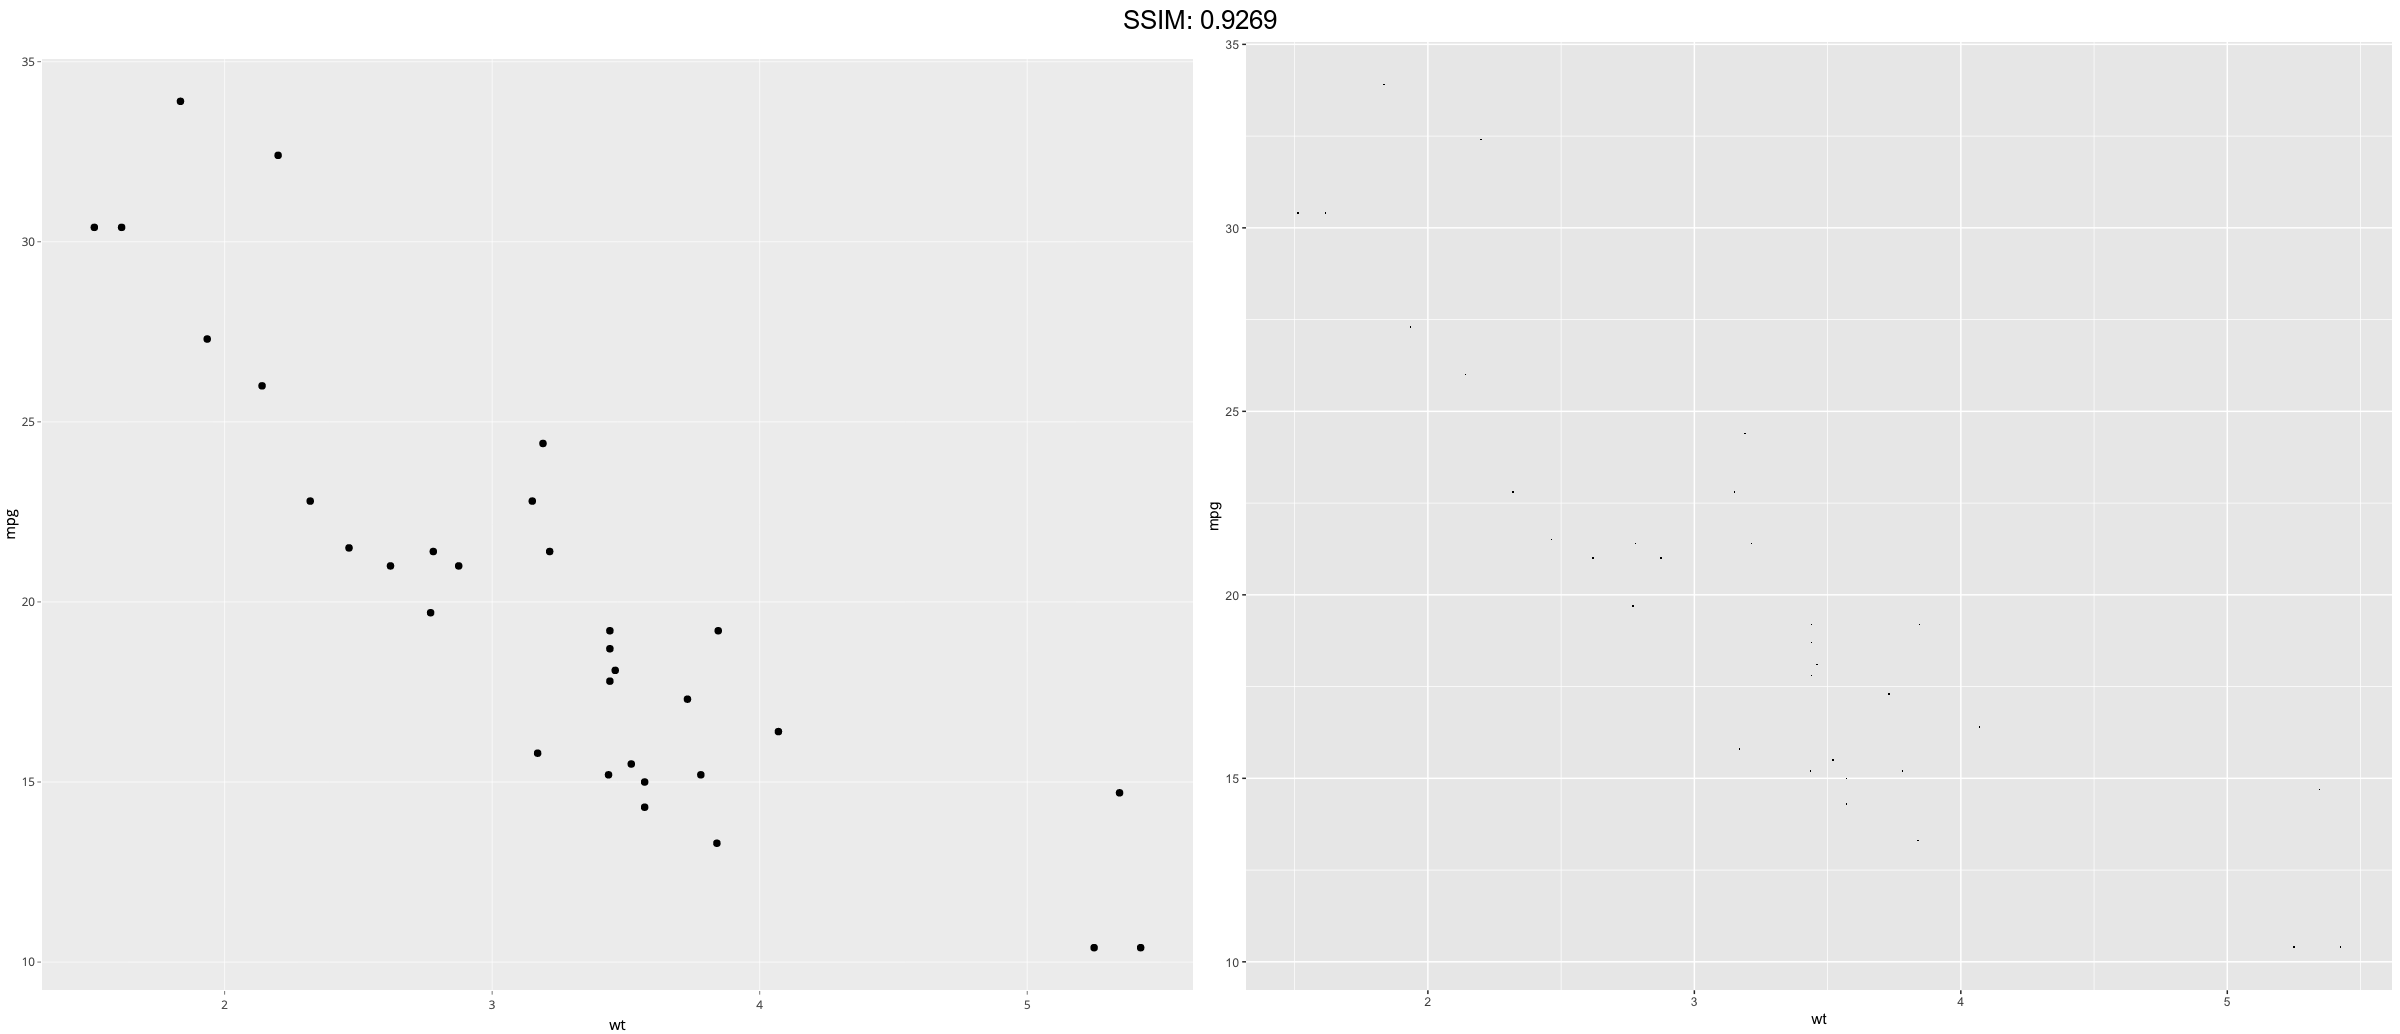
p <- ggplot(mtcars, aes(wt, mpg))
p <-  p + geom_point(shape = NA)
plotly::ggplotly(p)


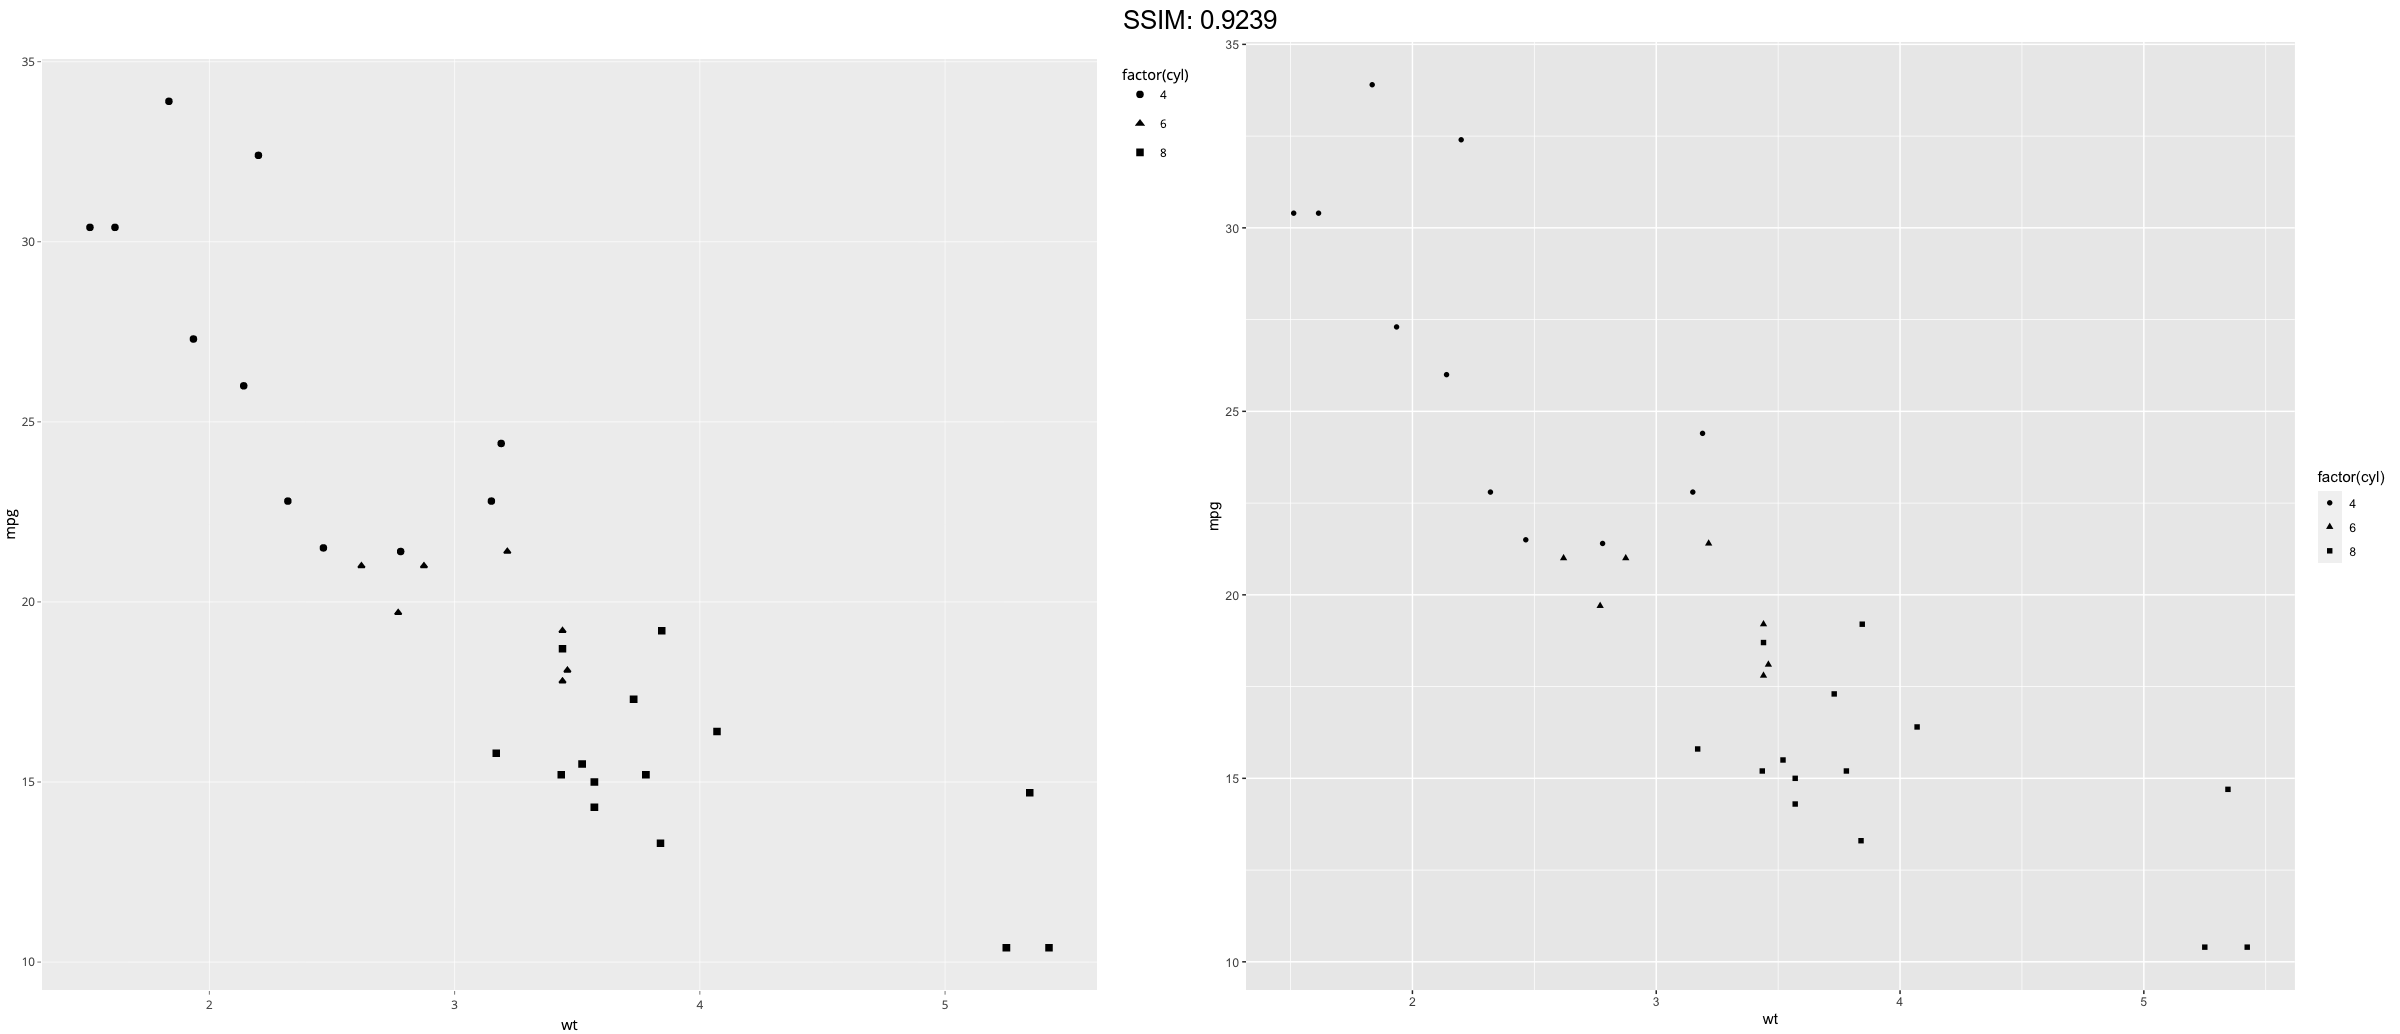
p <- ggplot(mtcars, aes(wt, mpg))
p <-  p + geom_point(aes(shape = factor(cyl)))
plotly::ggplotly(p)


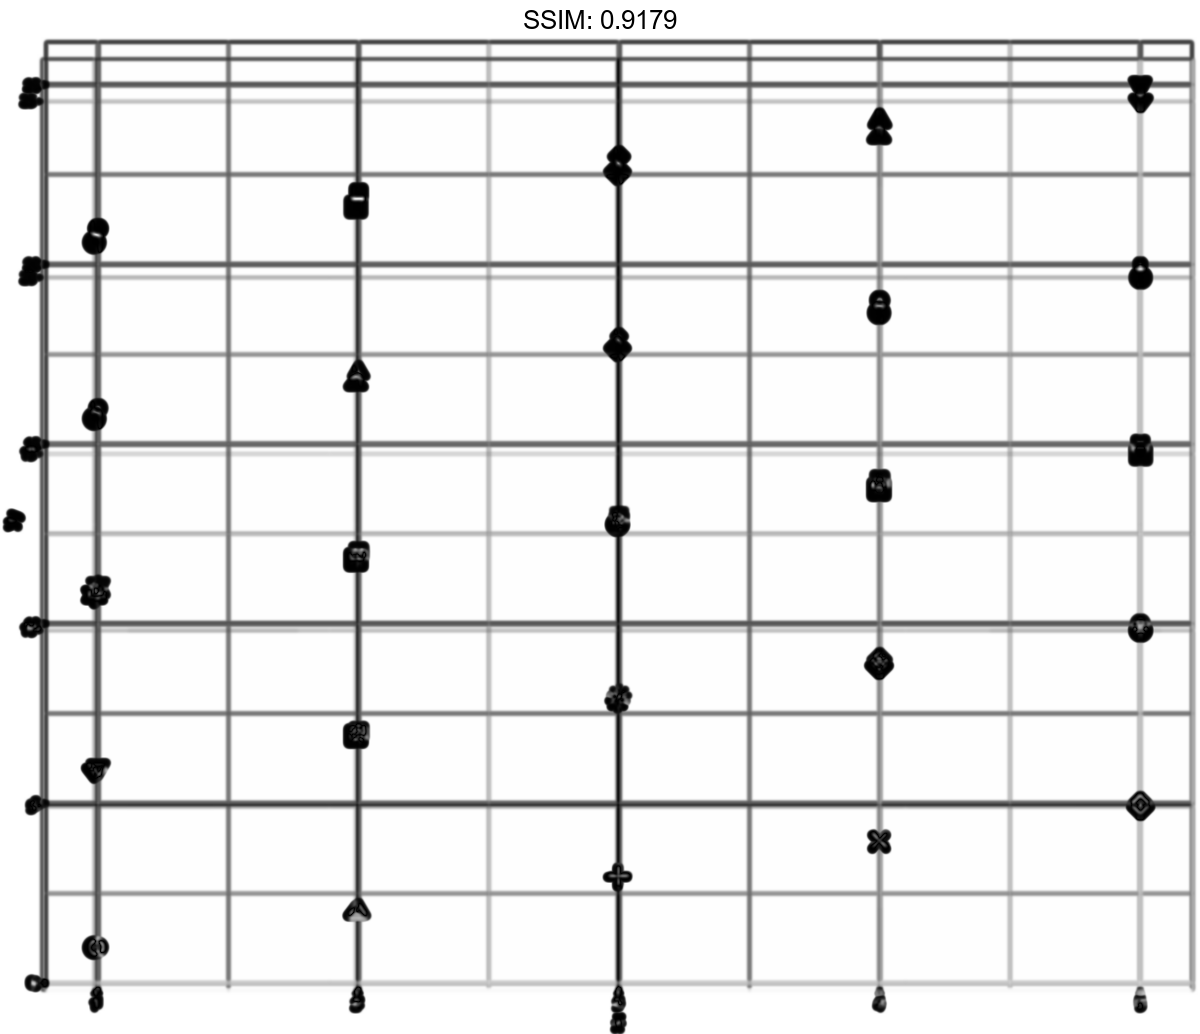
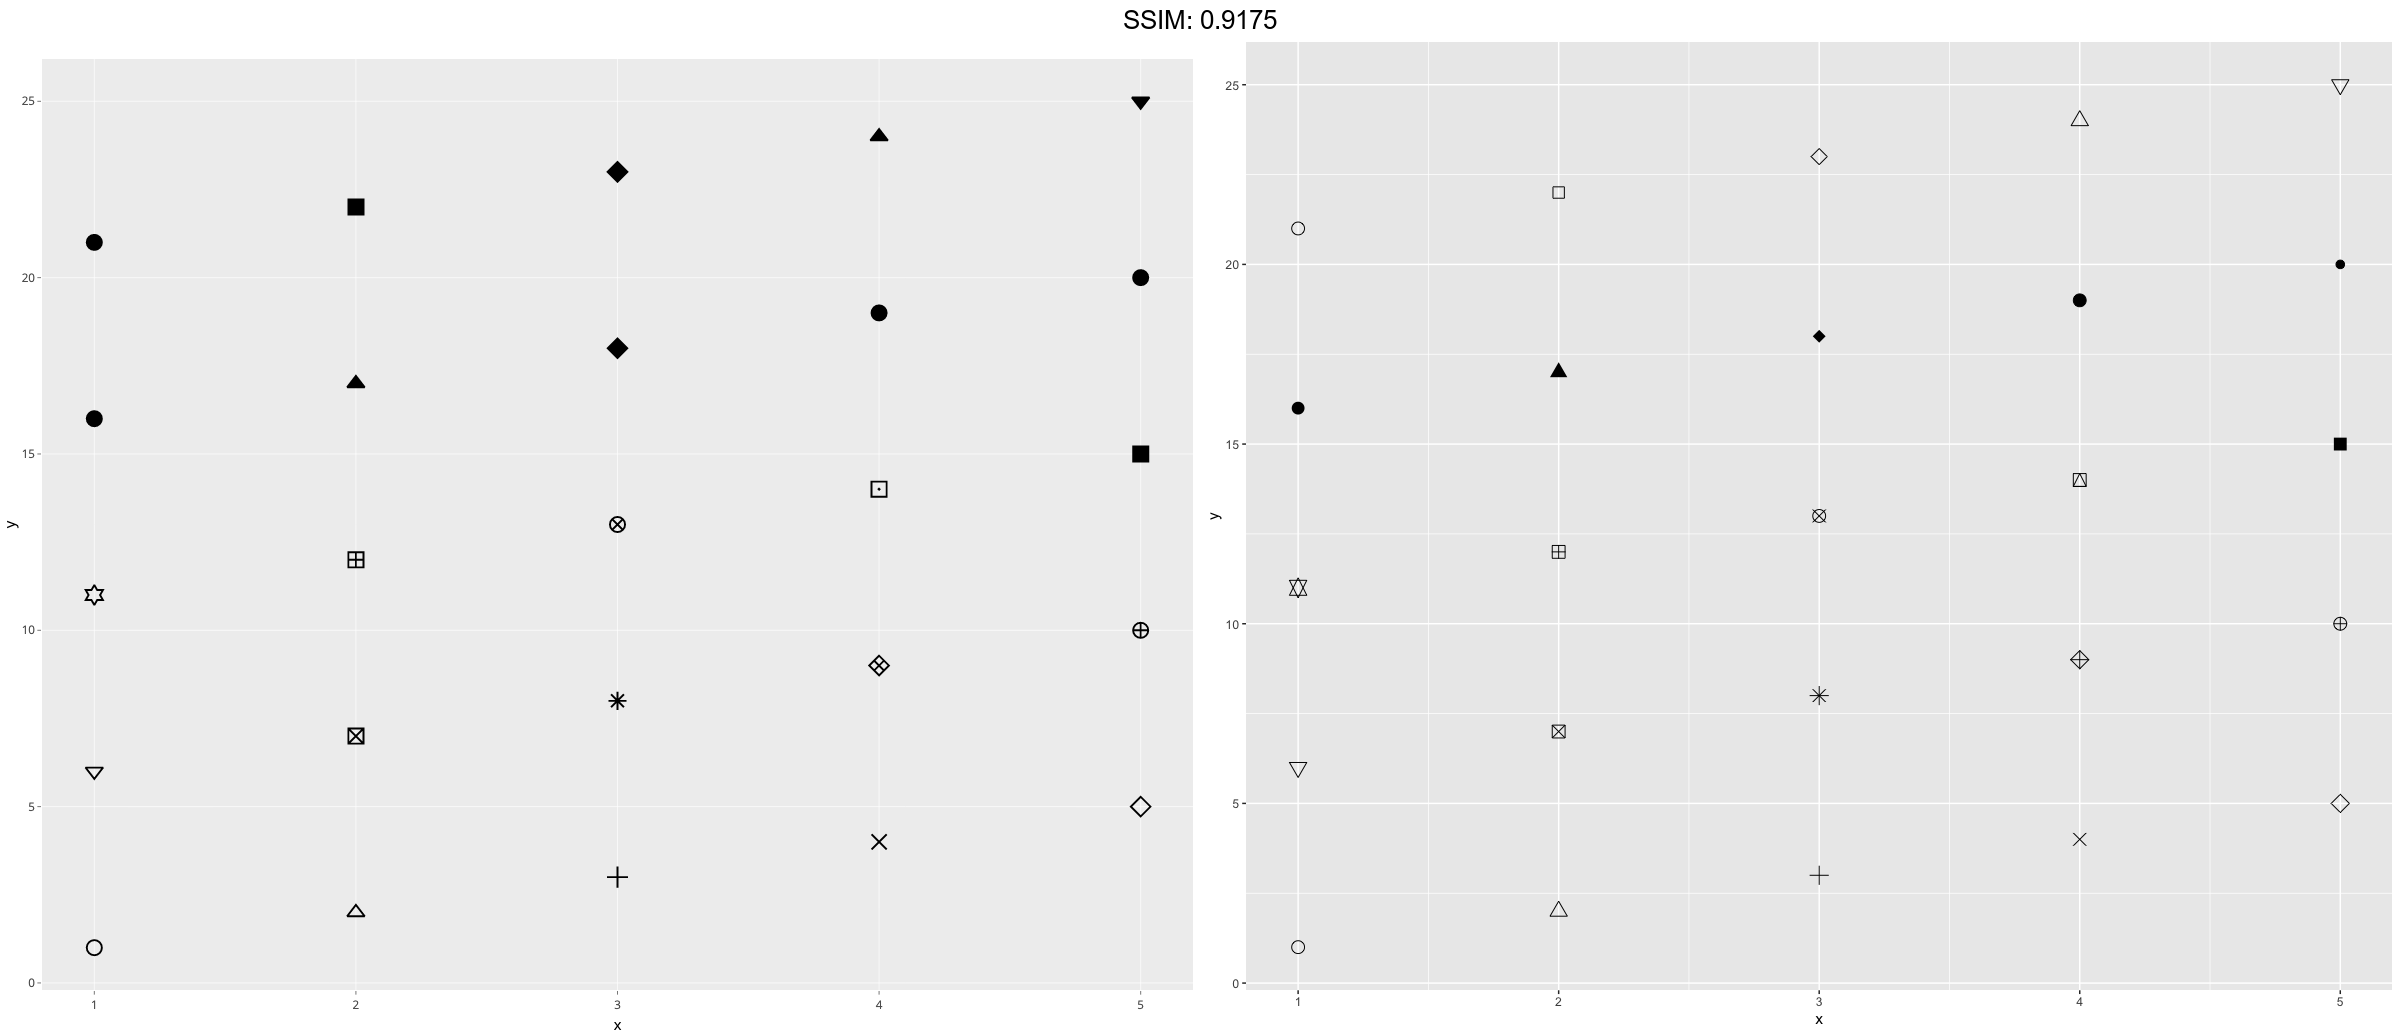
df2 <- data.frame(x = 1:5 , y = 1:25, z = 1:25)
p <- ggplot(df2, aes(x, y))
p <-
 p + geom_point(aes(shape = z), size = 4) +
  scale_shape_identity()
plotly::ggplotly(p)

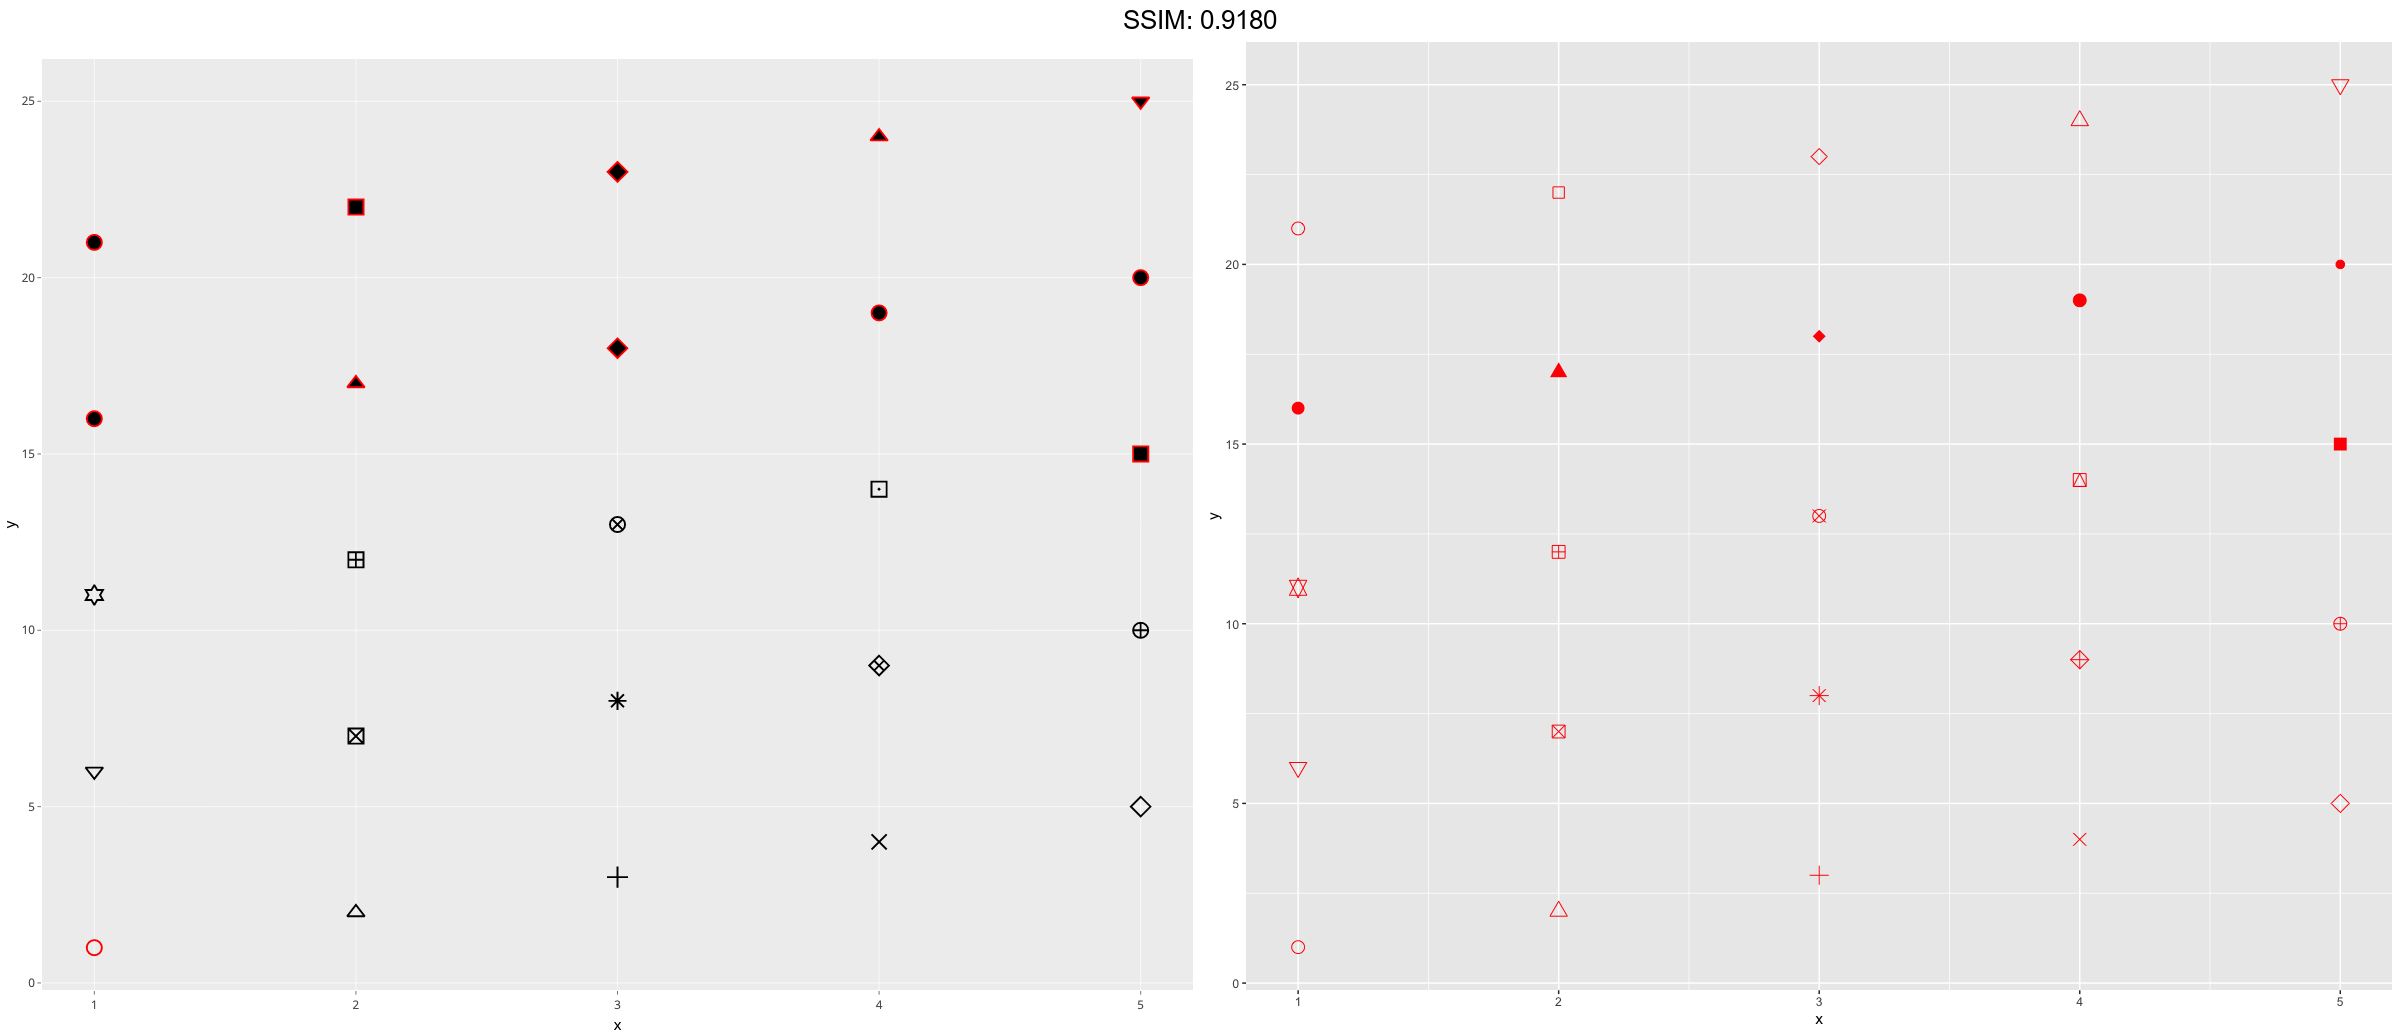
df2 <- data.frame(x = 1:5 , y = 1:25, z = 1:25)
p <- ggplot(df2, aes(x, y))
p <-
 p + geom_point(aes(shape = z), size = 4, colour = "Red") +
  scale_shape_identity()
plotly::ggplotly(p)

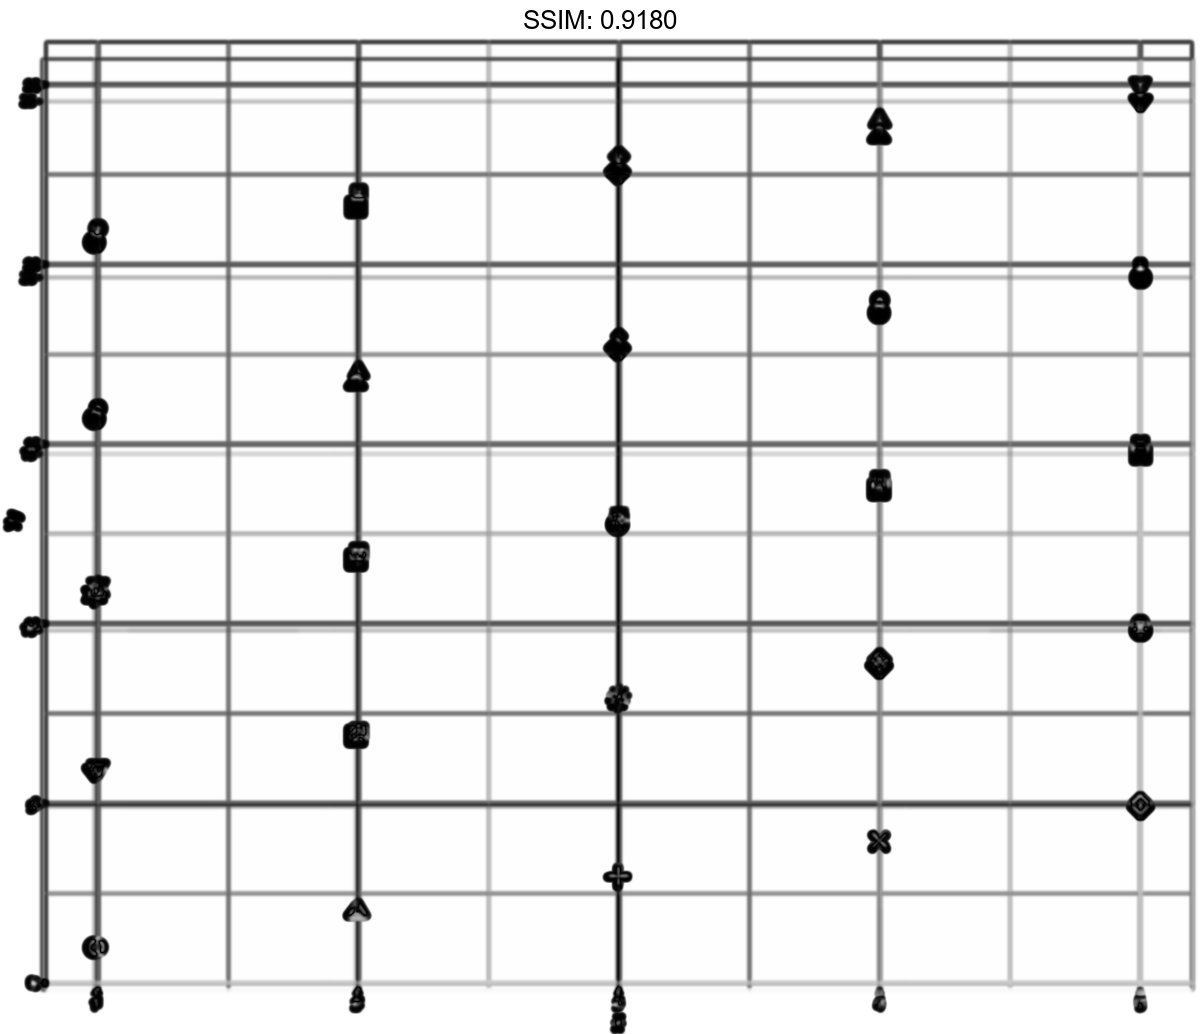
df2 <- data.frame(x = 1:5 , y = 1:25, z = 1:25)
p <- ggplot(df2, aes(x, y))
p <-
 p + geom_point(aes(shape = z), size = 4, colour = "Red", fill = "Black") +
  scale_shape_identity()
plotly::ggplotly(p)


