GGPLOT - aes_group_order
Define the grouping structure by mapping group to a variable that has a different value for each group and then convert them with ggplotly
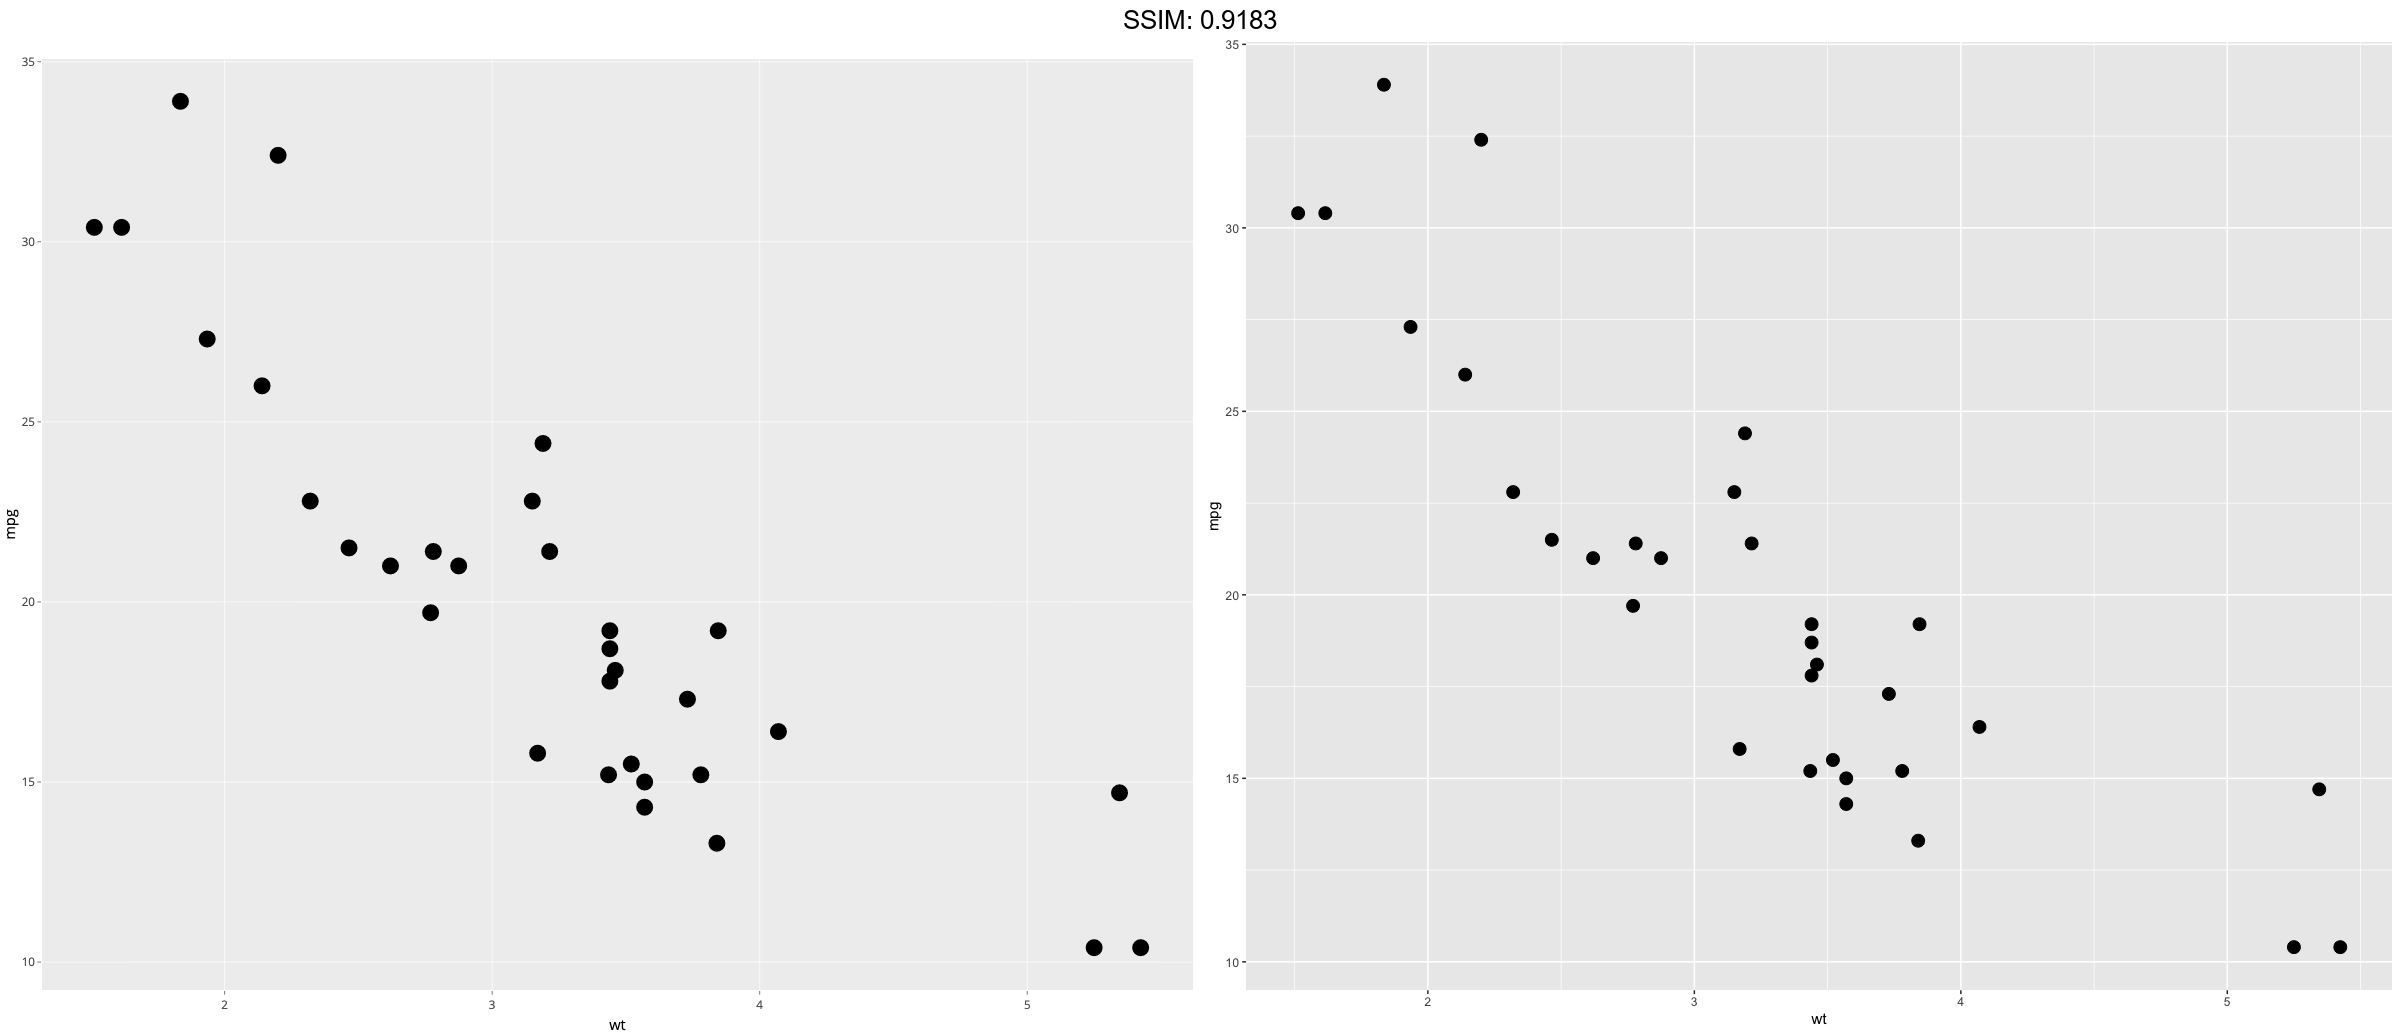
p <- ggplot(mtcars, aes(wt, mpg))
p <-  p + geom_point(size = 4)
plotly::ggplotly(p)


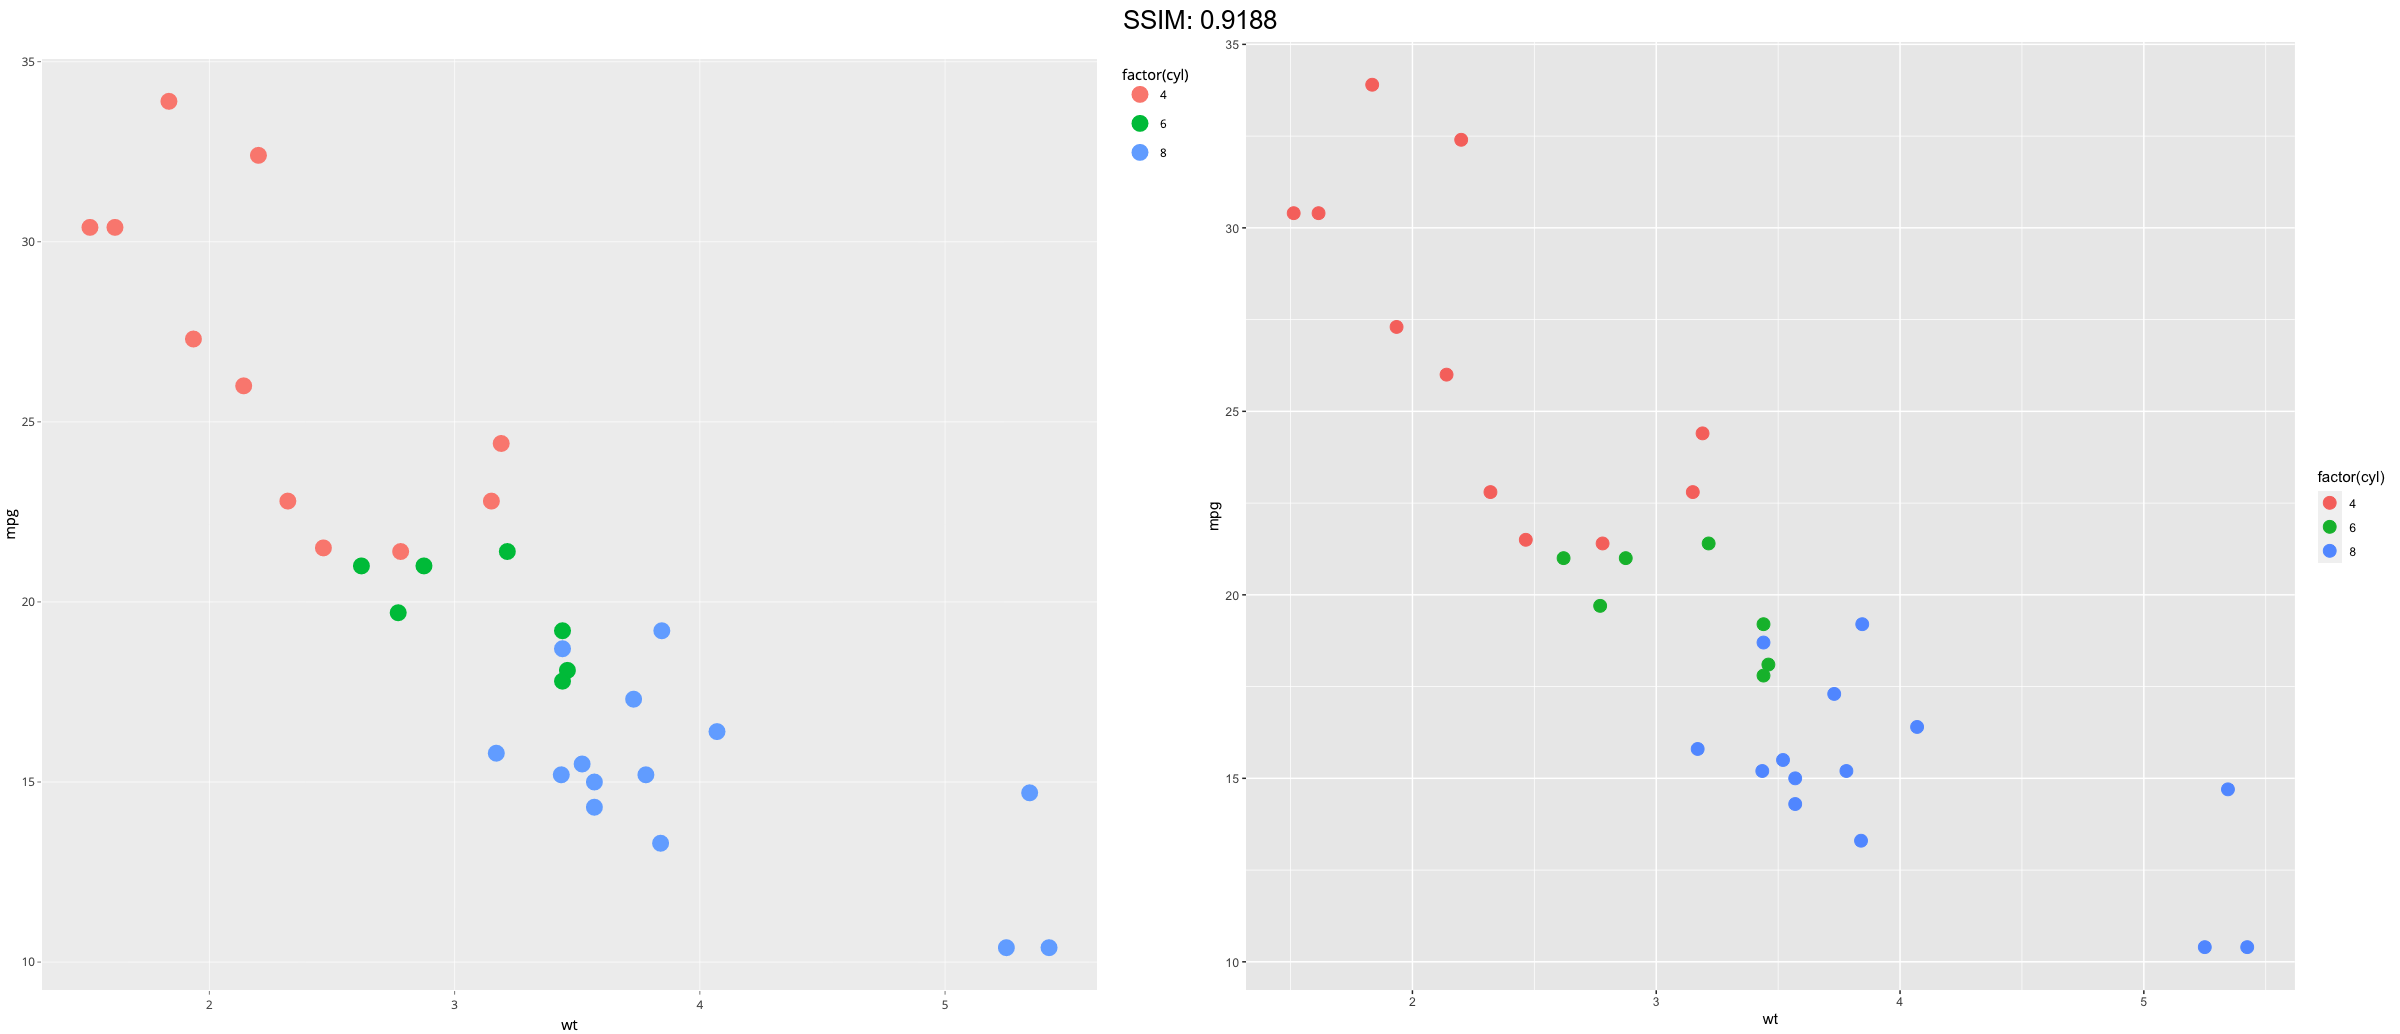
p <- ggplot(mtcars, aes(wt, mpg))
p <-  p + geom_point(aes(colour = factor(cyl)), size = 4)
plotly::ggplotly(p)

p <- ggplot(mtcars, aes(wt, mpg))
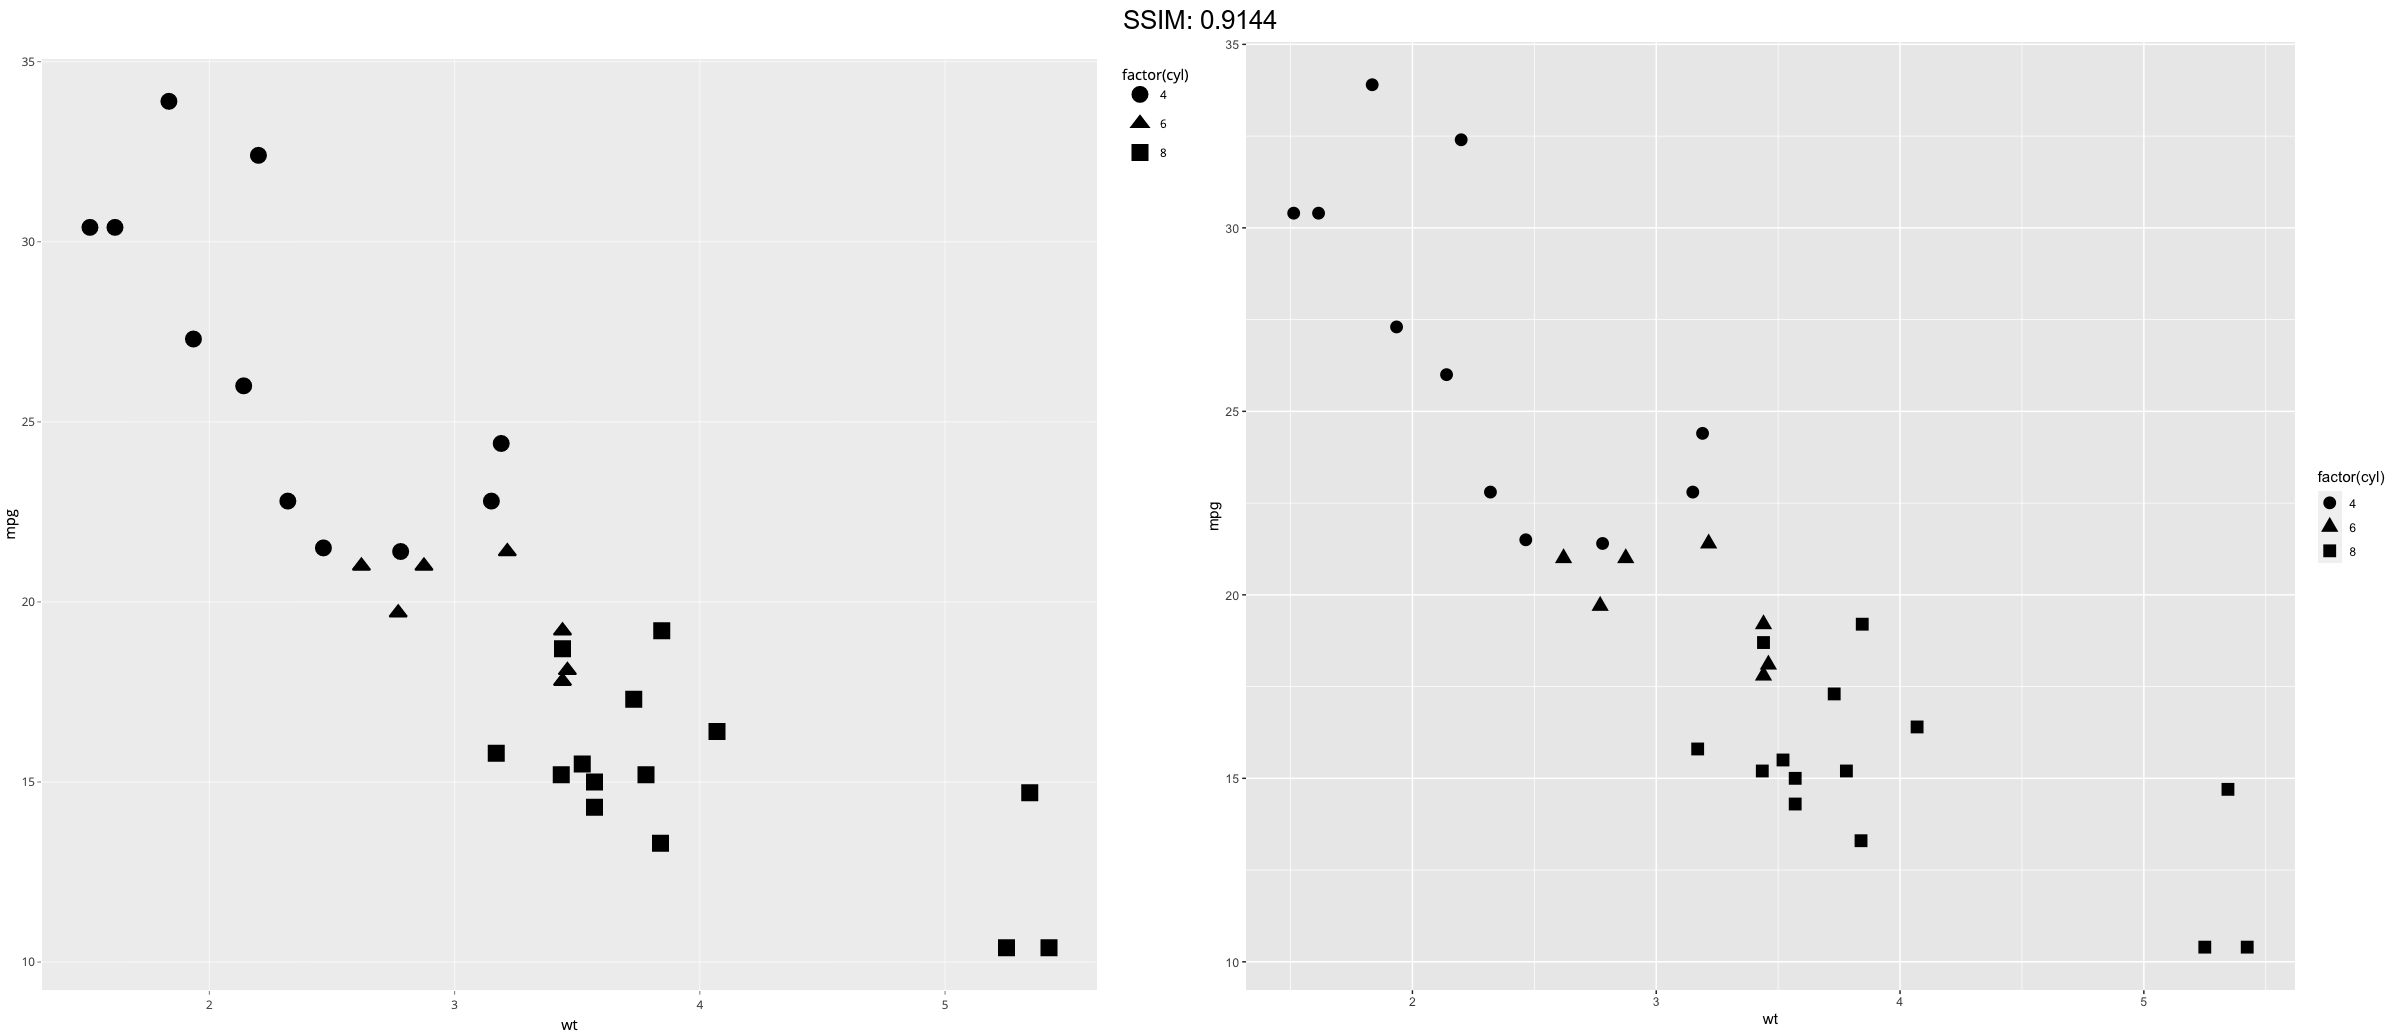
p <-  p + geom_point(aes(shape = factor(cyl)), size = 4)
plotly::ggplotly(p)

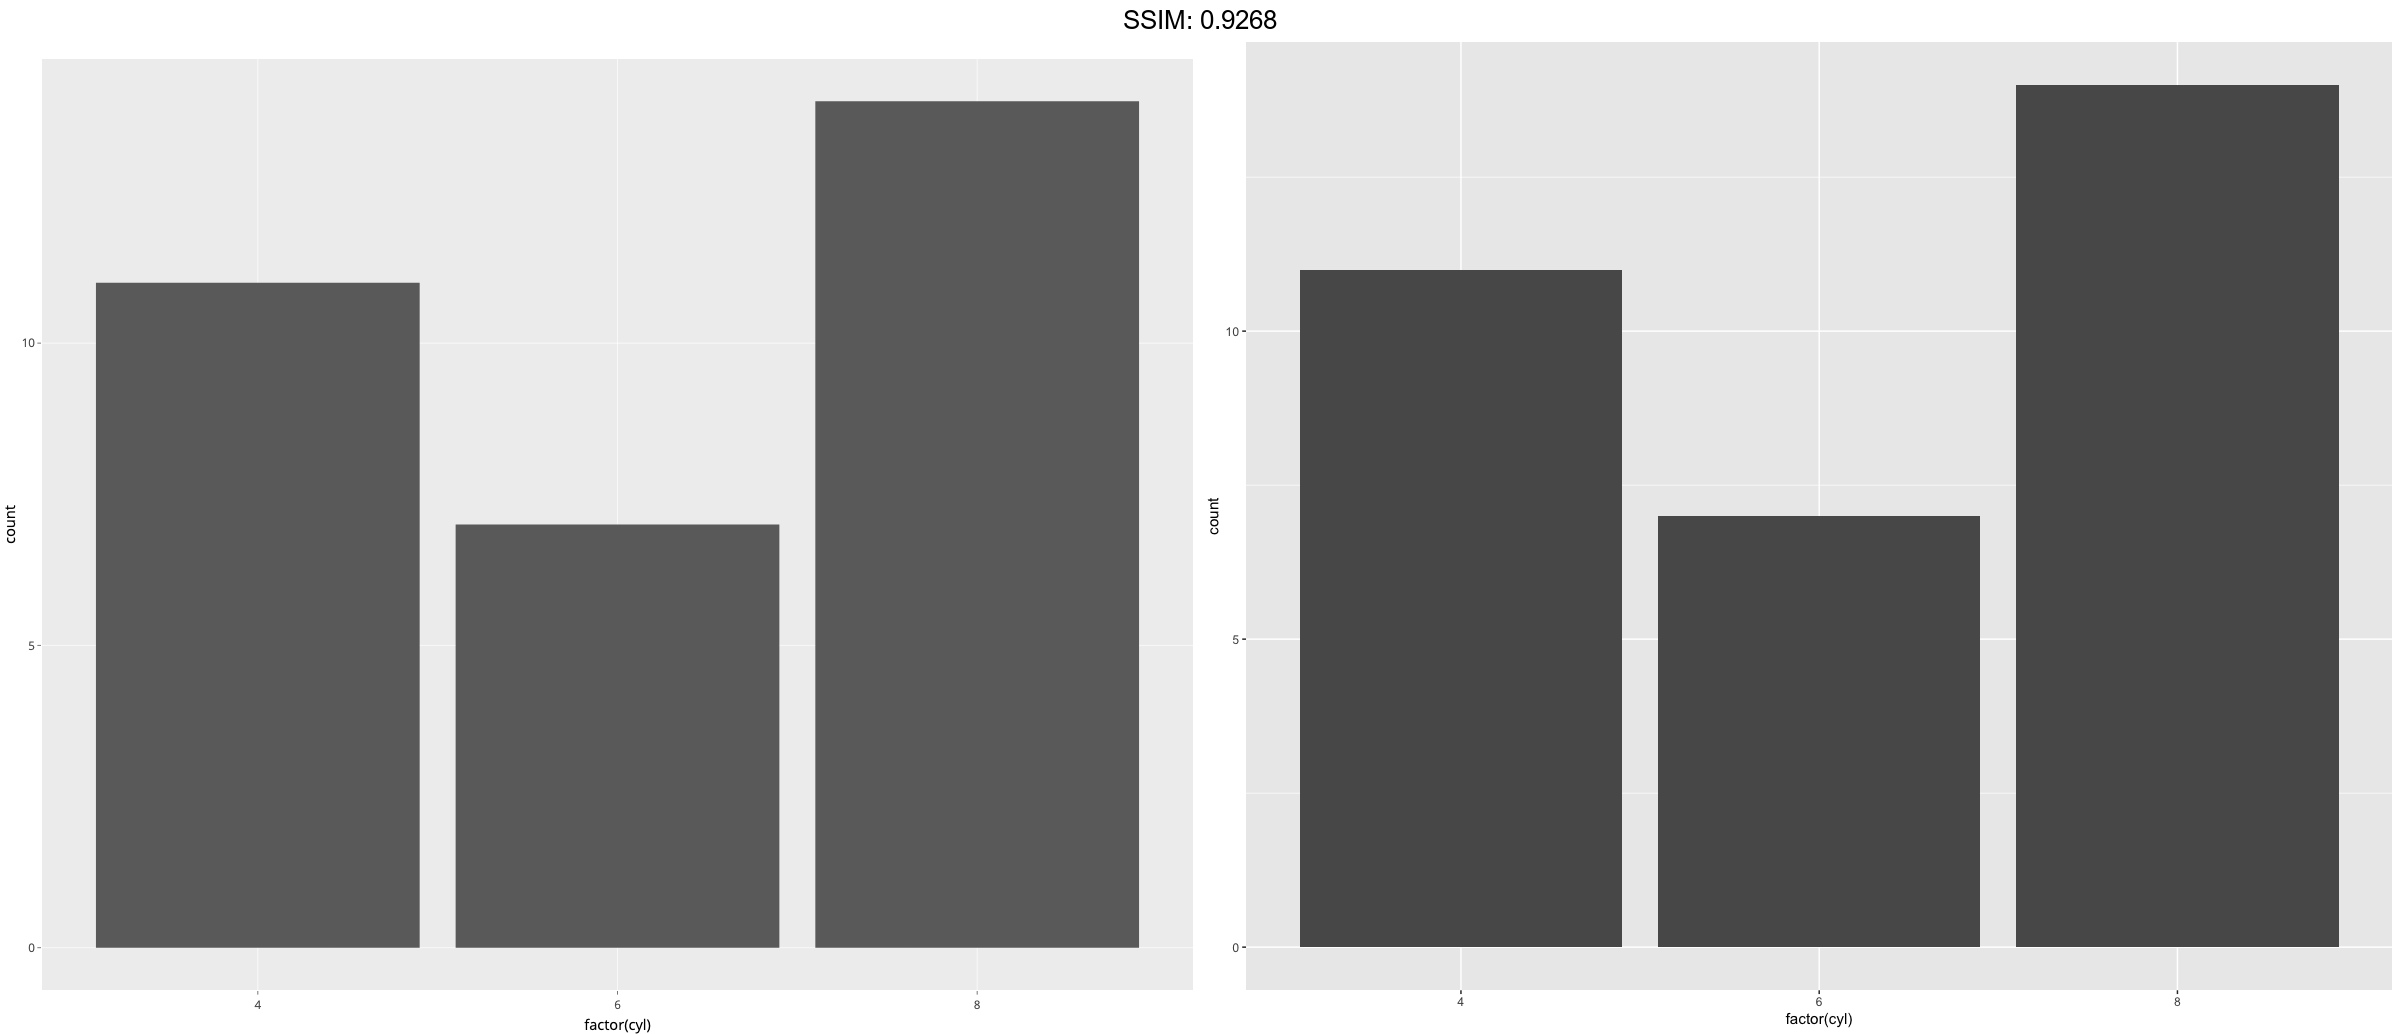
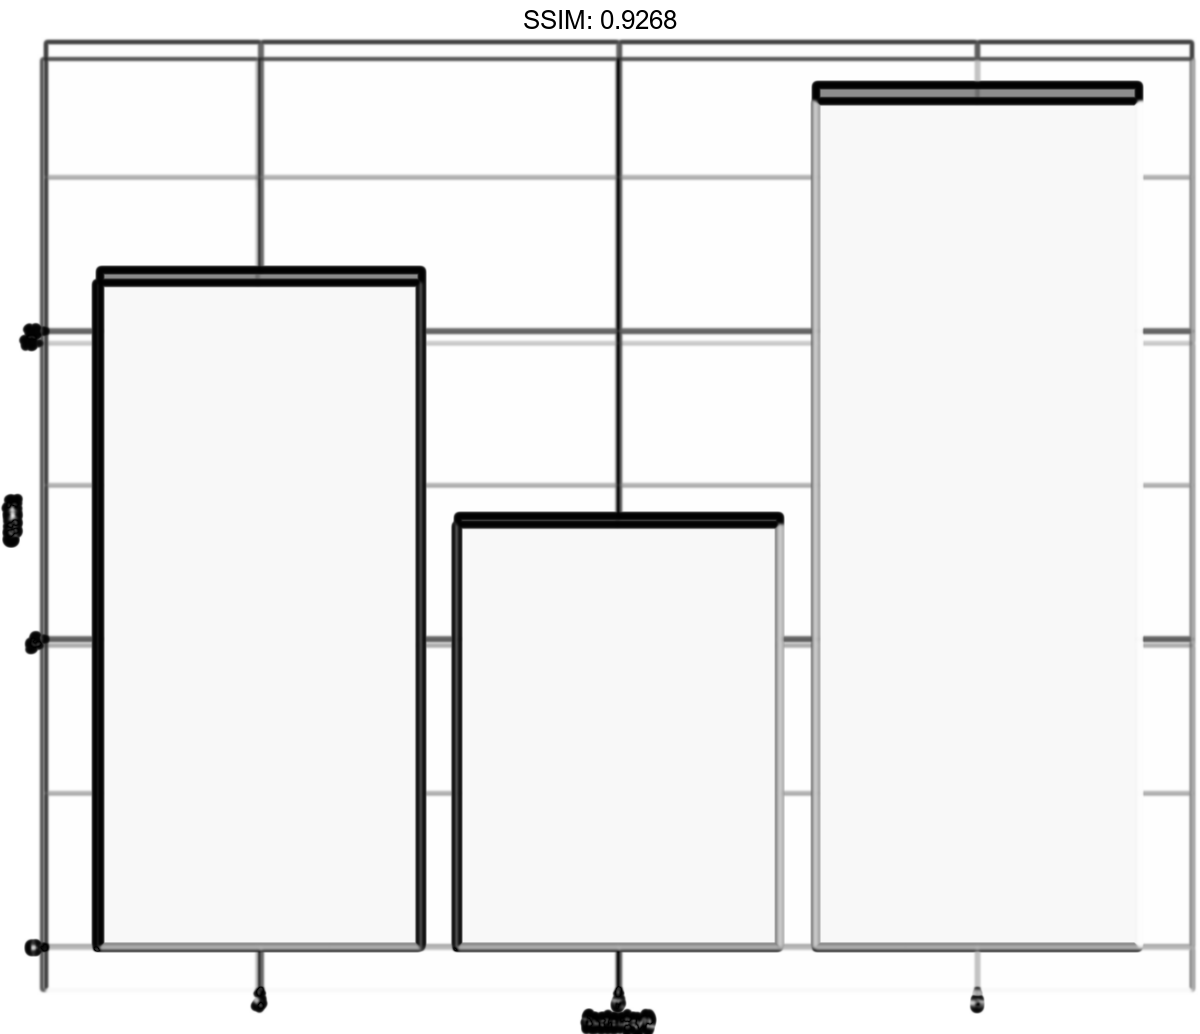
p <- ggplot(mtcars, aes(factor(cyl)))
p <-  p + geom_bar()
plotly::ggplotly(p)

p <- ggplot(mtcars, aes(factor(cyl)))
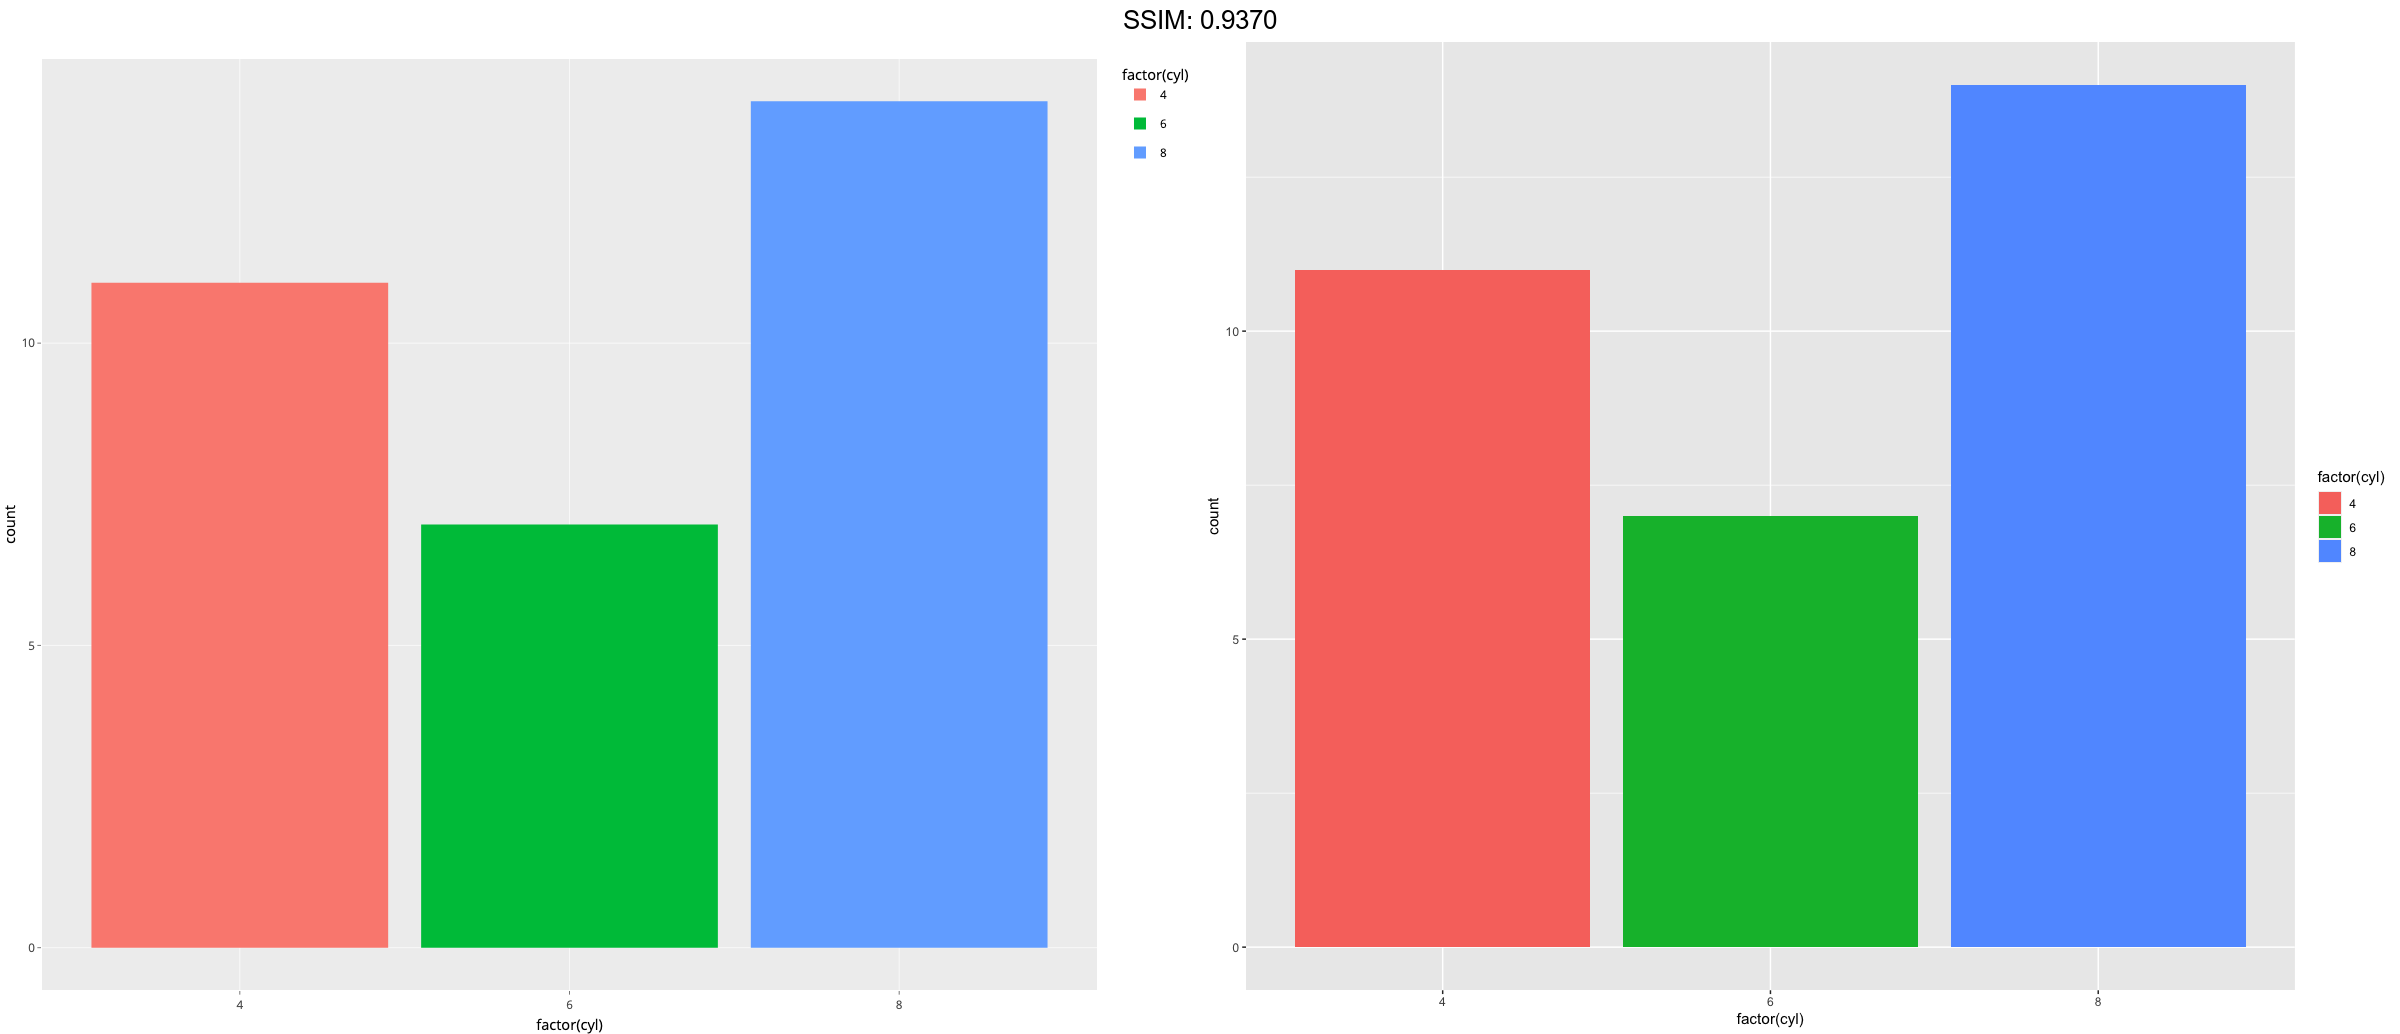
p <-  p + geom_bar(aes(fill = factor(cyl)))
plotly::ggplotly(p)

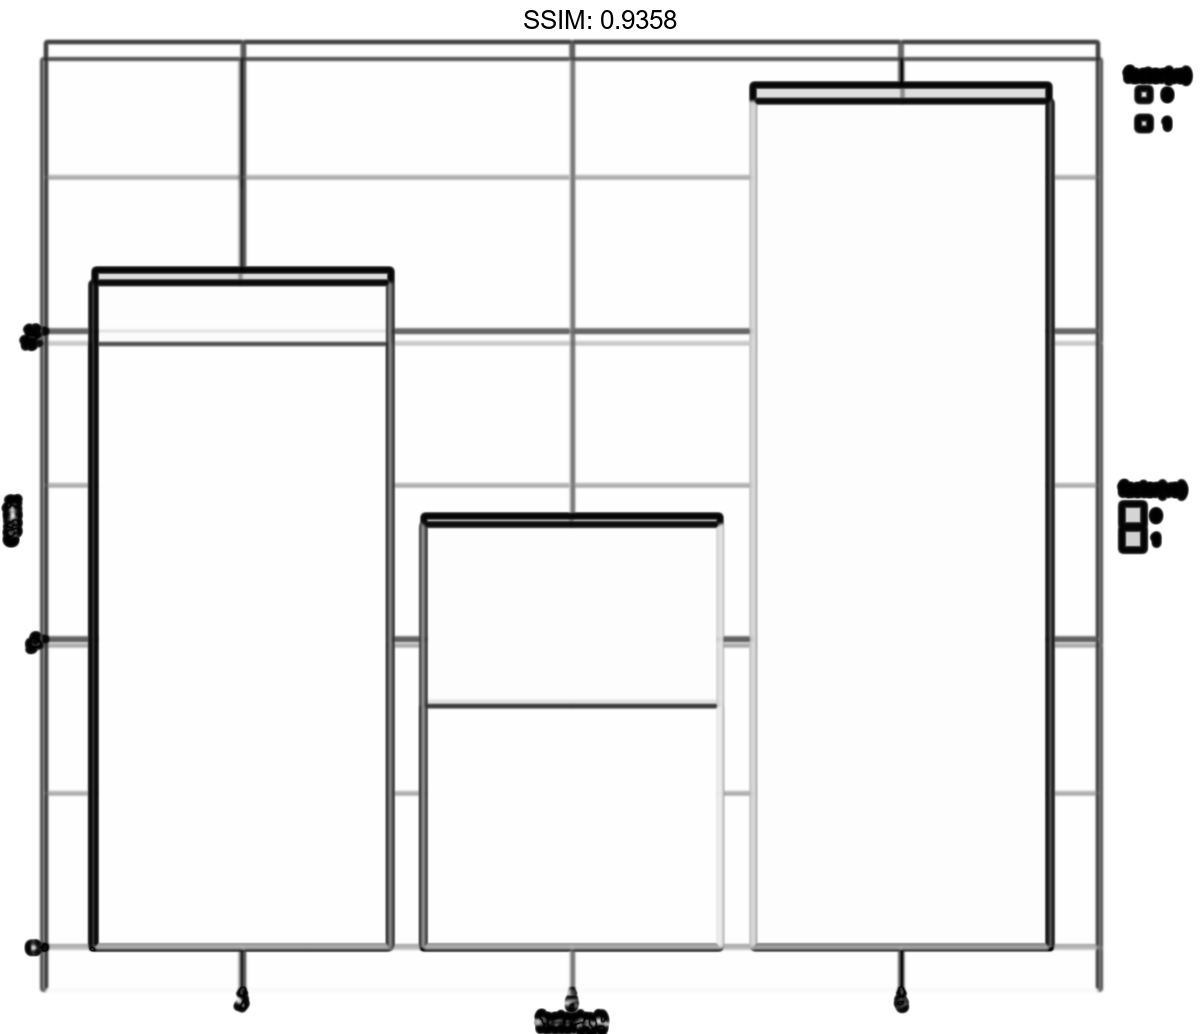
p <- ggplot(mtcars, aes(factor(cyl)))
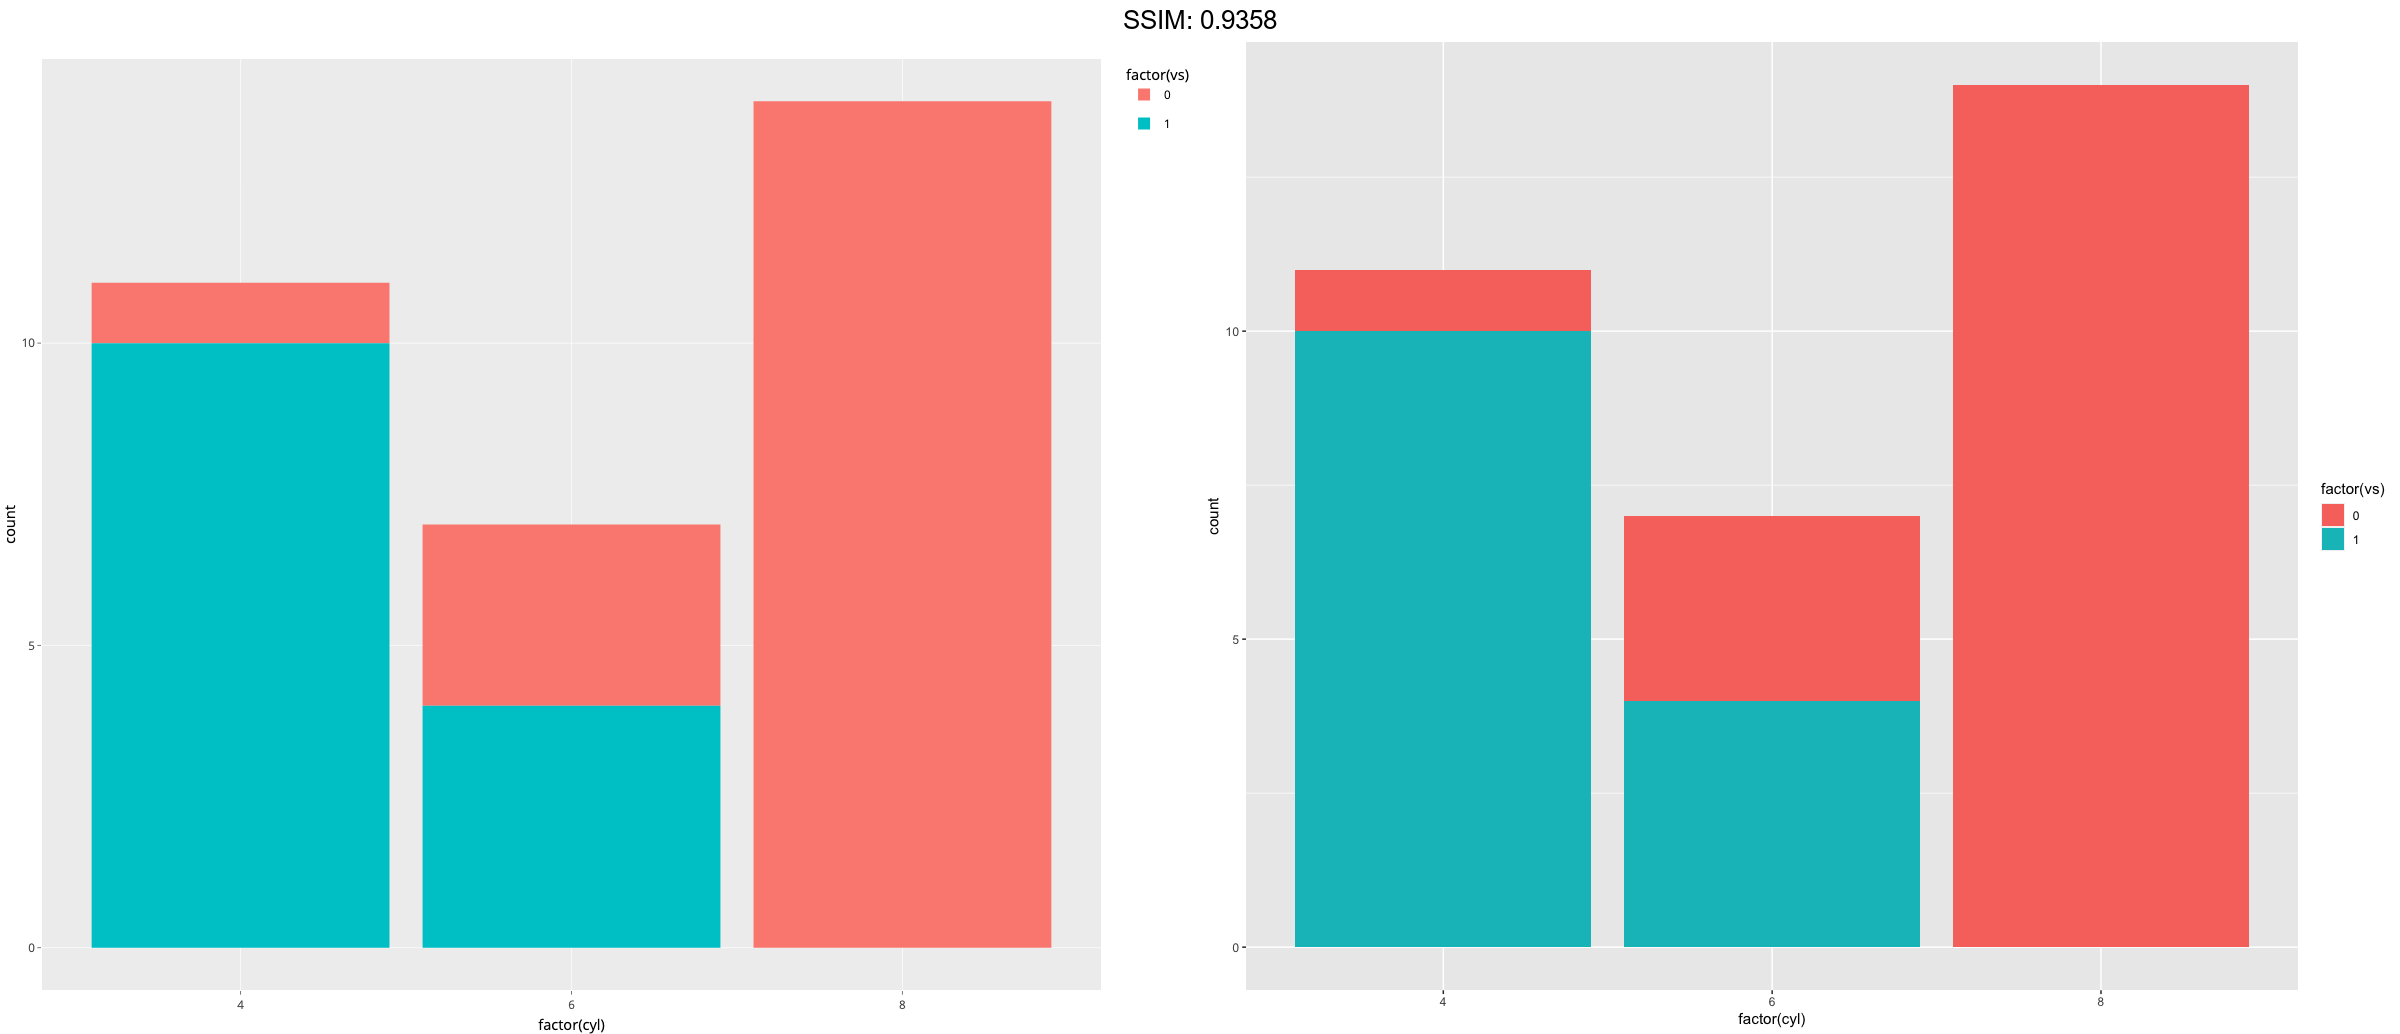
p <-  p + geom_bar(aes(fill = factor(vs)))
plotly::ggplotly(p)

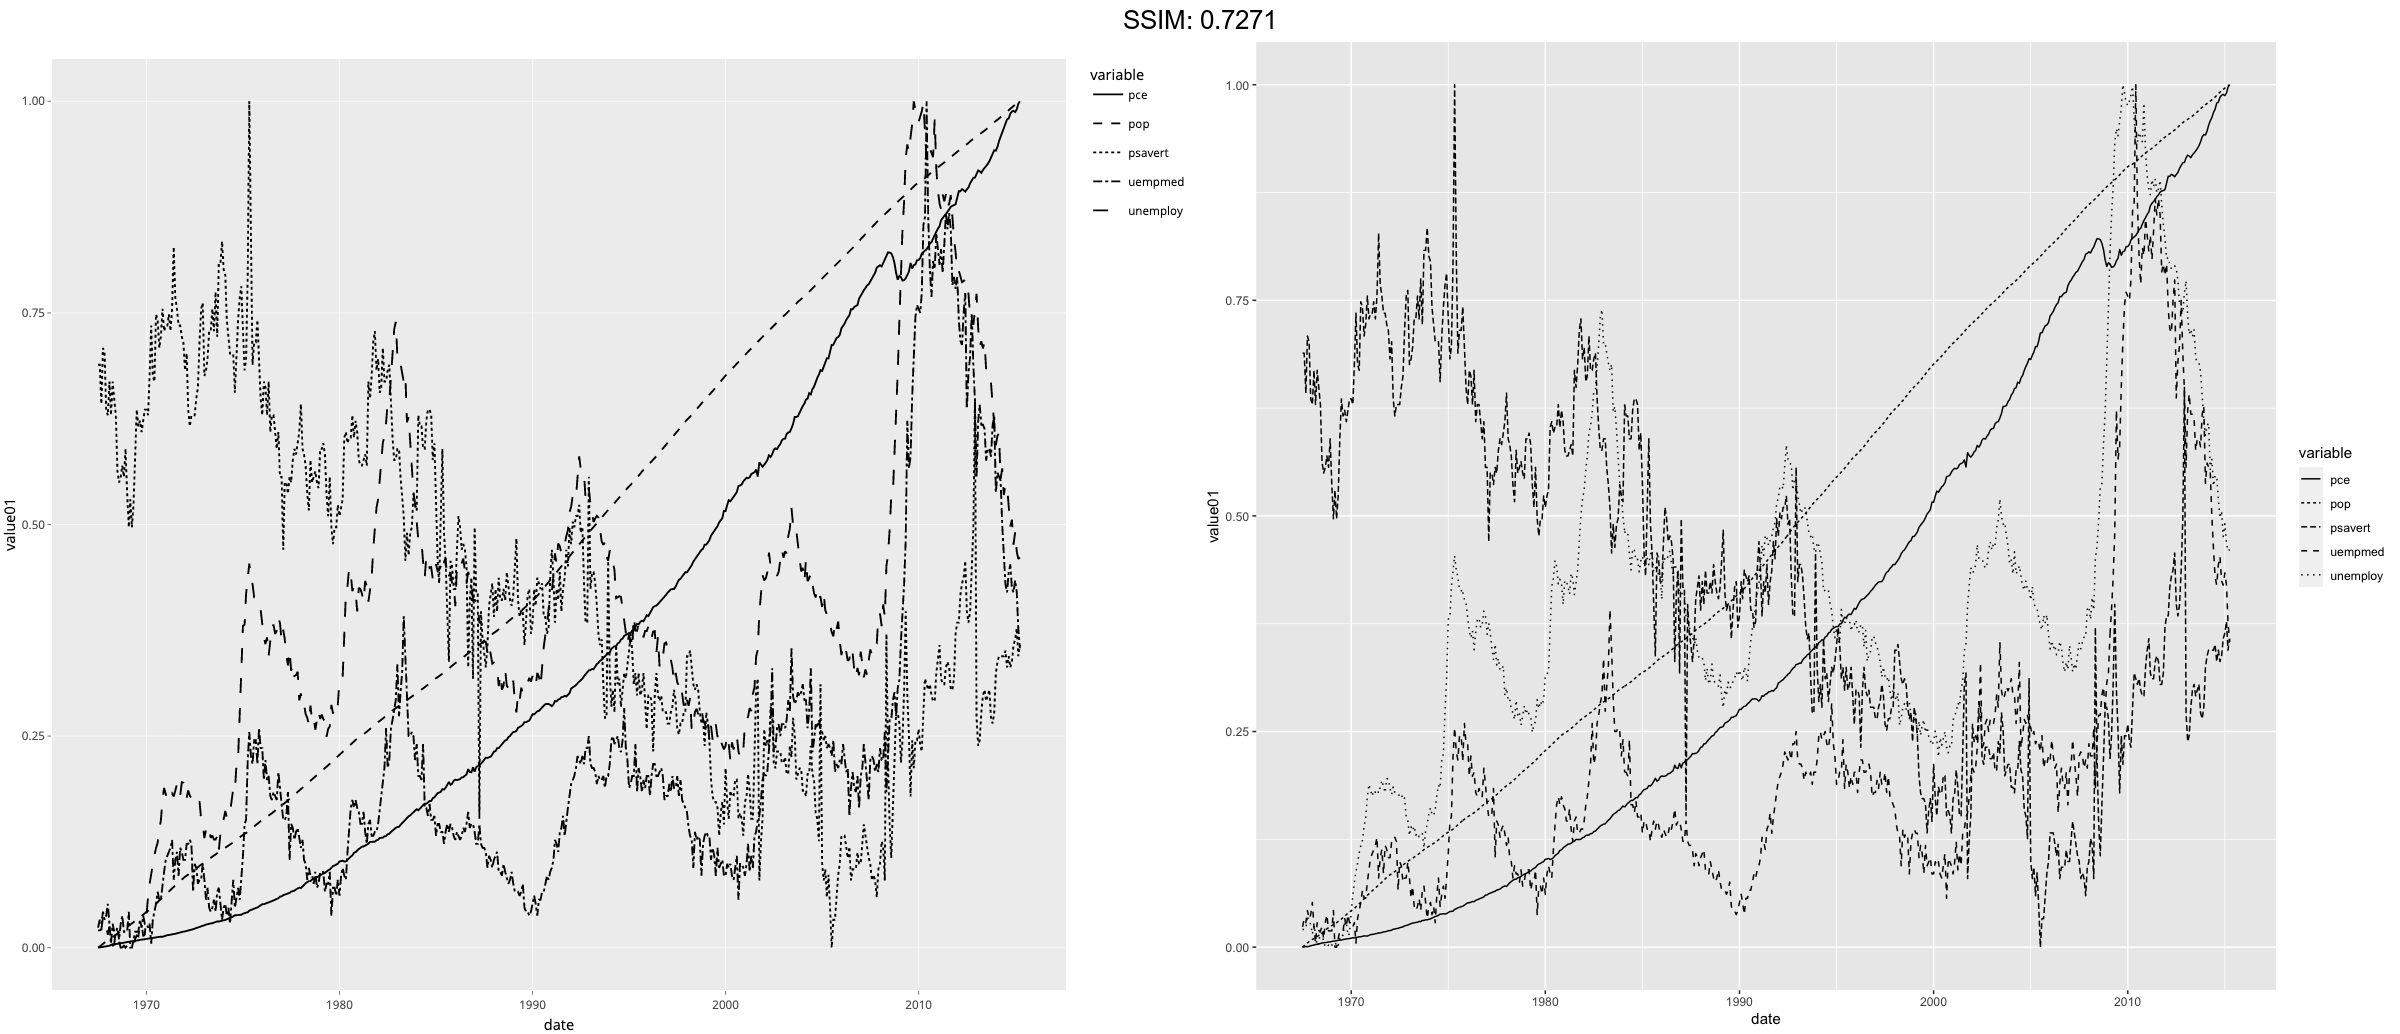
p <-  ggplot(economics_long, aes(date, value01)) +
  geom_line(aes(linetype = variable))
plotly::ggplotly(p)

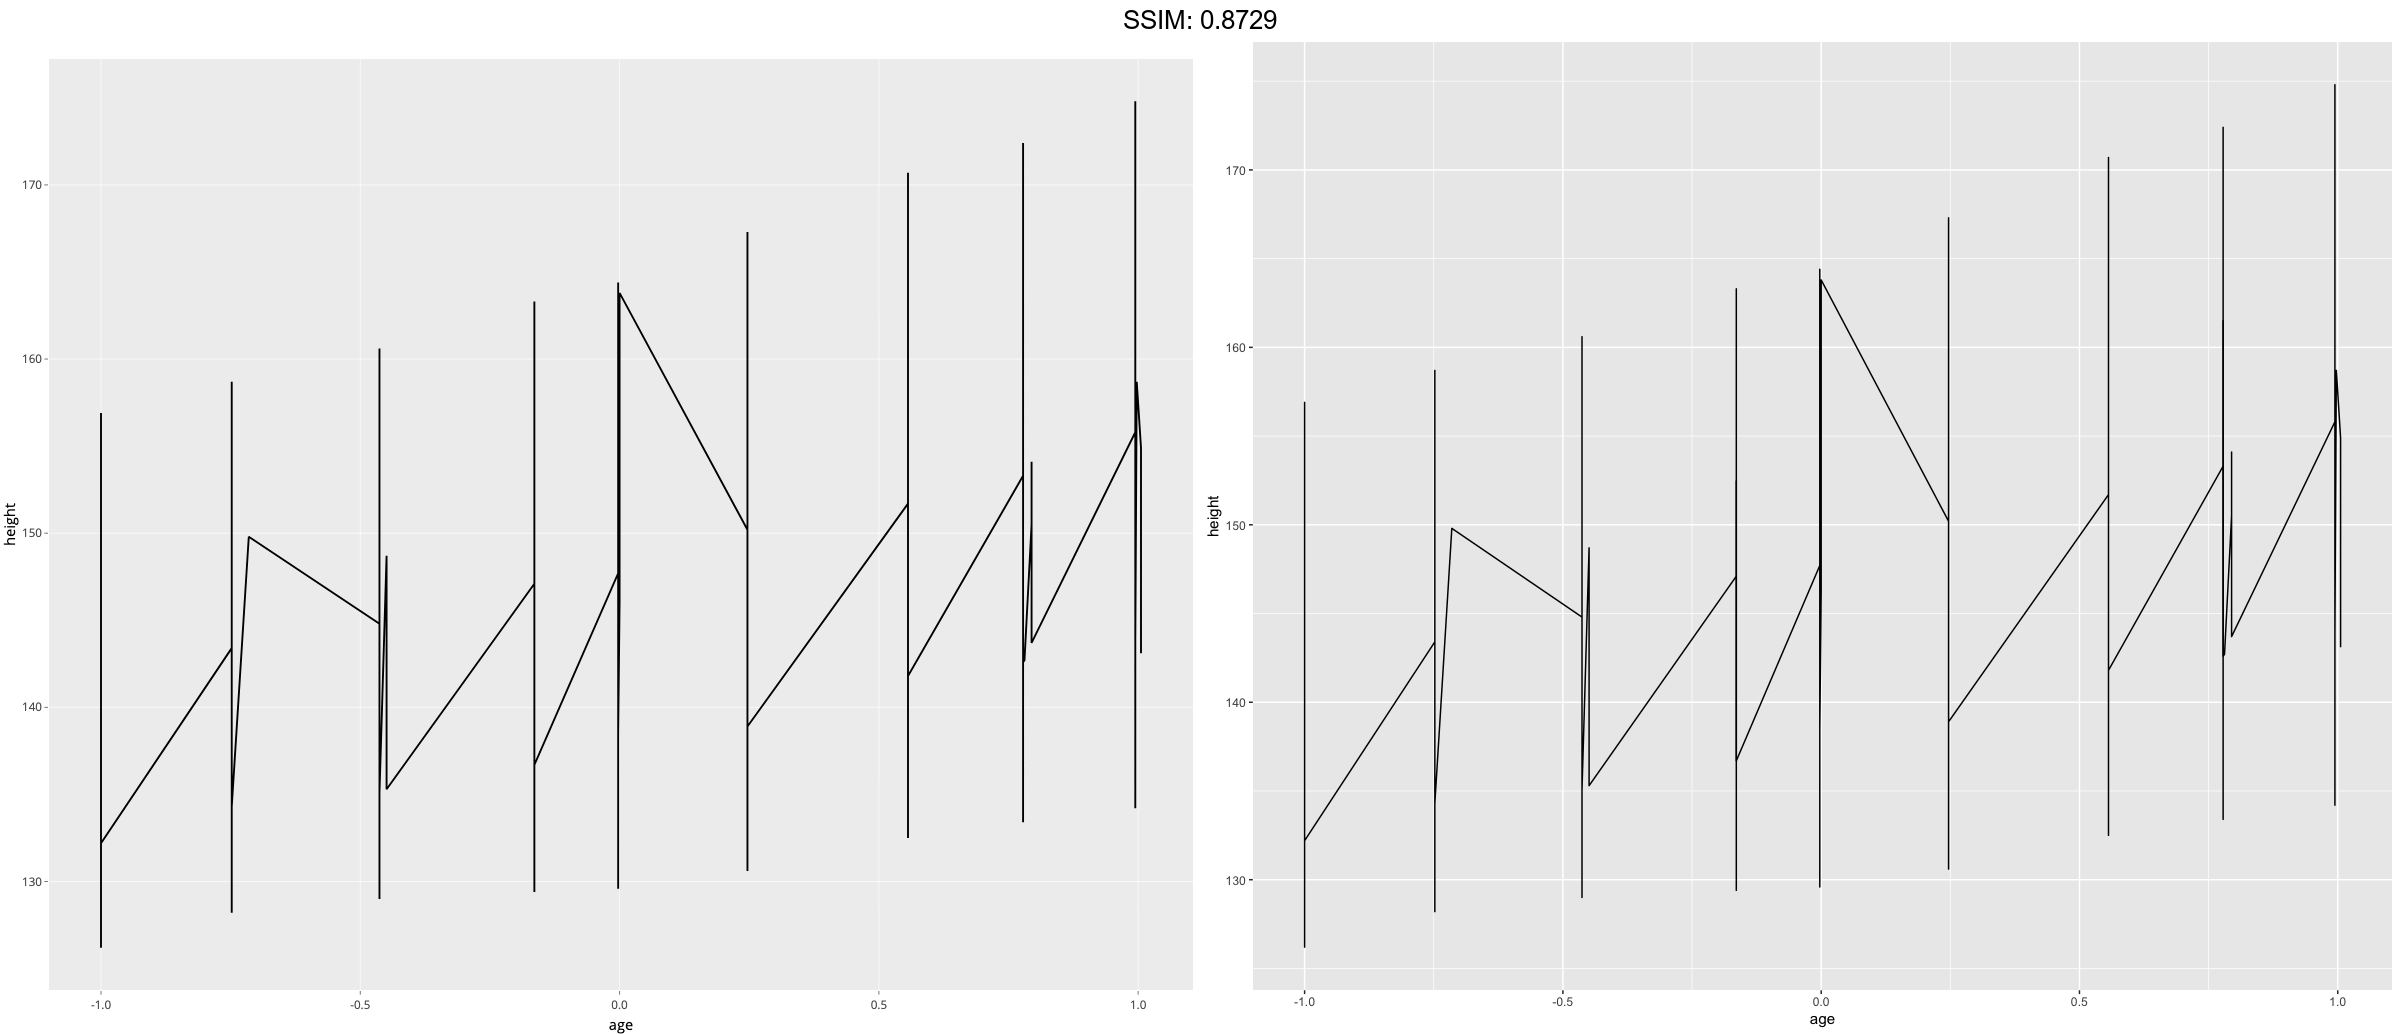
p <- ggplot(nlme::Oxboys, aes(age, height))
p <-  p + geom_line()
plotly::ggplotly(p)

p <- ggplot(nlme::Oxboys, aes(age, height))
p <-  p + geom_line(aes(group = Subject))
plotly::ggplotly(p)

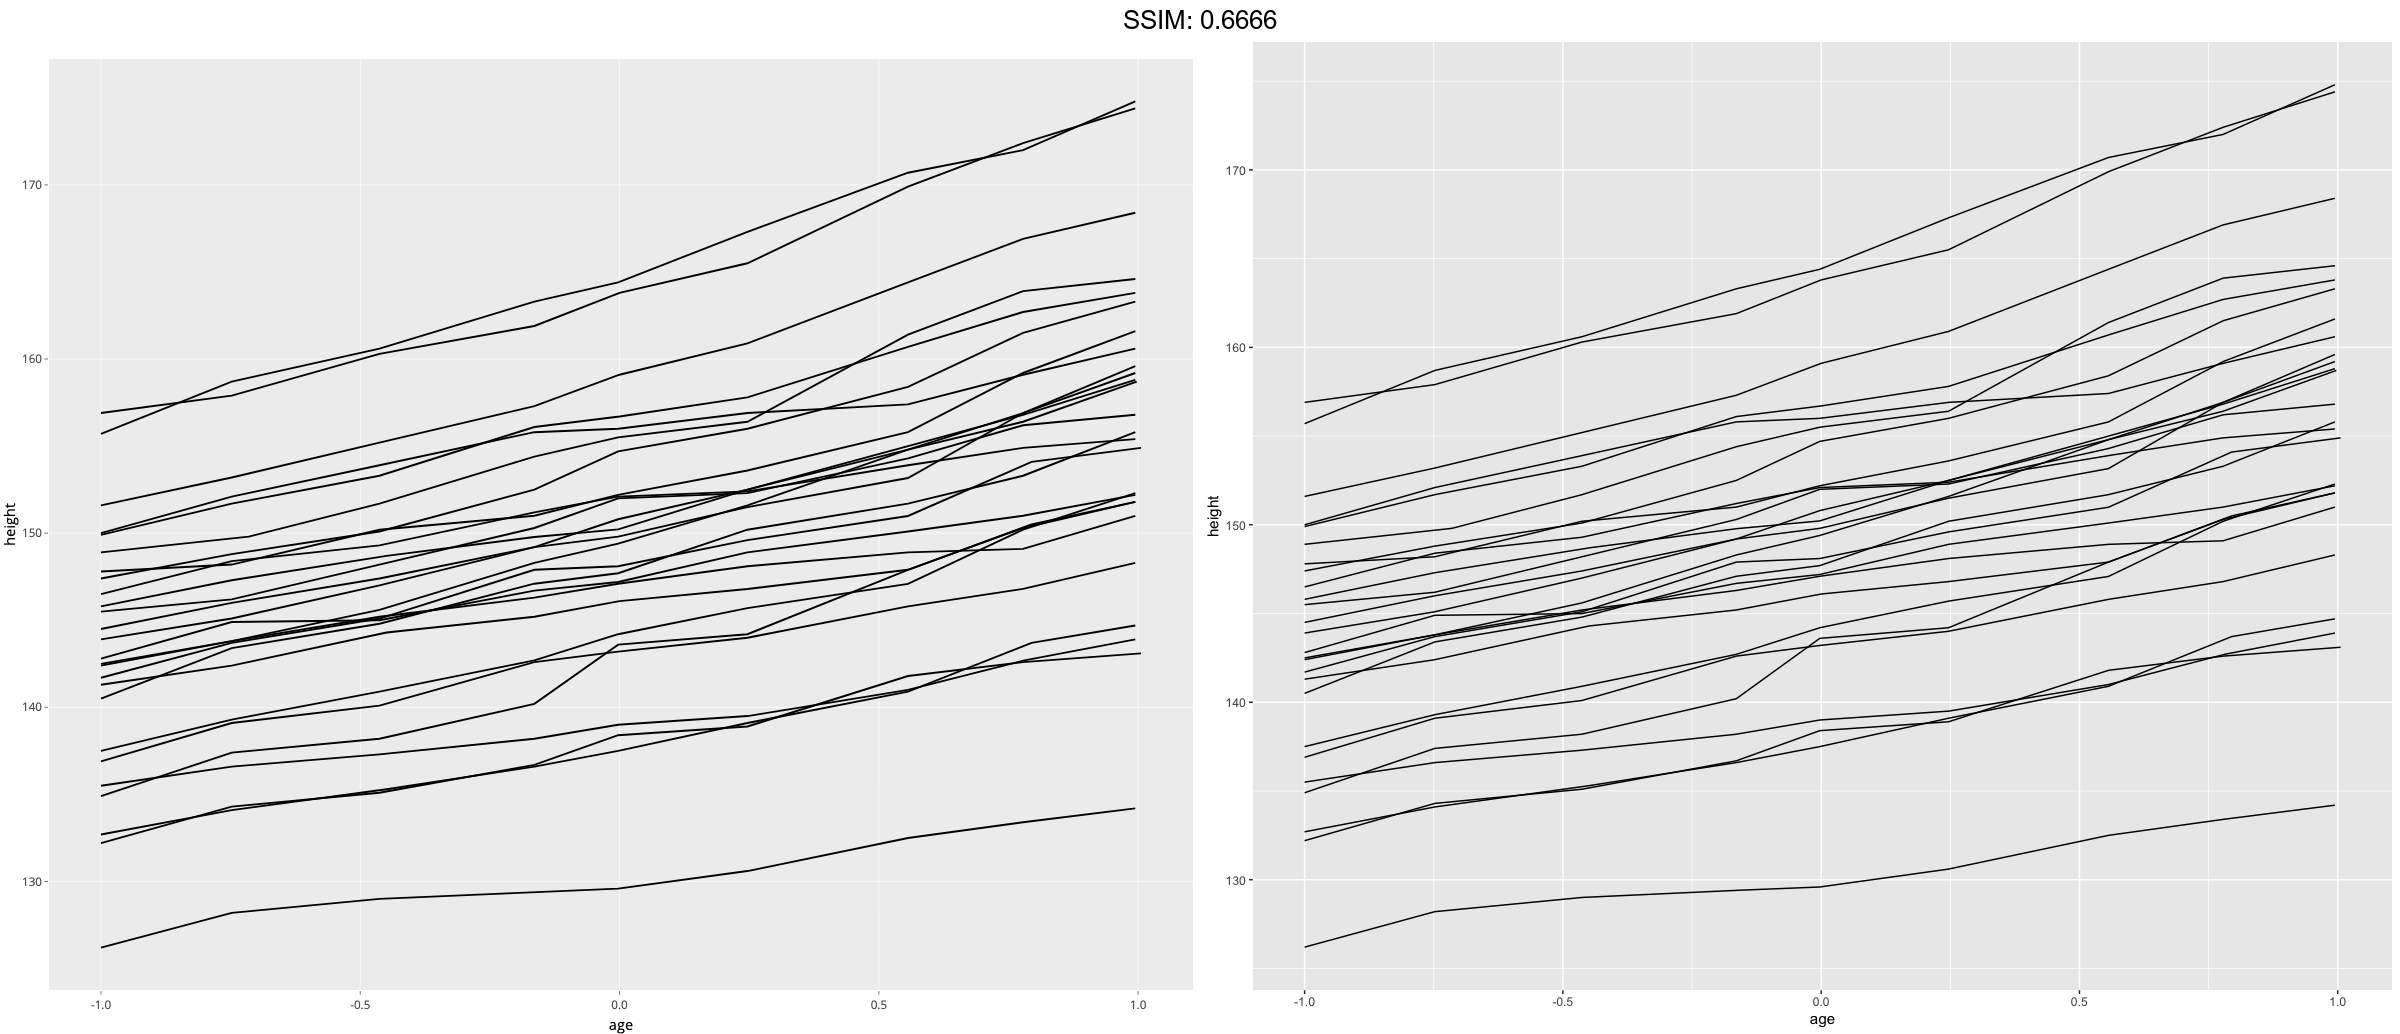
p <- p + geom_line(aes(group = Subject))
p <-  p + geom_smooth(aes(group = Subject), method = "lm", se = FALSE)
plotly::ggplotly(p)
## `geom_smooth()` using formula 'y ~ x'


p <- p + geom_line(aes(group = Subject))
p <-  p + geom_smooth(aes(group = 1), size = 2, method = "lm", se = FALSE)
plotly::ggplotly(p)
## `geom_smooth()` using formula 'y ~ x'
## `geom_smooth()` using formula 'y ~ x'


p <- ggplot(nlme::Oxboys, aes(Occasion, height)) + geom_boxplot()
plotly::ggplotly(p)

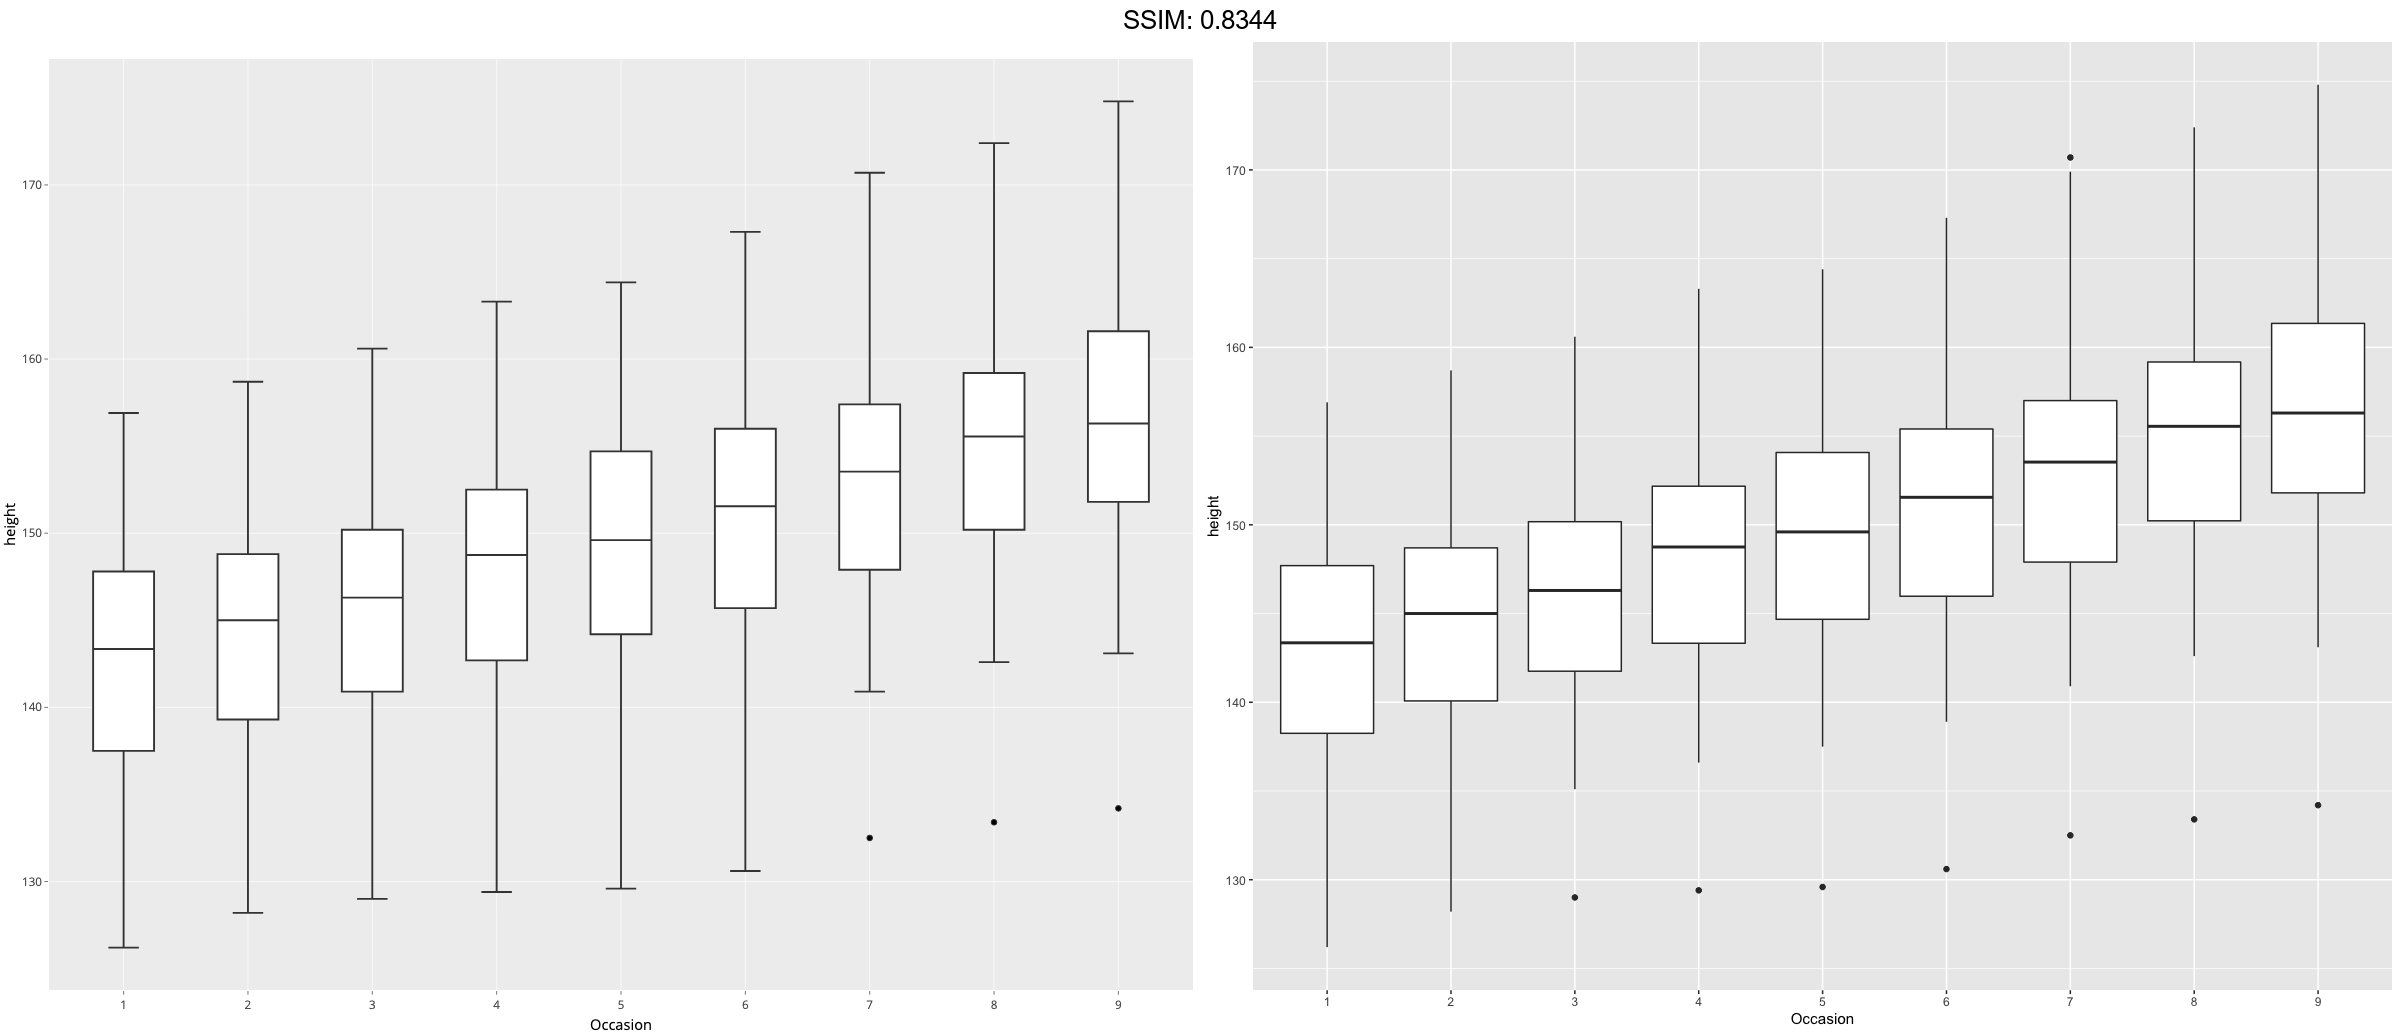
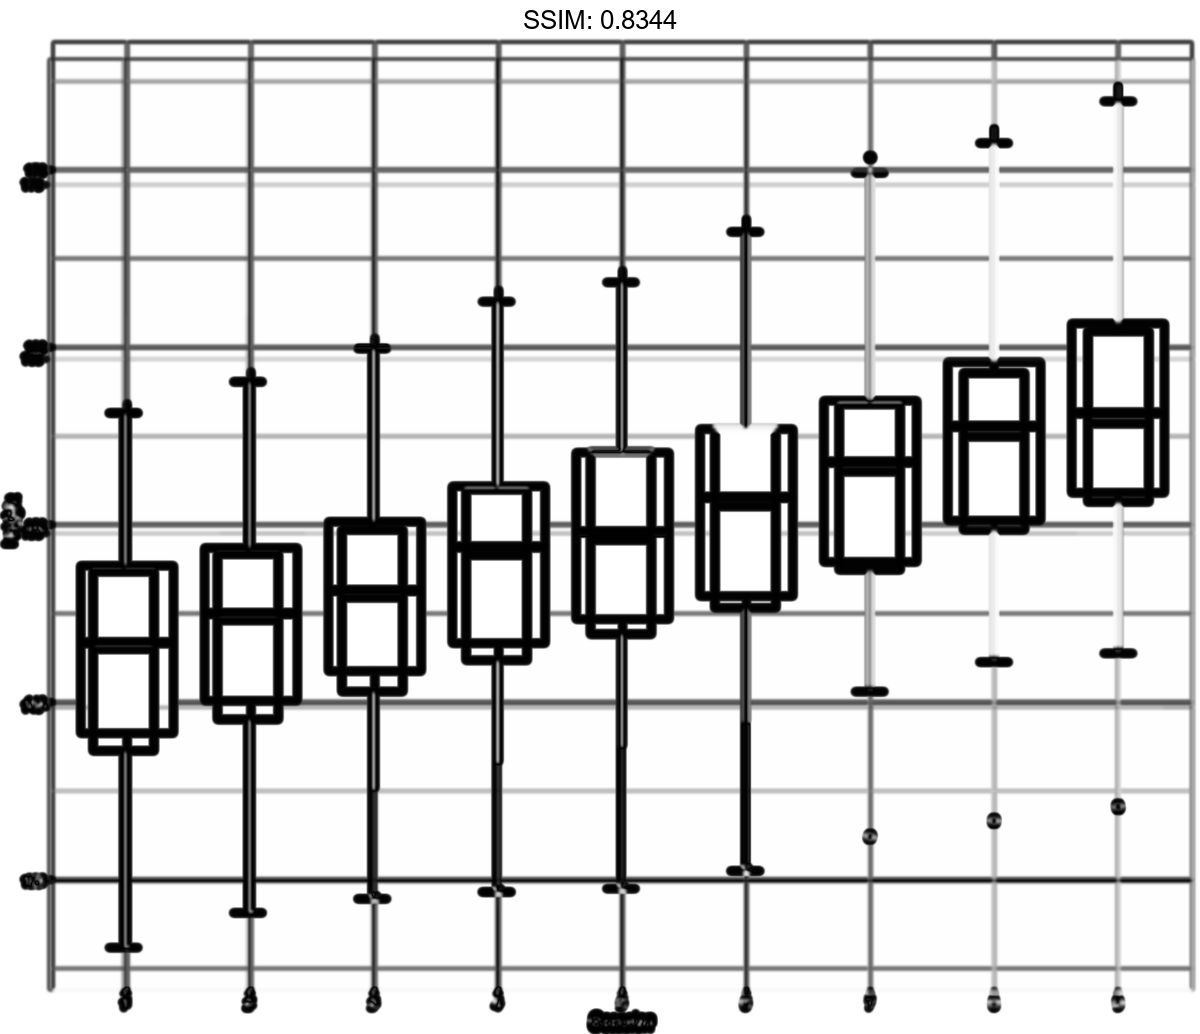
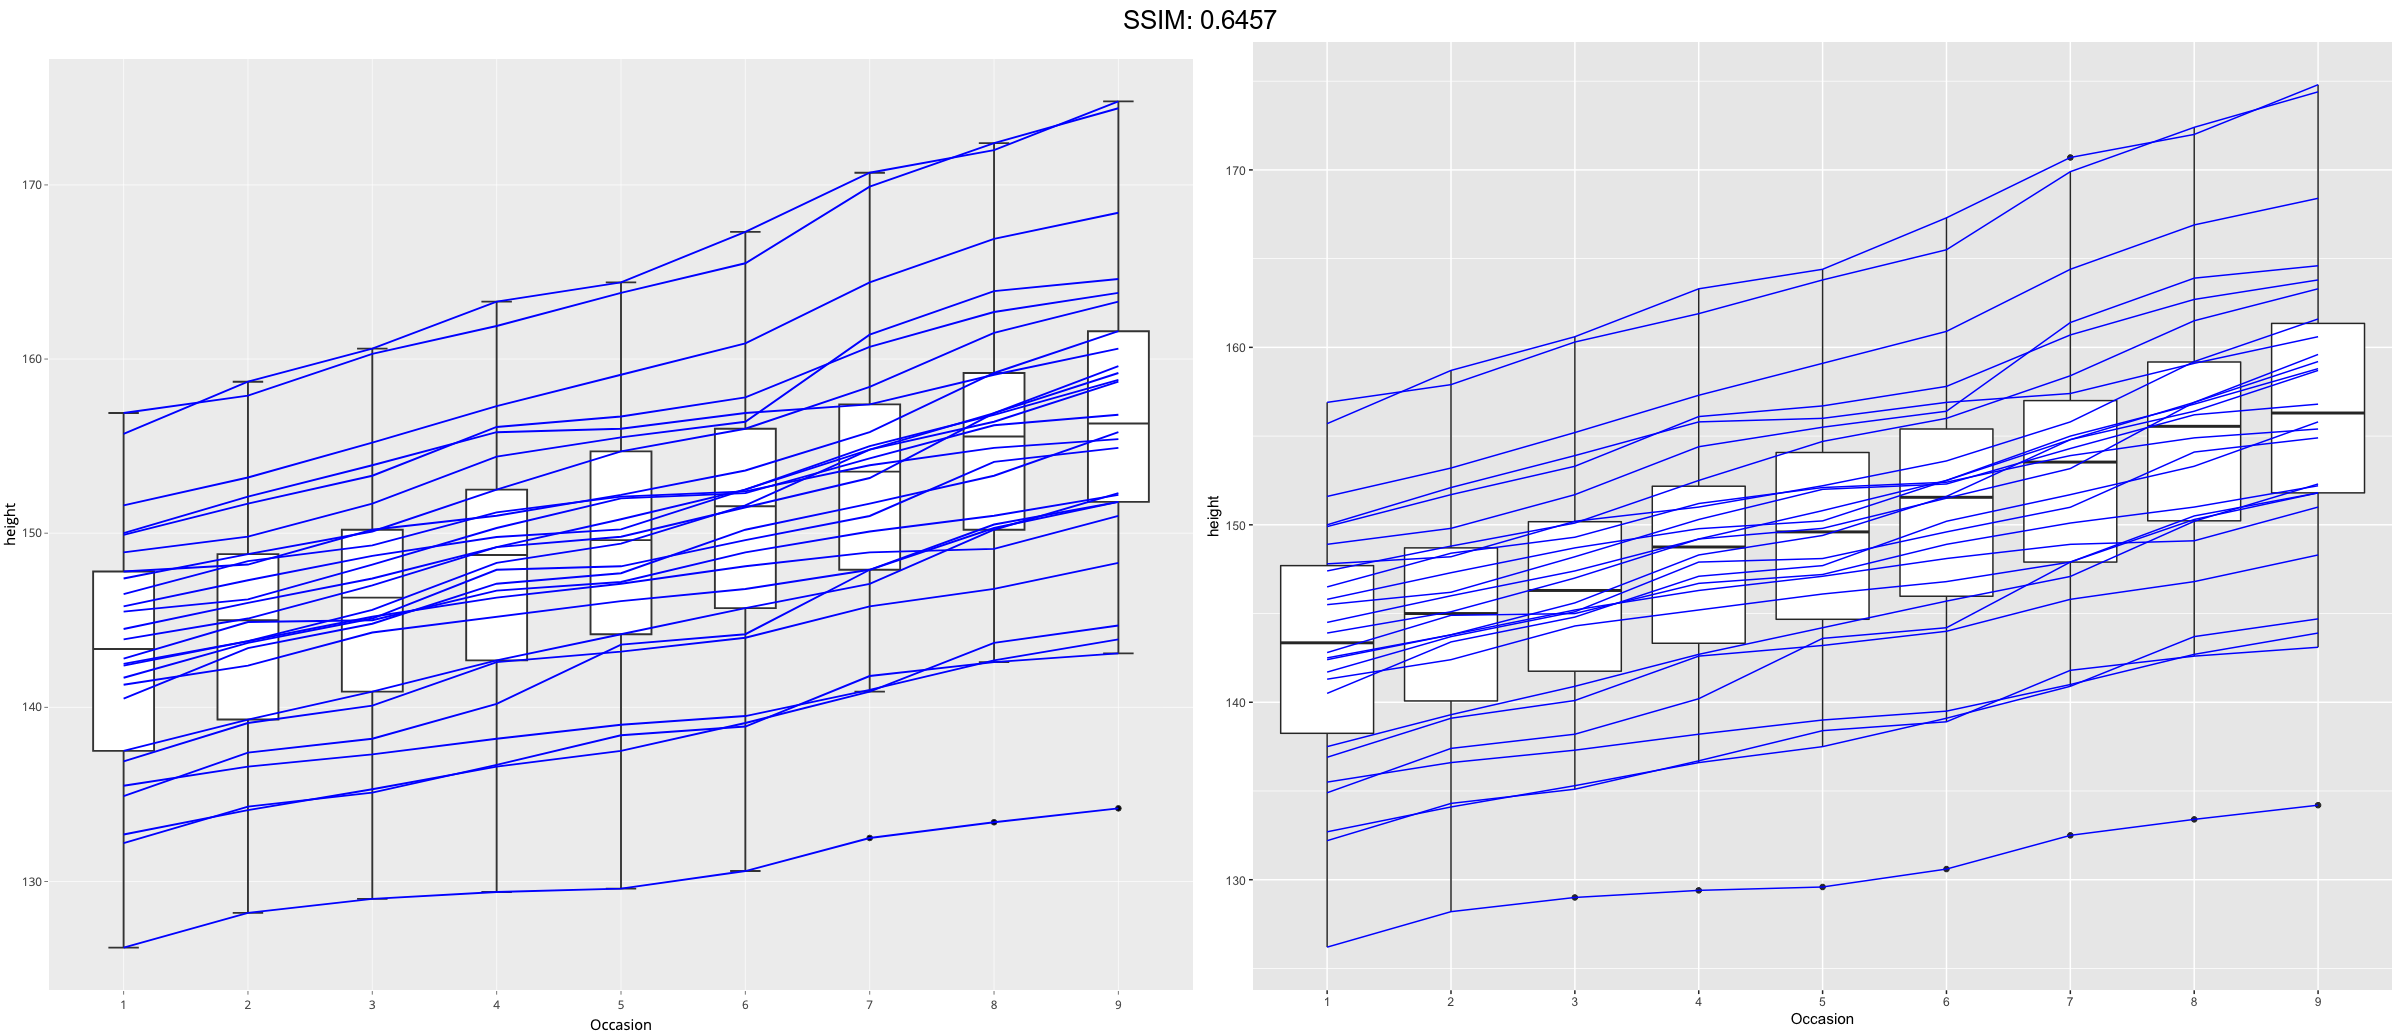
p <- ggplot(nlme::Oxboys, aes(Occasion, height)) + geom_boxplot()
p <-  p + geom_line(aes(group = Subject), colour = "blue")
plotly::ggplotly(p)

