GGPLOT - scale_manual
Create personalized discrete scale and then convert them with ggplotly.
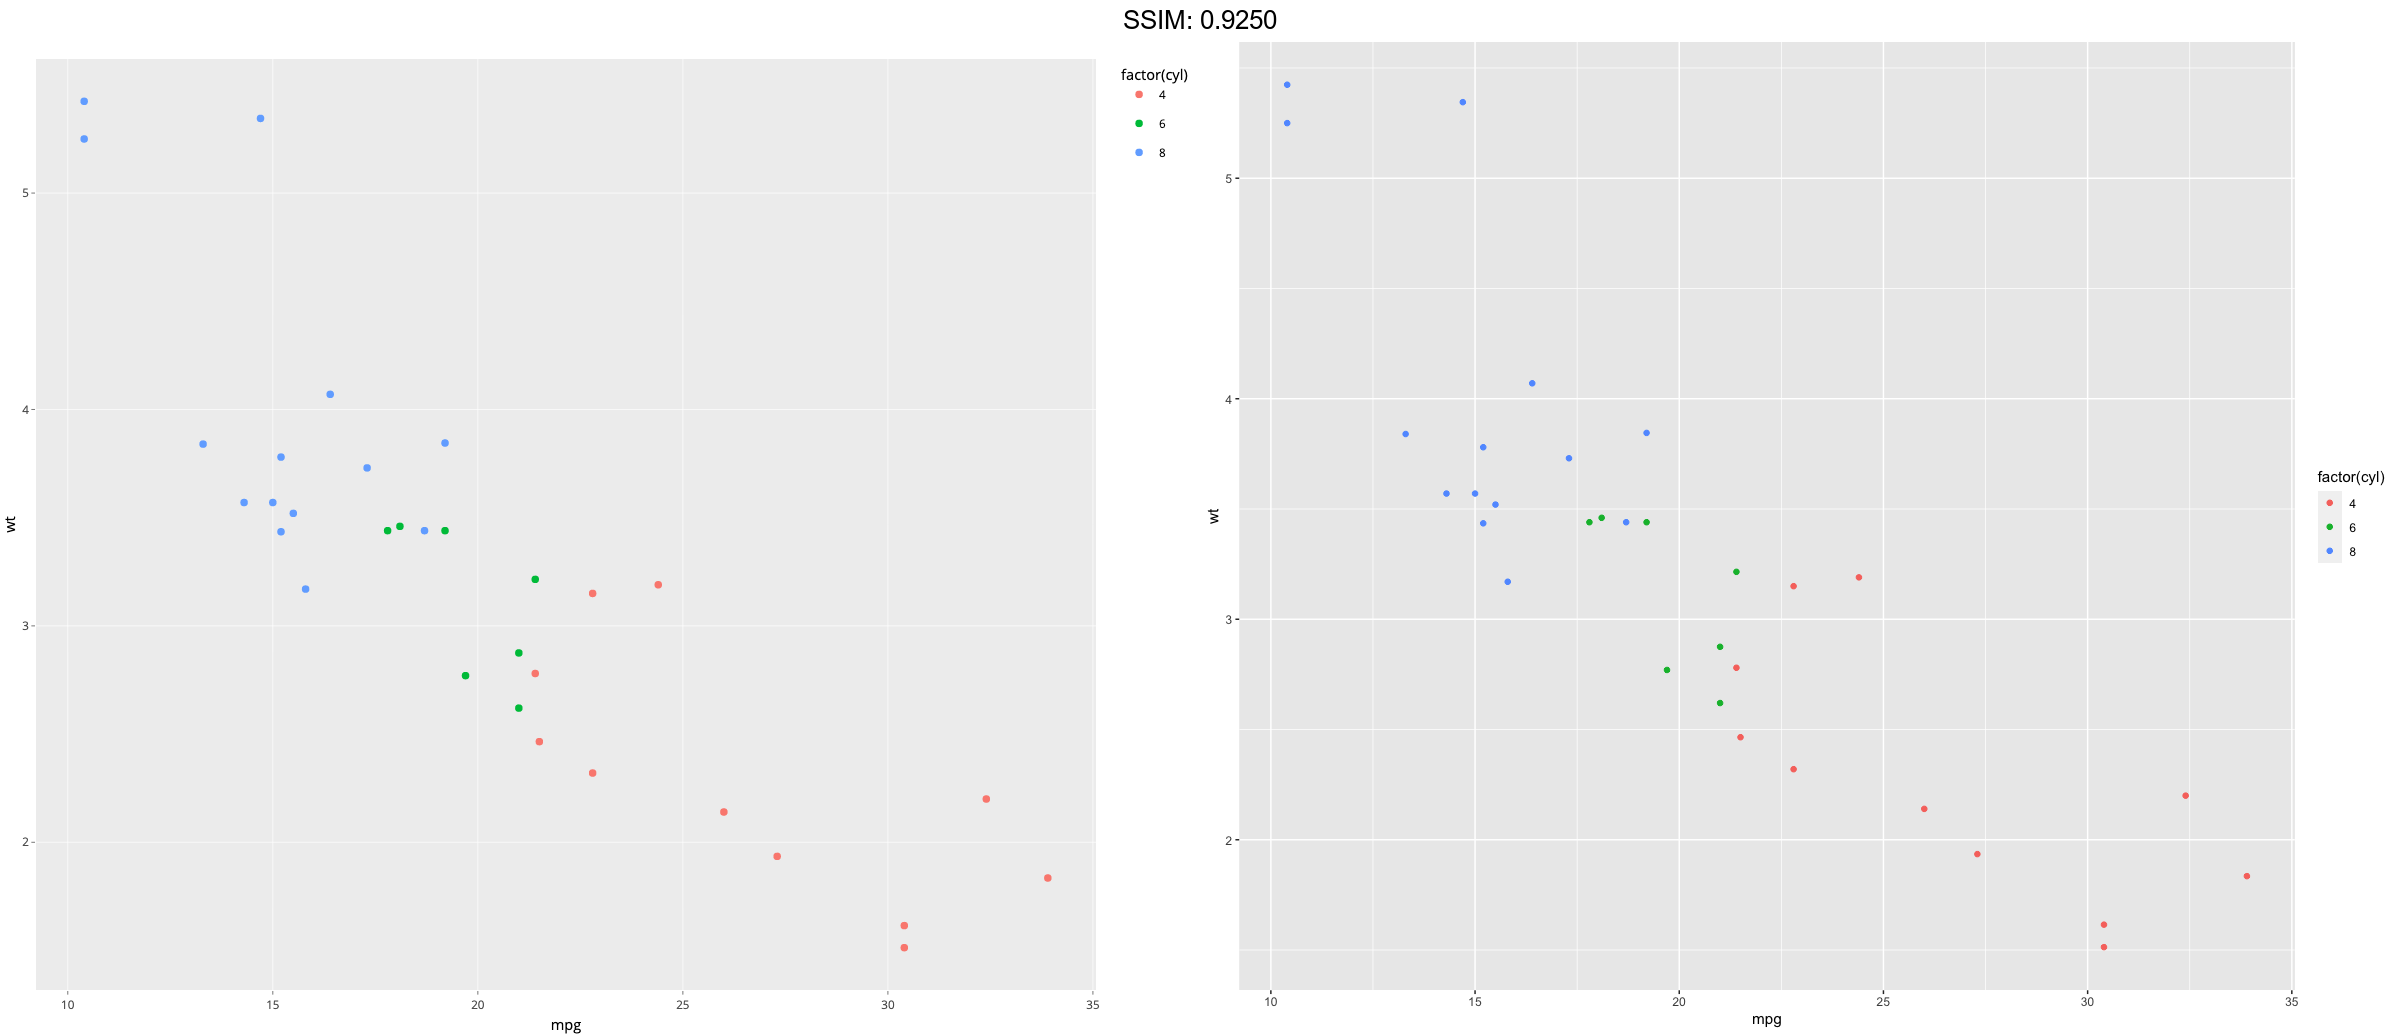
p <- ggplot(mtcars, aes(mpg, wt)) +
  geom_point(aes(colour = factor(cyl)))
plotly::ggplotly(p)


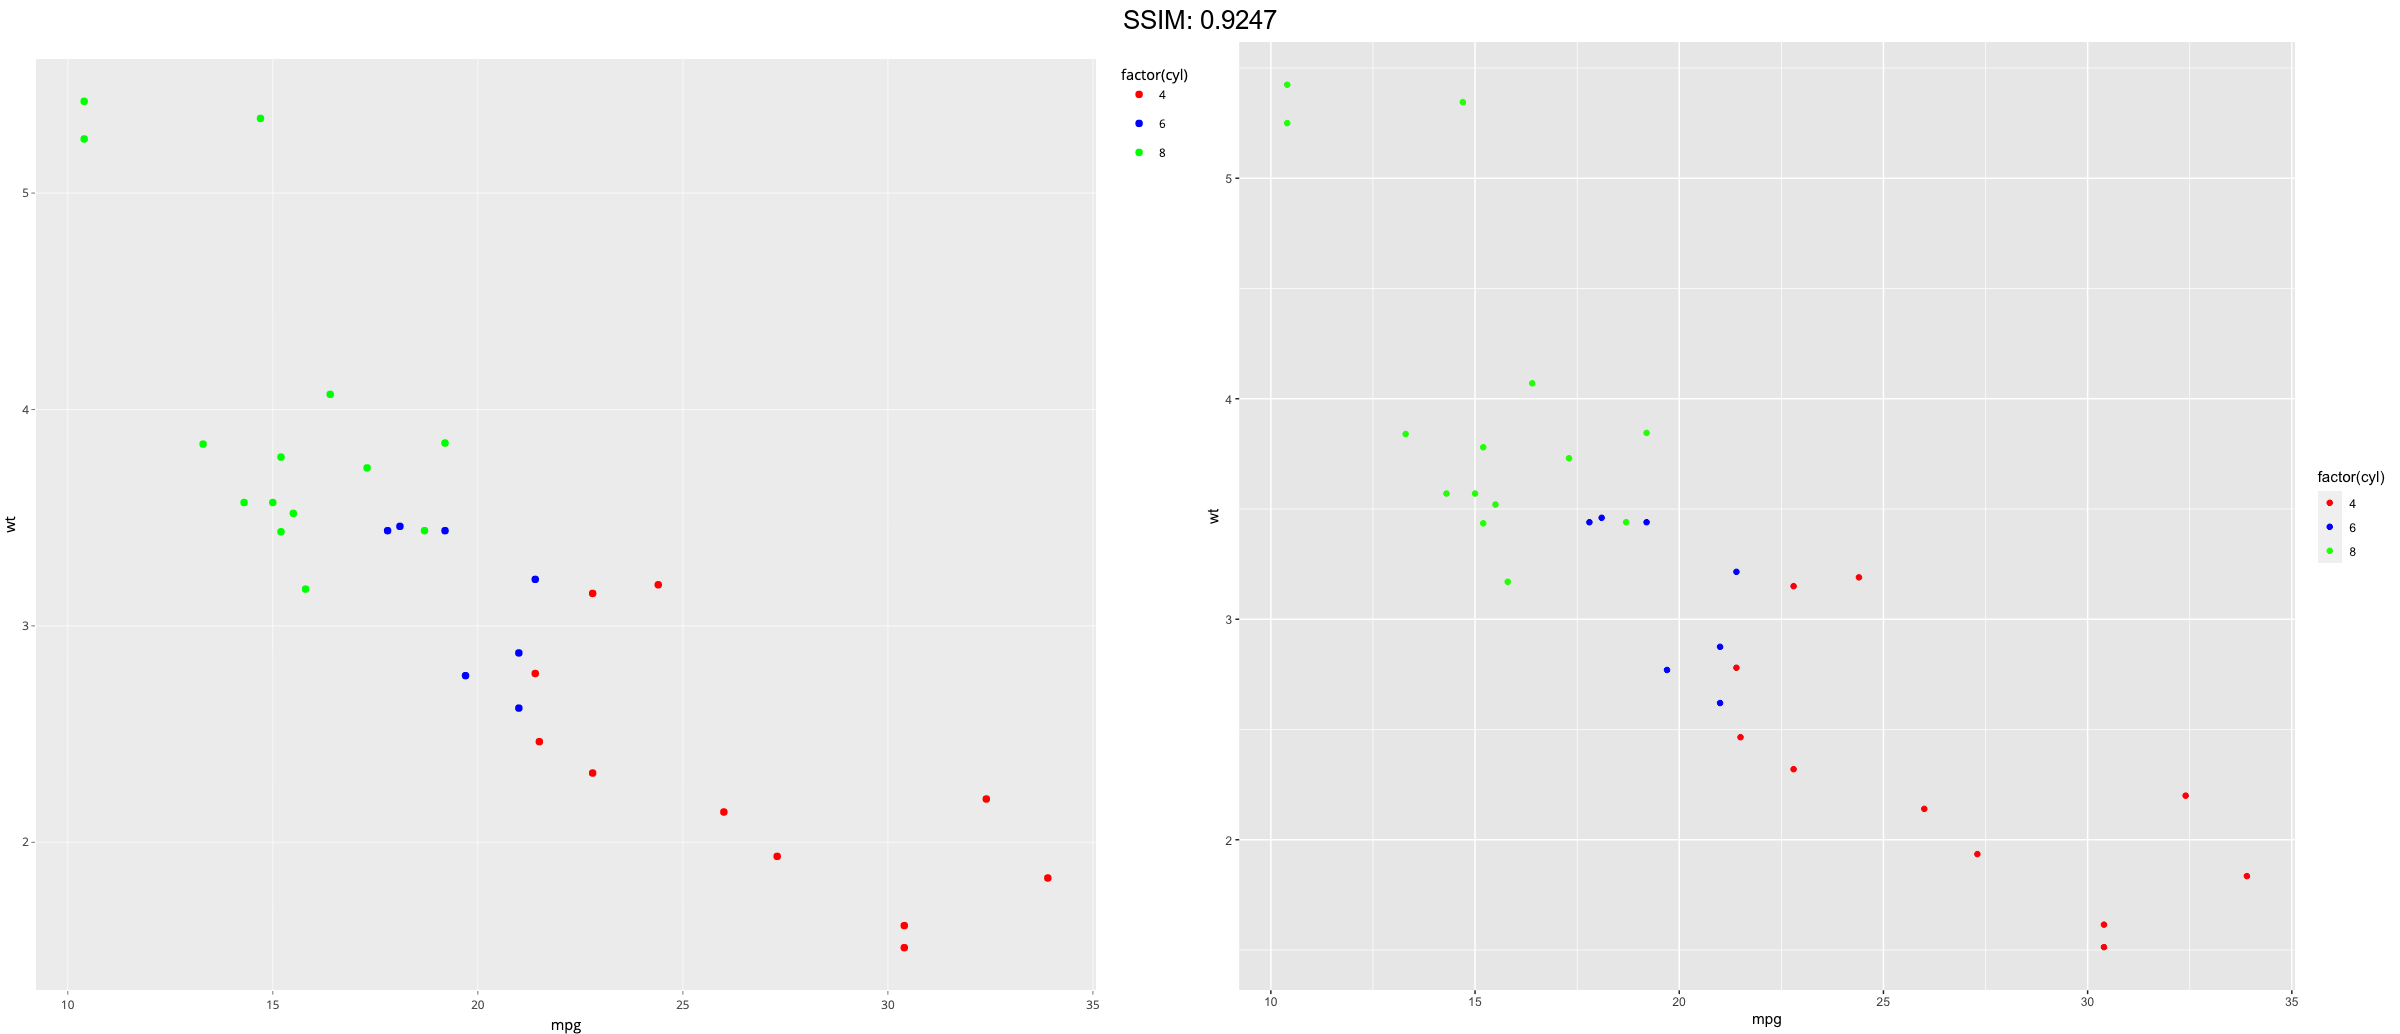
p <- ggplot(mtcars, aes(mpg, wt)) +
  geom_point(aes(colour = factor(cyl)))
p <-  p + scale_colour_manual(values = c("red", "blue", "green"))
plotly::ggplotly(p)

p <- ggplot(mtcars, aes(mpg, wt)) +
  geom_point(aes(colour = factor(cyl)))
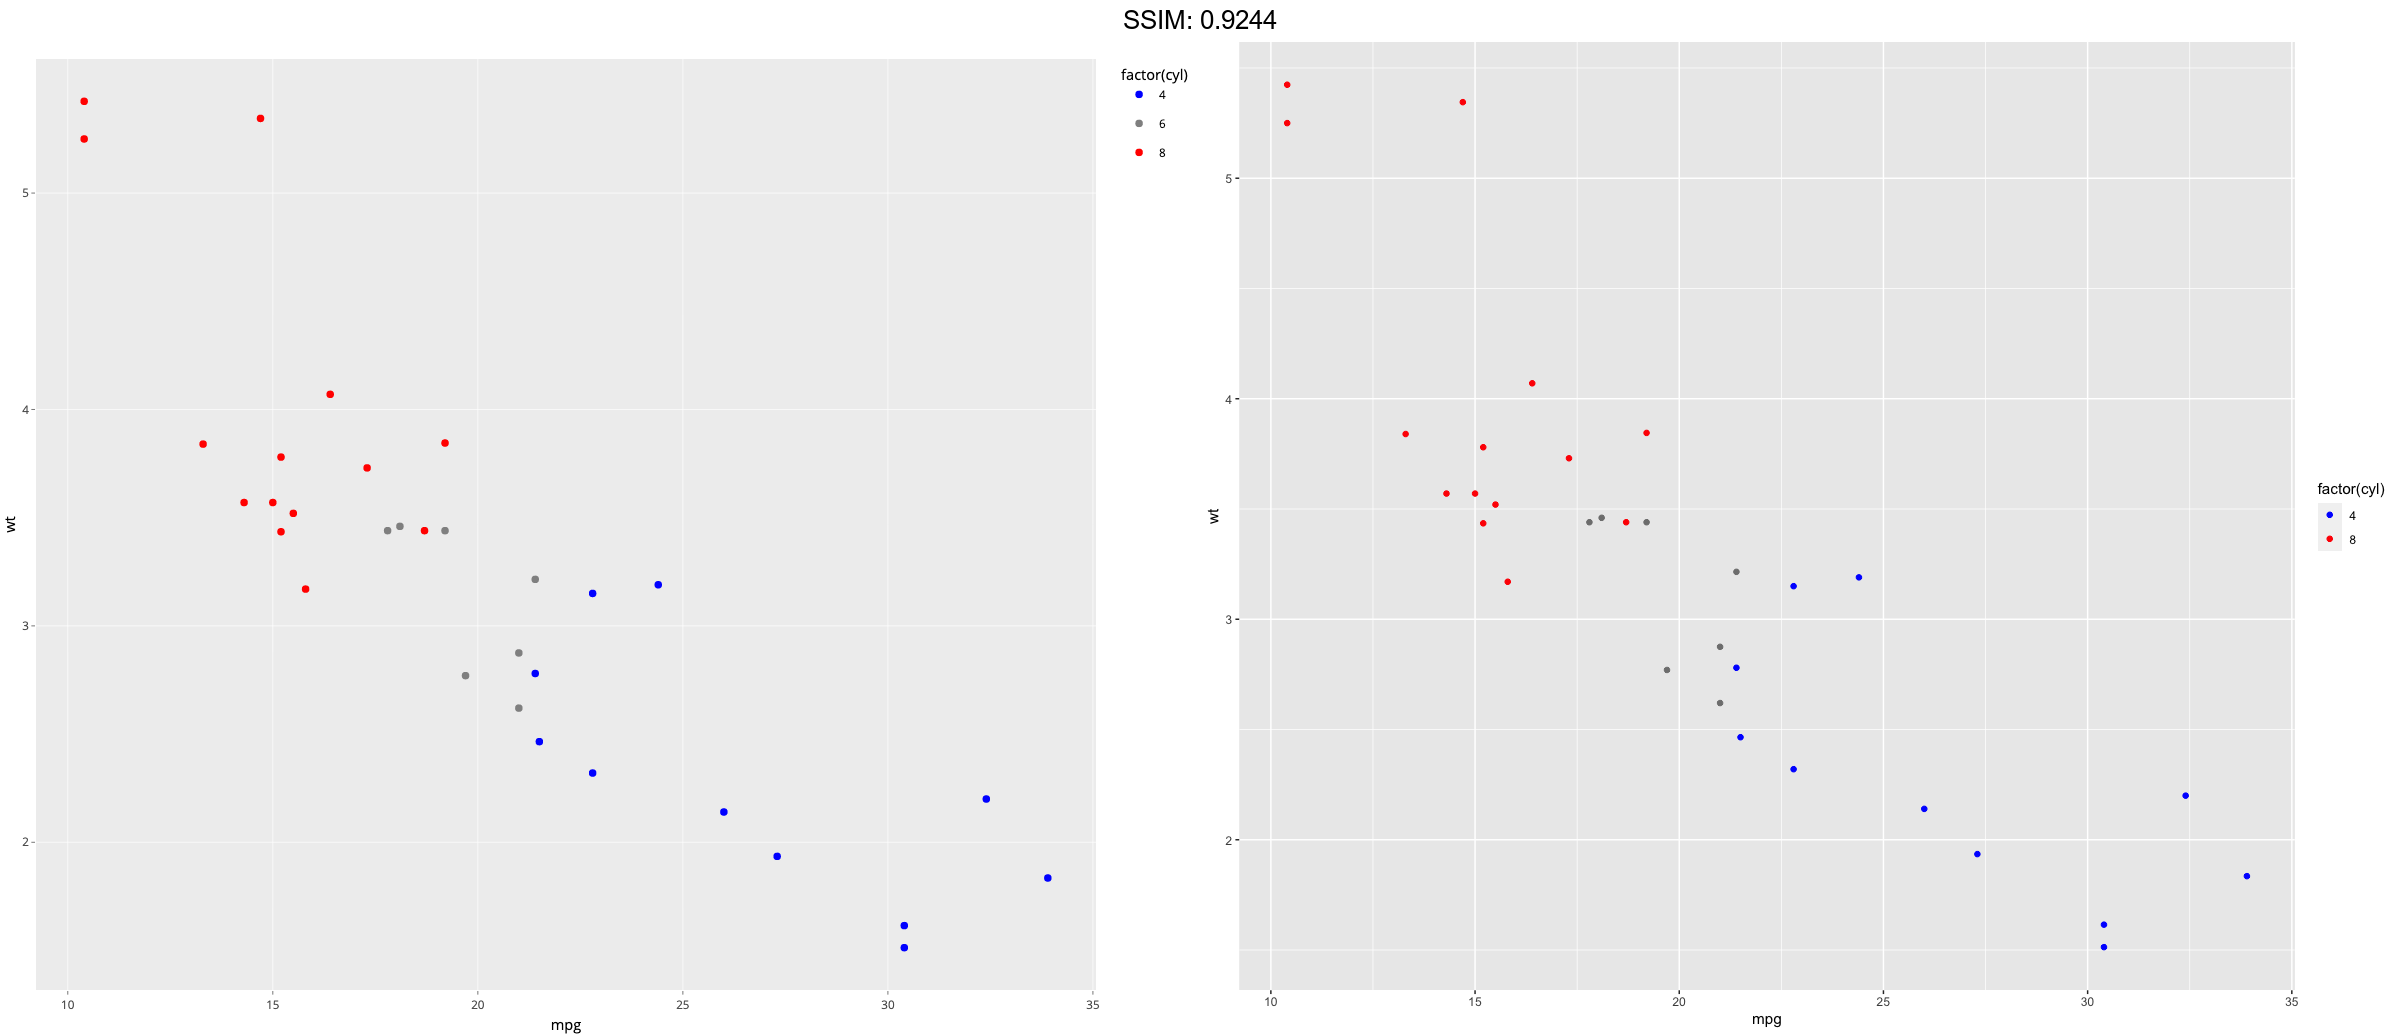
cols <- c("8" = "red", "4" = "blue", "6" = "darkgreen", "10" = "orange")
p <-  p + scale_colour_manual(values = cols)
plotly::ggplotly(p)

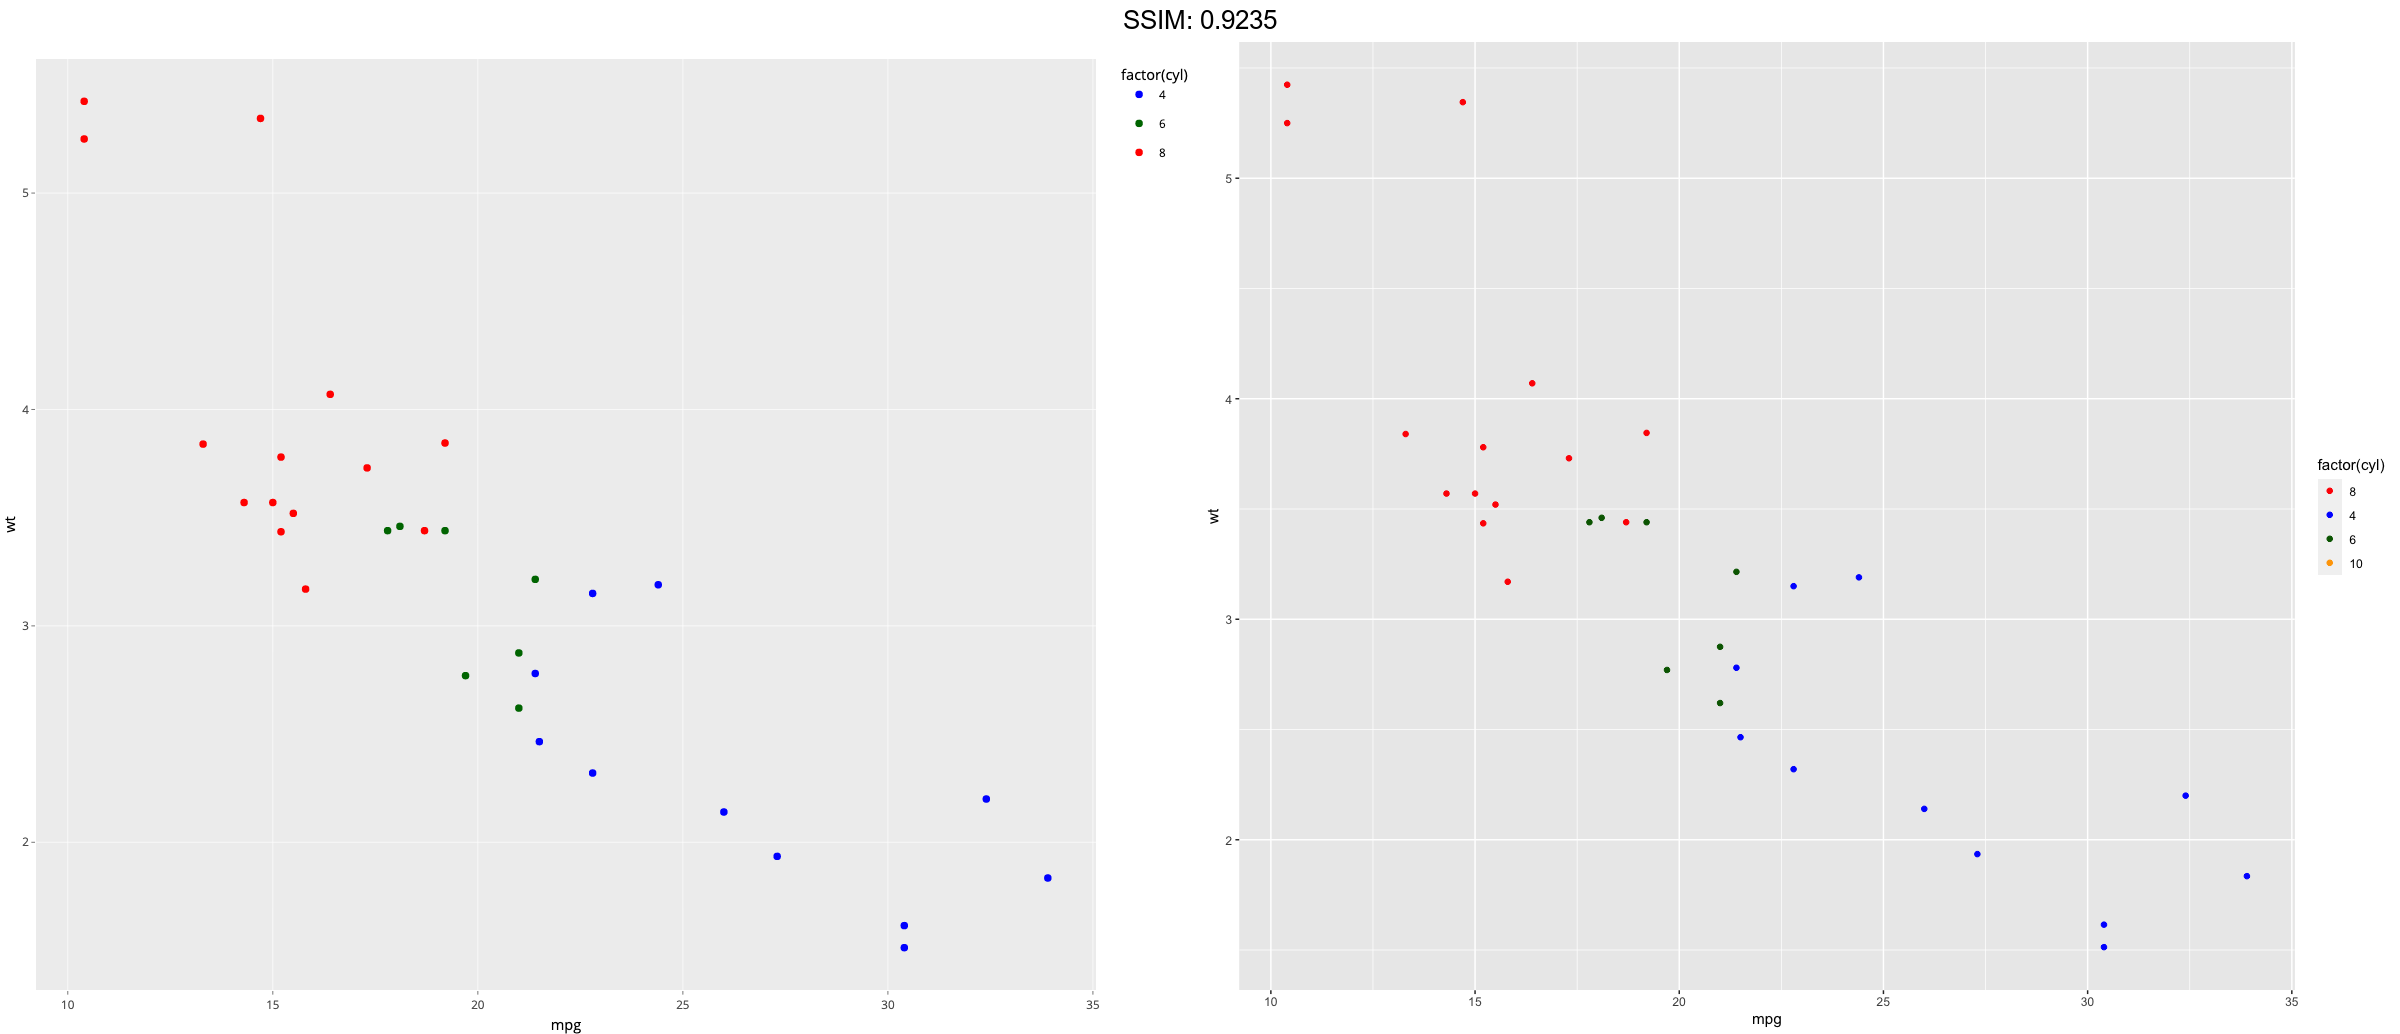

cols <- c("8" = "red", "4" = "blue", "6" = "darkgreen", "10" = "orange")
p <-
 ggplot(
  mtcars,
  aes(mpg, wt, colour = factor(cyl), fill = factor(cyl))
) +
  geom_point(shape = 21, alpha = 0.5, size = 2) +
  scale_colour_manual(
    values = cols,
    aesthetics = c("colour", "fill")
  )
plotly::ggplotly(p)
## Error in `[[<-`(`*tmp*`, sc$aesthetics, value = sc): no such index at level 1
p <- ggplot(mtcars, aes(mpg, wt)) +
  geom_point(aes(colour = factor(cyl)))
cols <- c("8" = "red", "4" = "blue", "6" = "darkgreen", "10" = "orange")
p <-  p + scale_colour_manual(values = cols)
plotly::ggplotly(p)


p <- ggplot(mtcars, aes(mpg, wt)) +
  geom_point(aes(colour = factor(cyl)))
cols <- c("8" = "red", "4" = "blue", "6" = "darkgreen", "10" = "orange")
p <-
 p + scale_colour_manual(
  values = cols,
  breaks = c("4", "6", "8"),
  labels = c("four", "six", "eight")
)
plotly::ggplotly(p)

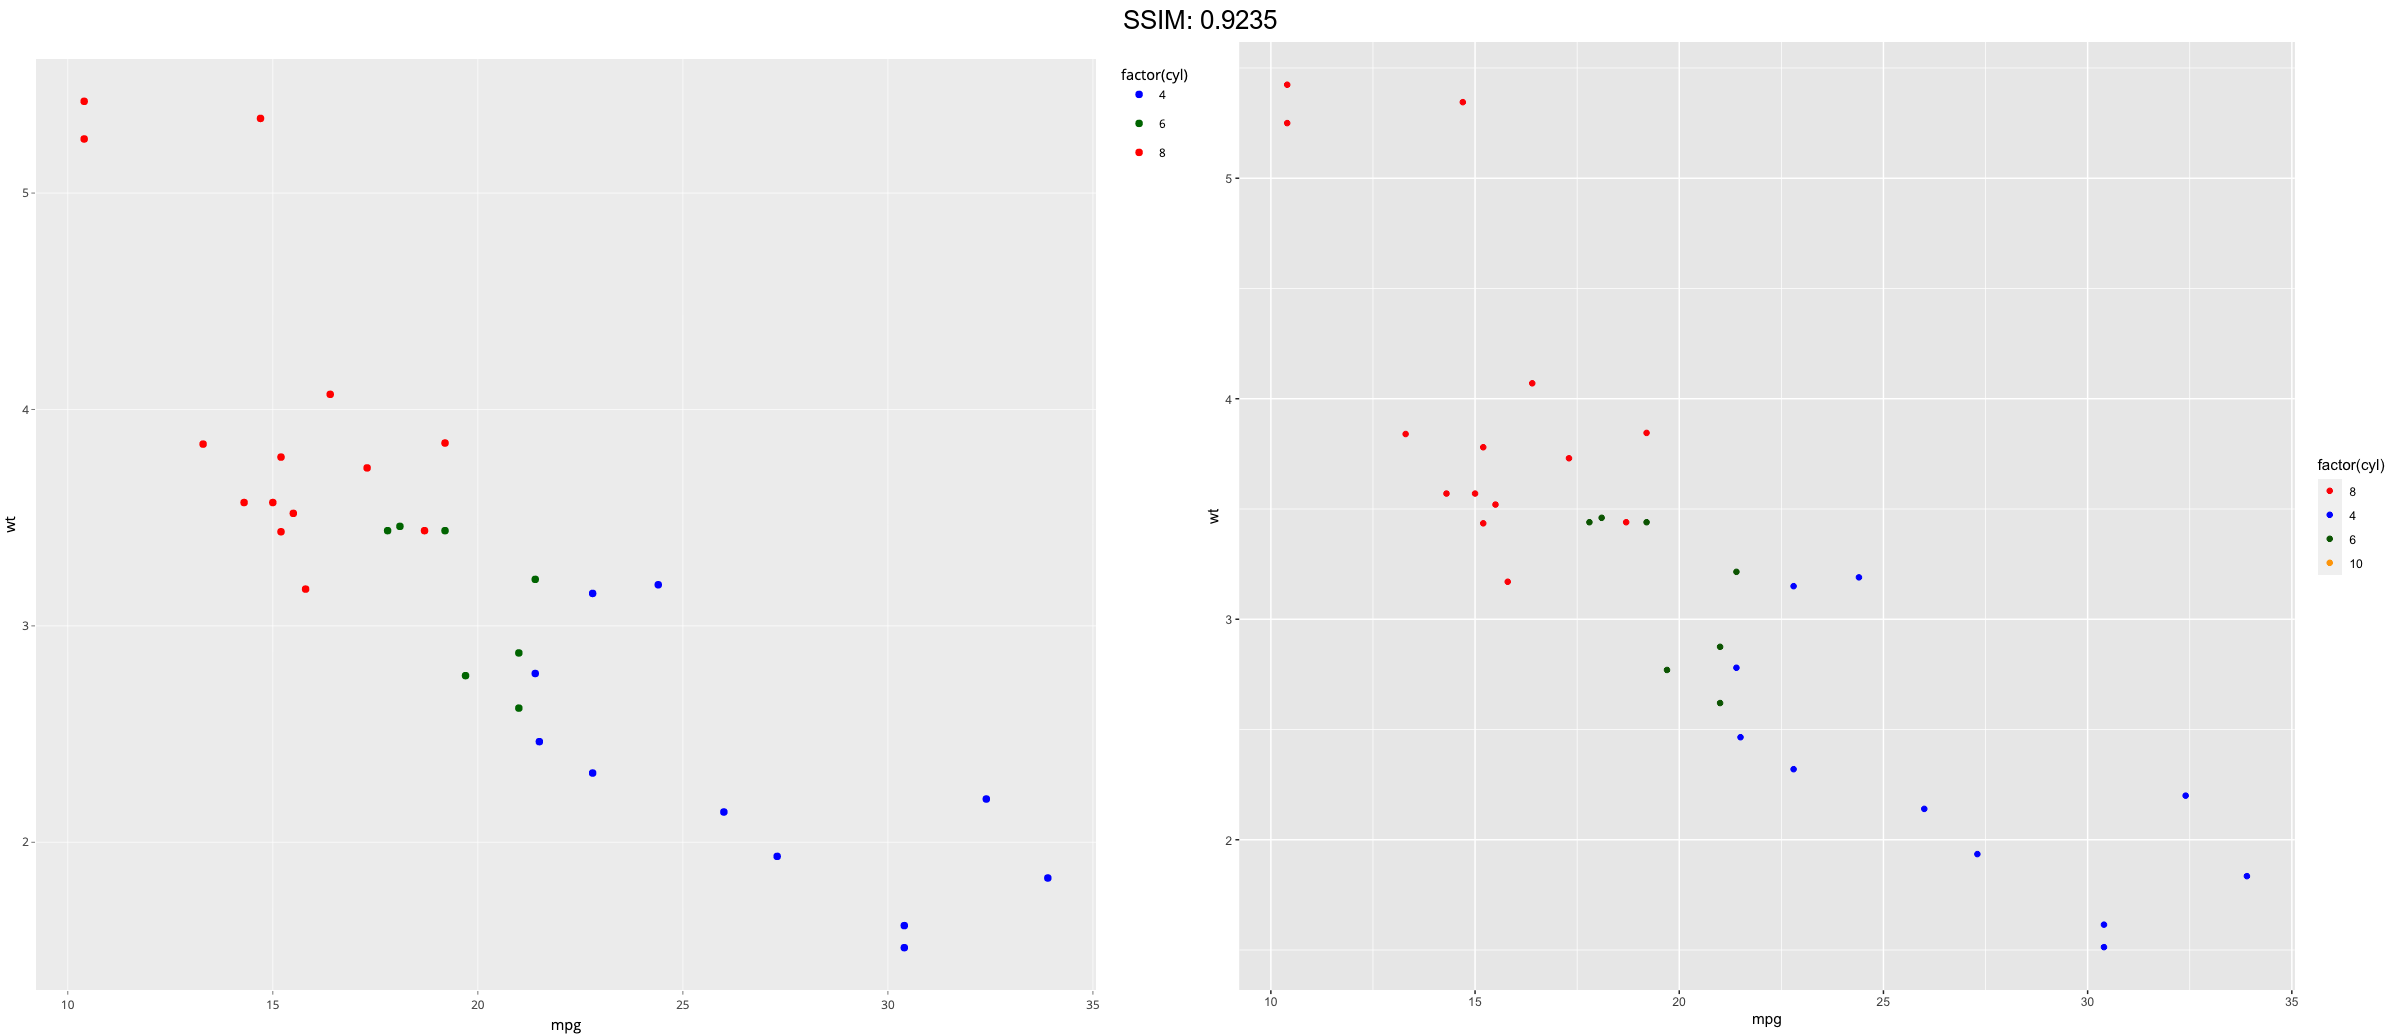

p <- ggplot(mtcars, aes(mpg, wt)) +
  geom_point(aes(colour = factor(cyl)))
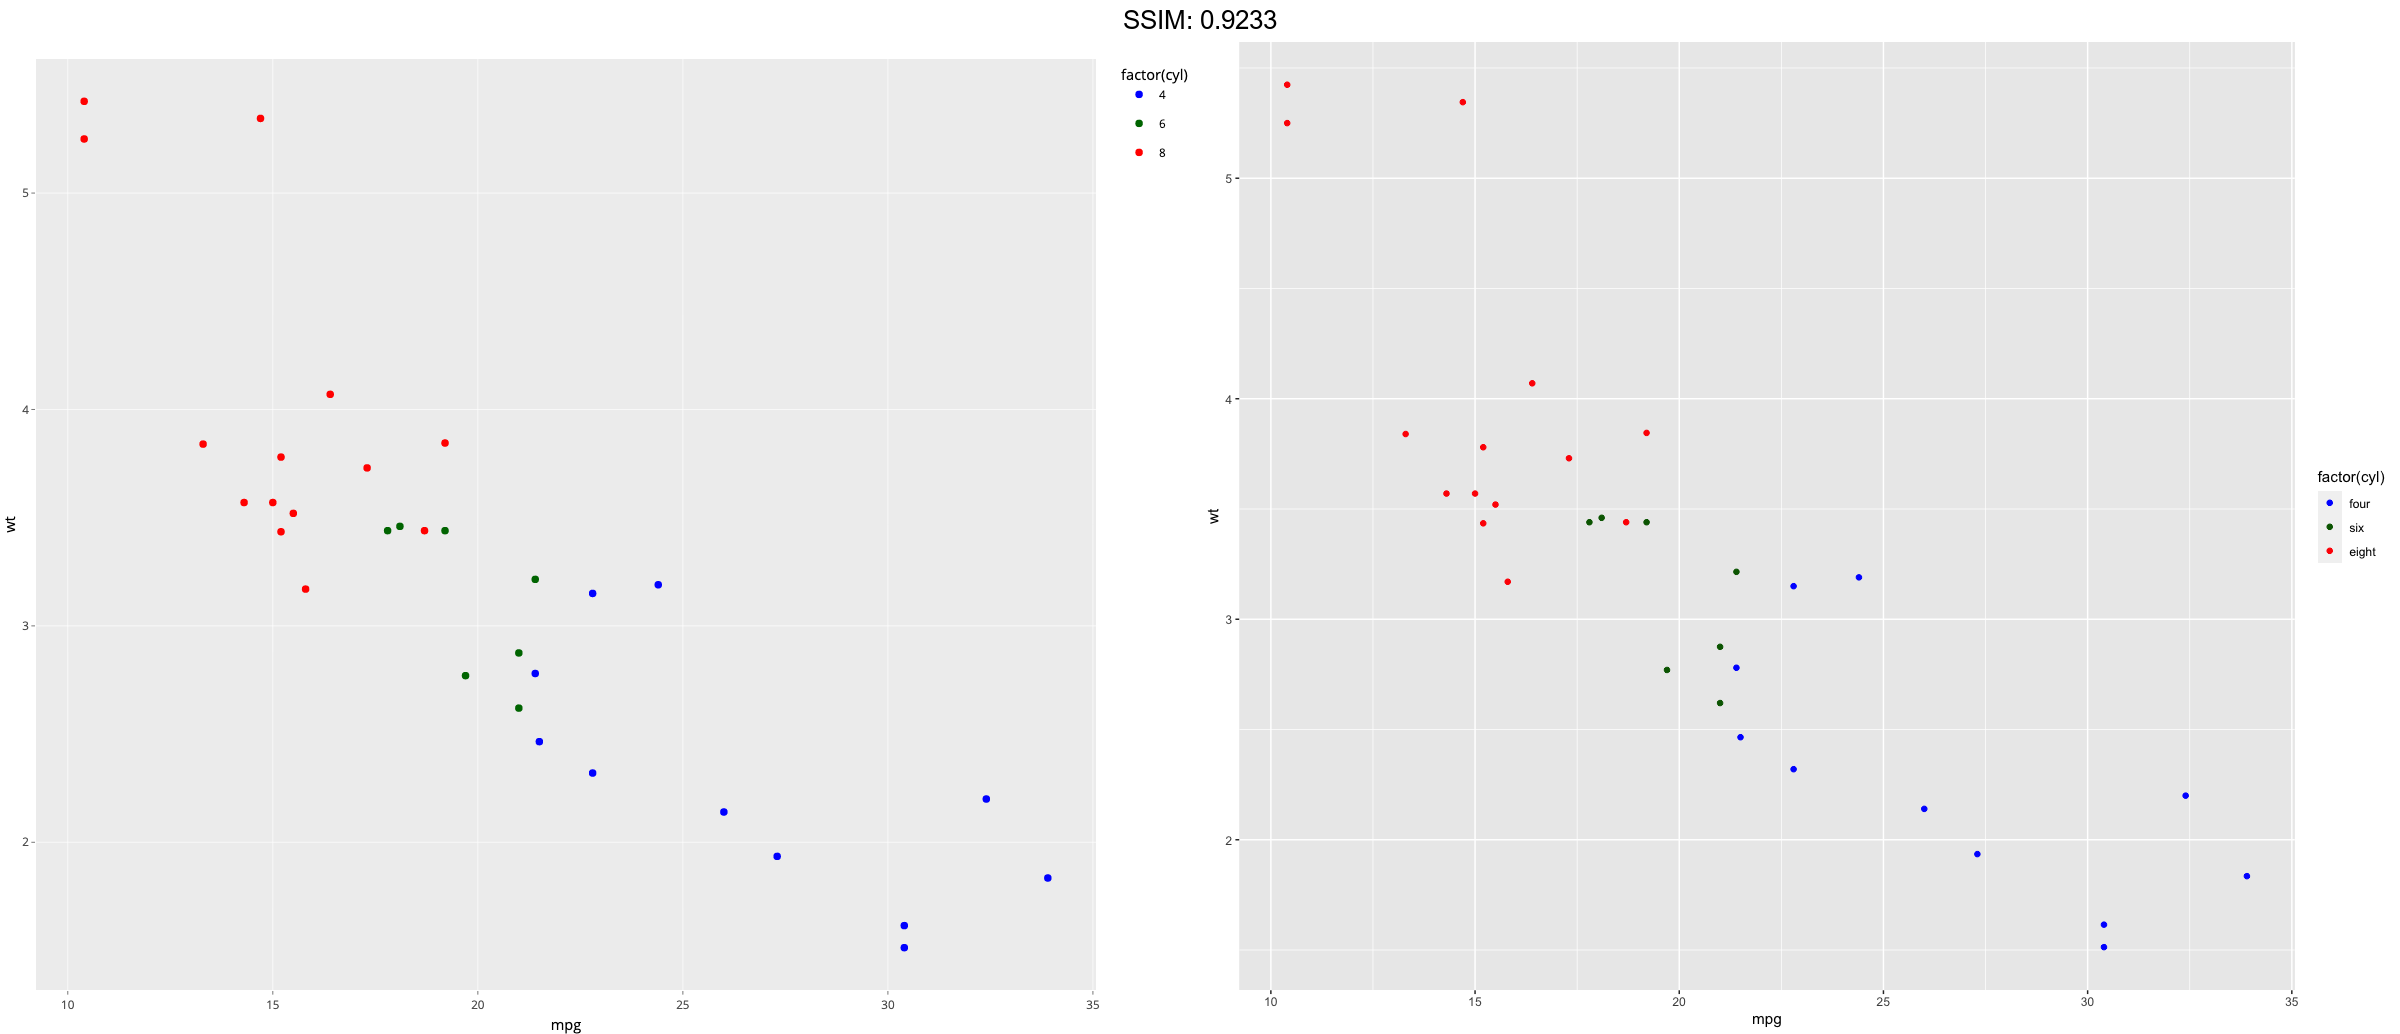
cols <- c("8" = "red", "4" = "blue", "6" = "darkgreen", "10" = "orange")
p <-  p + scale_colour_manual(values = cols, limits = c("4", "8"))
plotly::ggplotly(p)

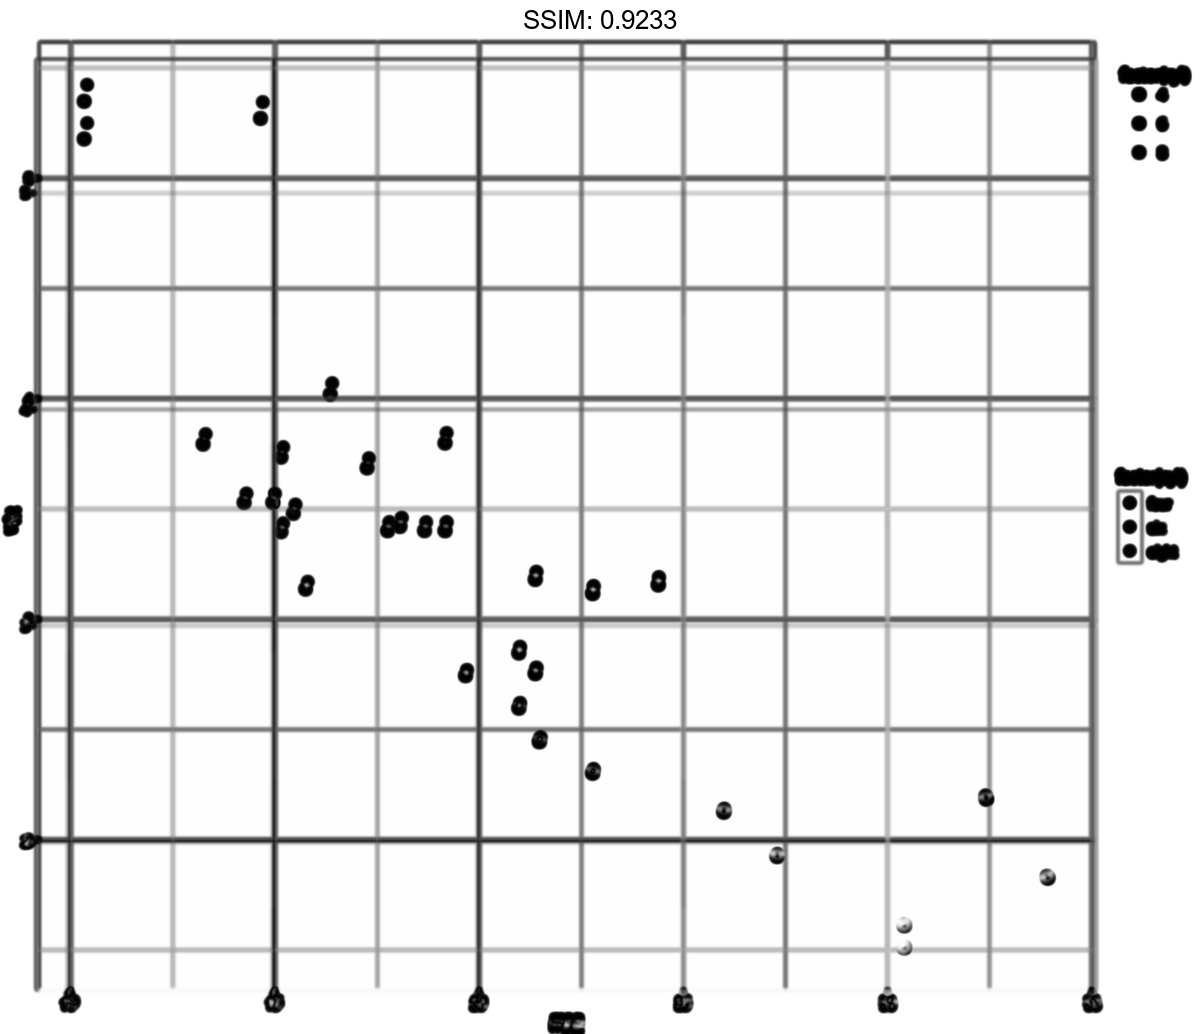
p <- ggplot(mtcars, aes(mpg, wt)) +
  geom_point(aes(colour = factor(cyl)))
cols <- c("8" = "red", "4" = "blue", "6" = "darkgreen", "10" = "orange")
p <-  p + scale_colour_manual(values = cols, limits = c("4", "6", "8", "10"))
plotly::ggplotly(p)

