GGPLOT - scale_linetype
Scale for line patterns and then convert them with ggplotly.
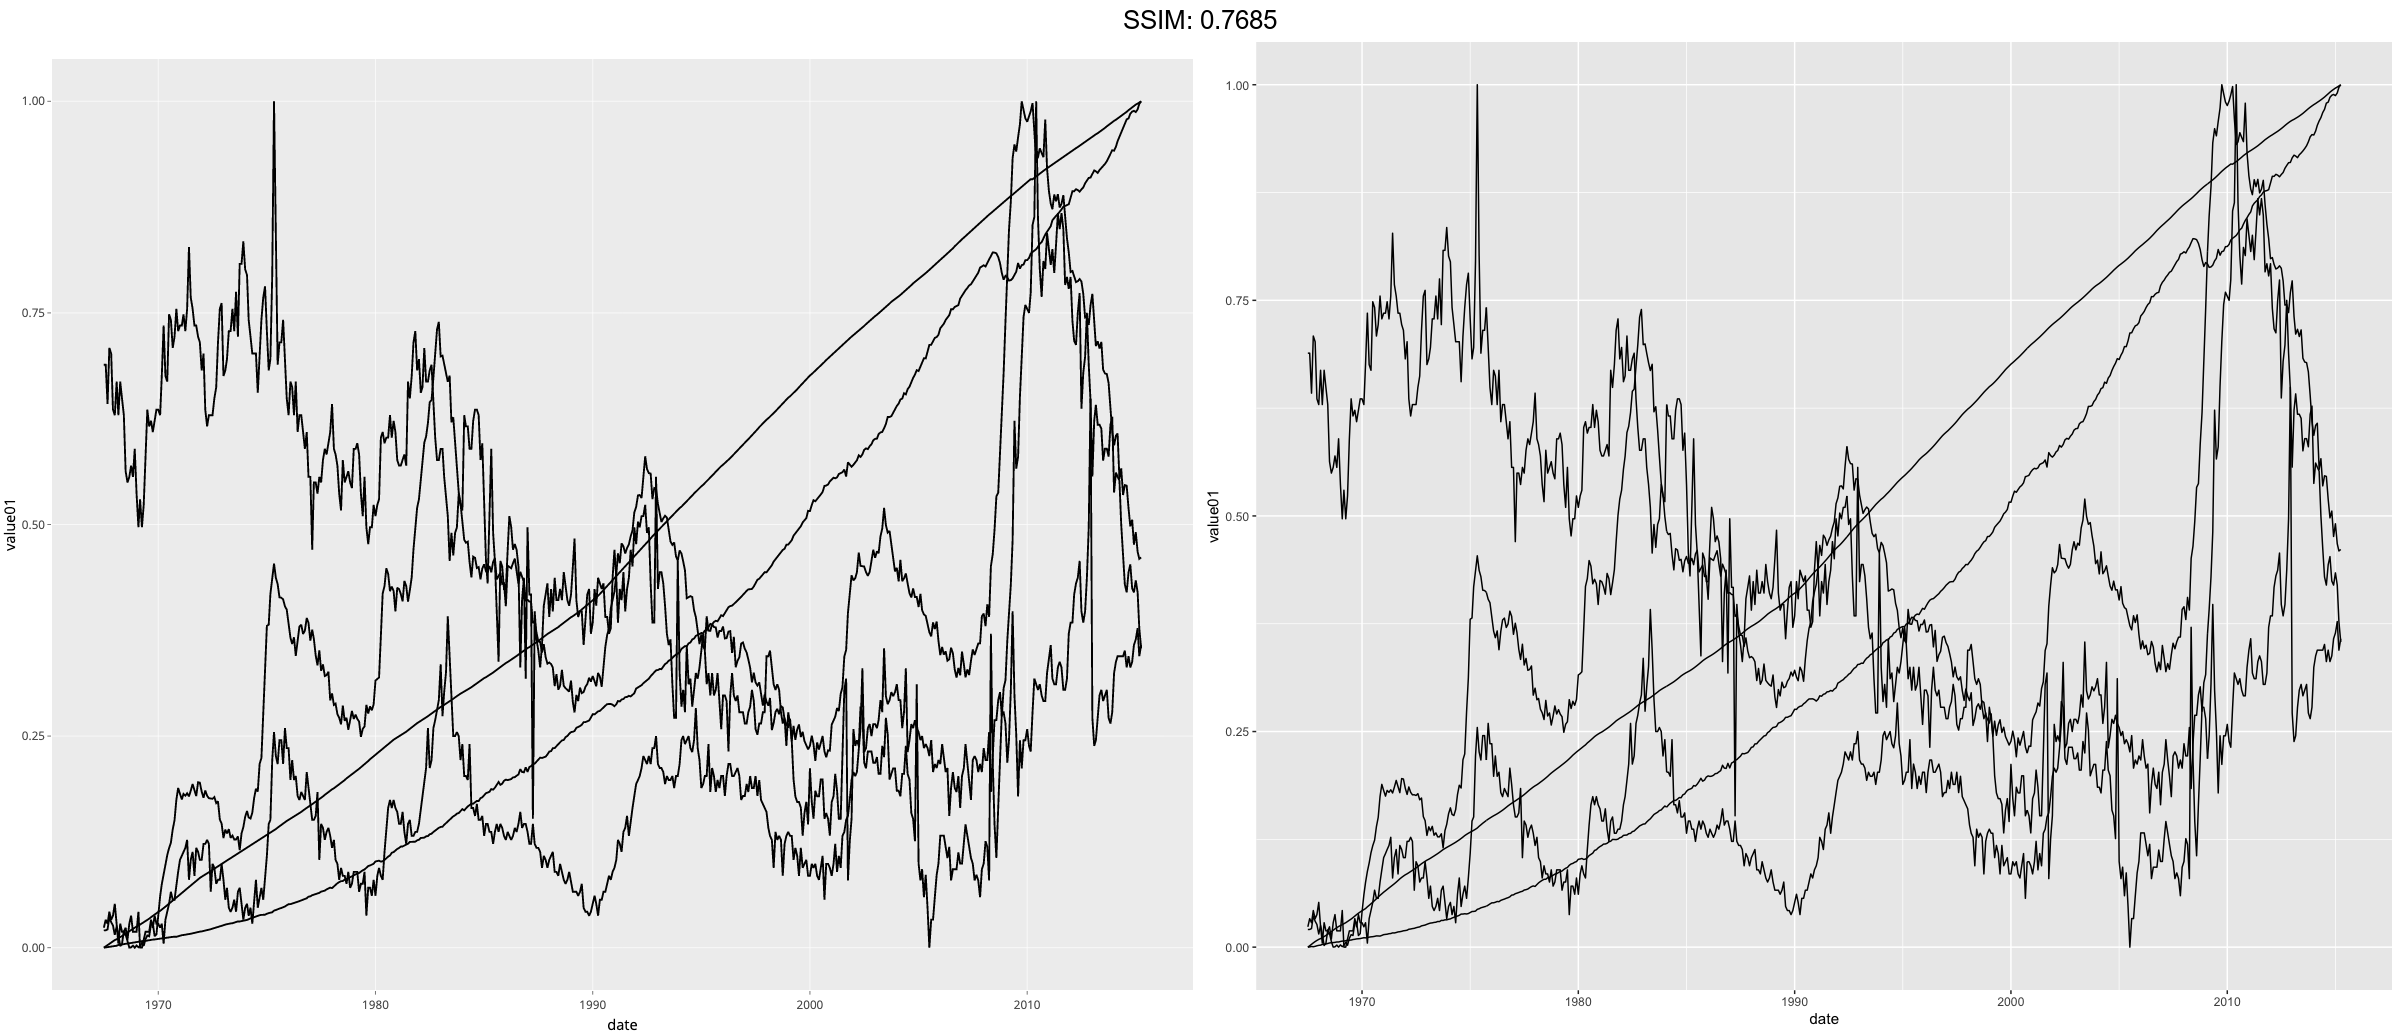
base <- ggplot(economics_long, aes(date, value01))
p <-  base + geom_line(aes(group = variable))
plotly::ggplotly(p)

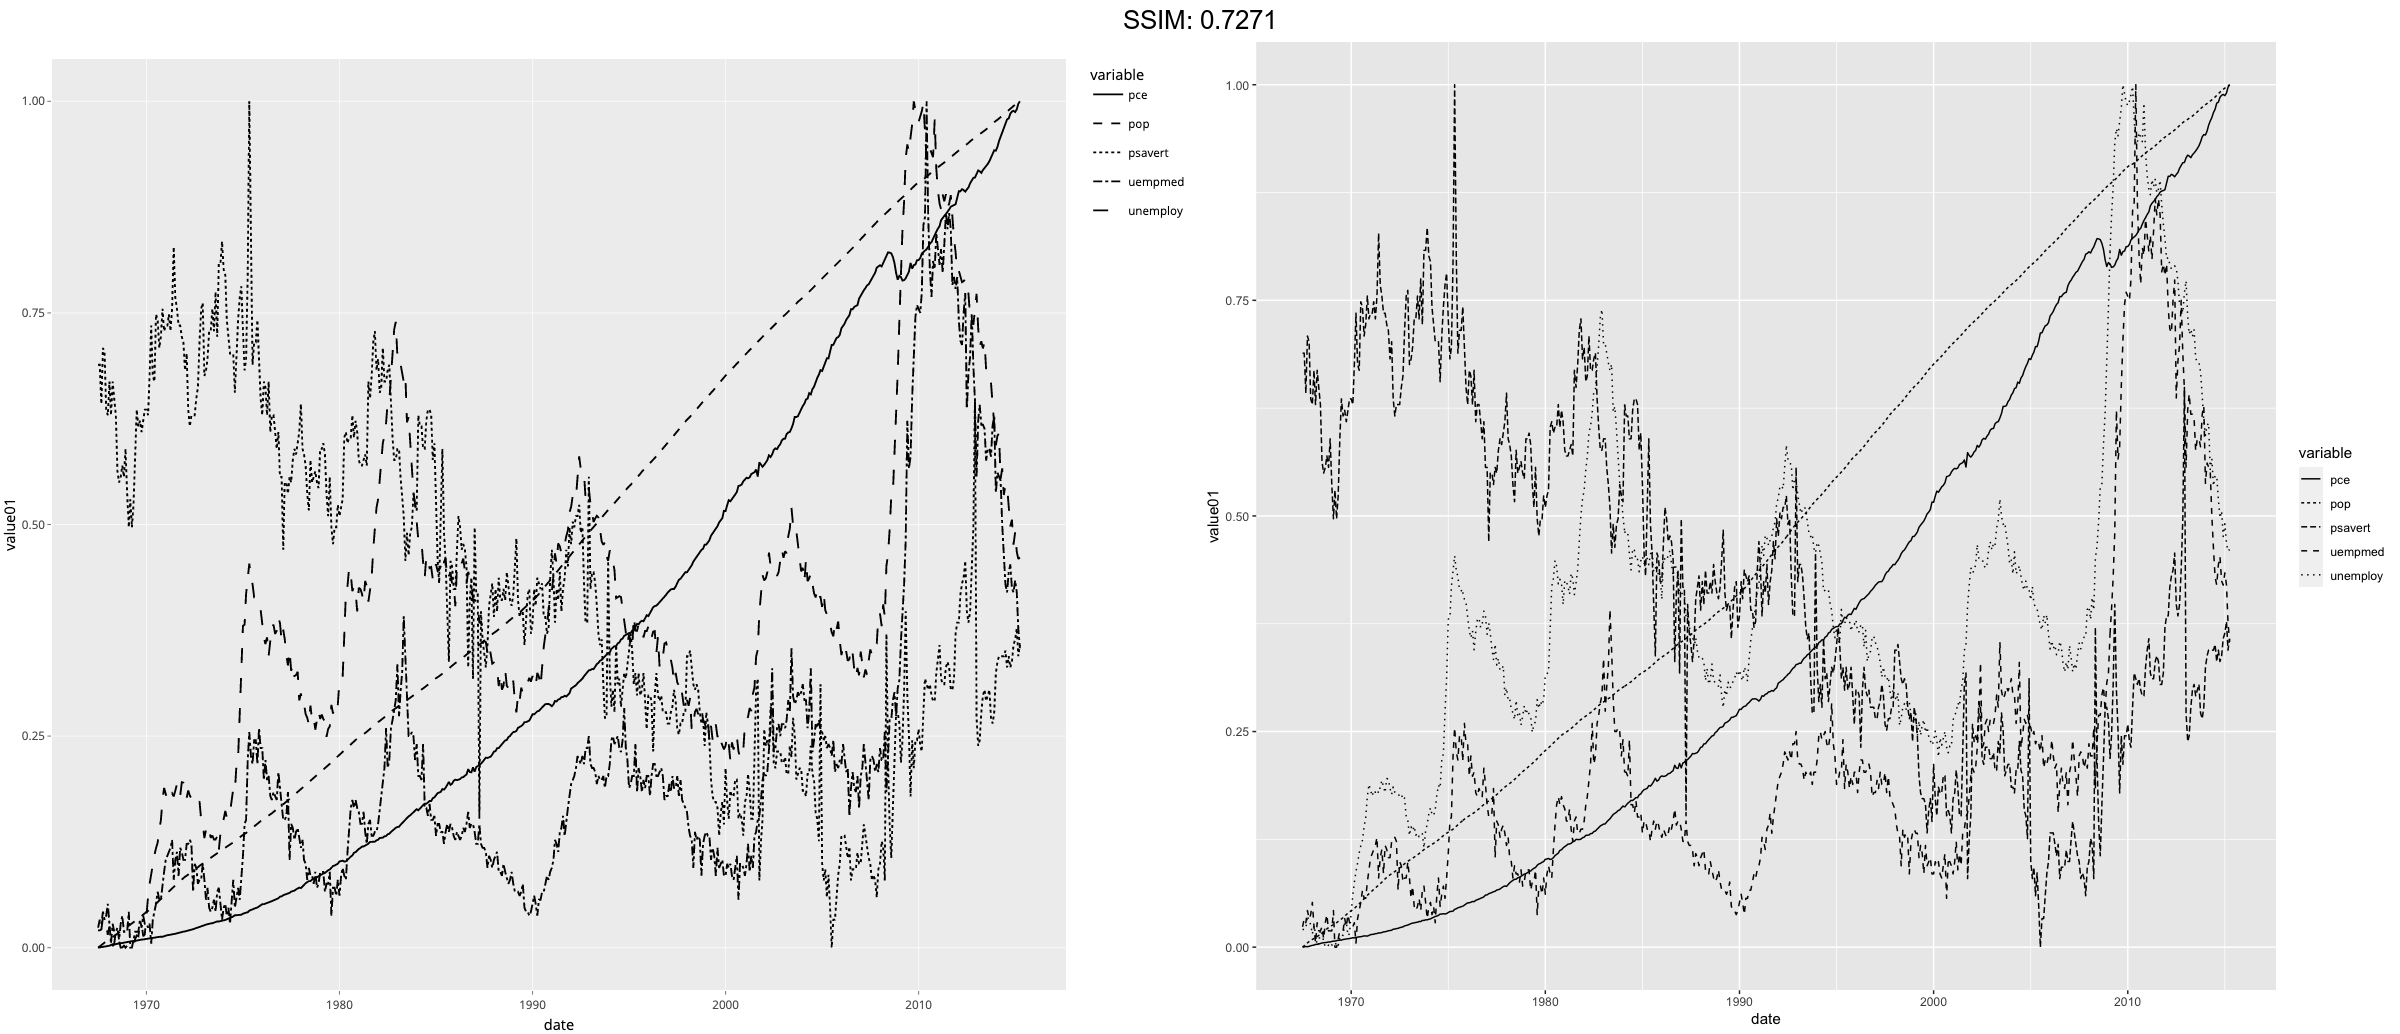
base <- ggplot(economics_long, aes(date, value01))
p <-  base + geom_line(aes(linetype = variable))
plotly::ggplotly(p)
df_lines <- data.frame(
  linetype = factor(
    1:4,
    labels = c("solid", "longdash", "dashed", "dotted")
  )
)
p <-
 ggplot(df_lines) +
  geom_hline(aes(linetype = linetype, yintercept = 0), size = 2) +
  scale_linetype_identity() +
  facet_grid(linetype ~ .) +
  theme_void(20)
plotly::ggplotly(p)