GGPLOT - scale_identity
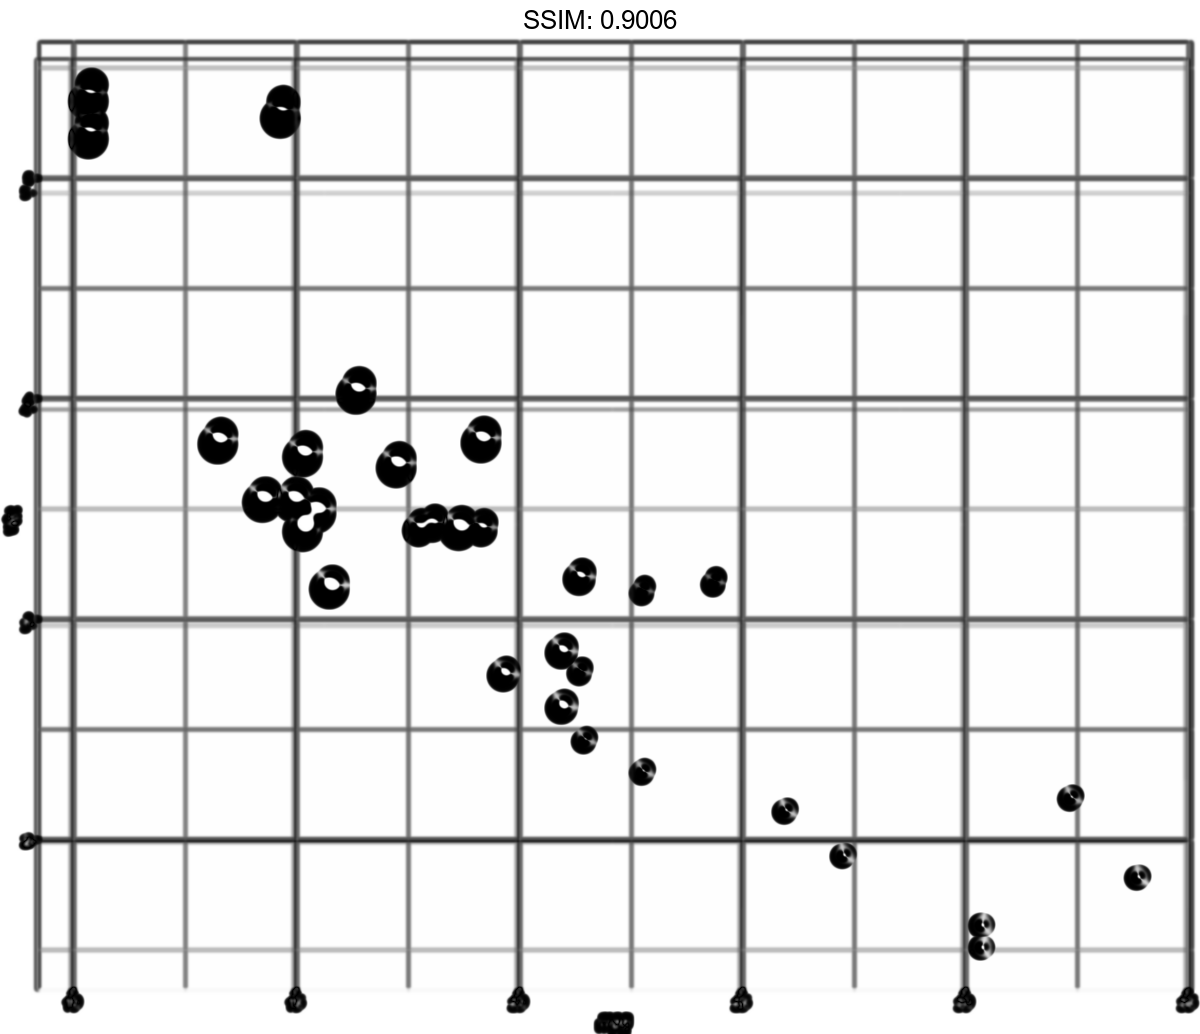
Use values without scaling and then convert them with ggplotly.
p <-
 ggplot(luv_colours, aes(u, v)) +
  geom_point(aes(colour = col), size = 3) +
  scale_color_identity() +
  coord_equal()
plotly::ggplotly(p)


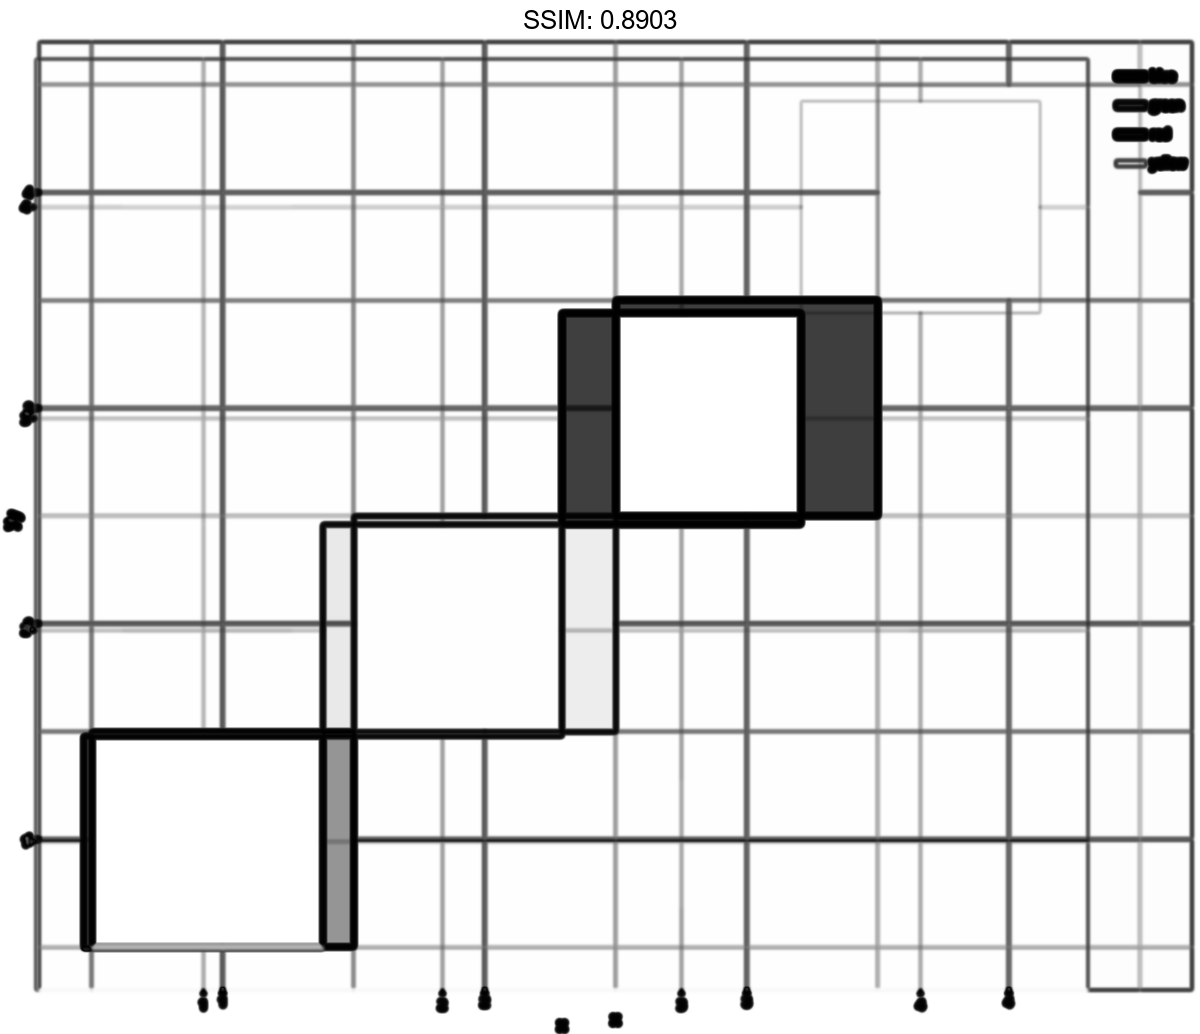
df <- data.frame(
  x = 1:4,
  y = 1:4,
  colour = c("red", "green", "blue", "yellow")
)
p <-
 ggplot(df, aes(x, y)) + geom_tile(aes(fill = colour))
ggplot(df, aes(x, y)) +
  geom_tile(aes(fill = colour)) +
  scale_fill_identity()
plotly::ggplotly(p)


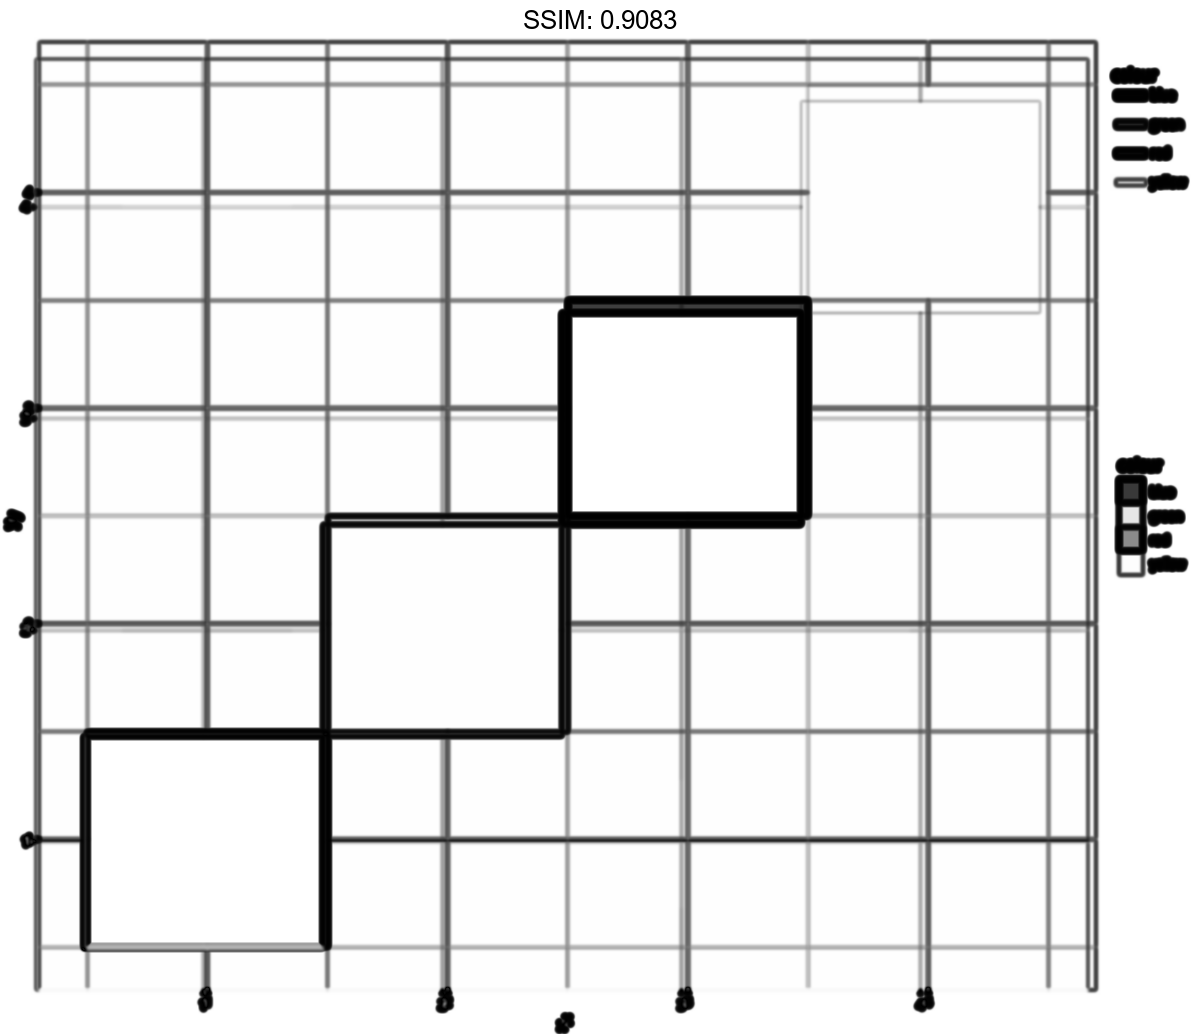
df <- data.frame(
  x = 1:4,
  y = 1:4,
  colour = c("red", "green", "blue", "yellow")
)
p <-
 ggplot(df, aes(x, y)) +
  geom_tile(aes(fill = colour)) +
  scale_fill_identity(guide = "legend")
plotly::ggplotly(p)


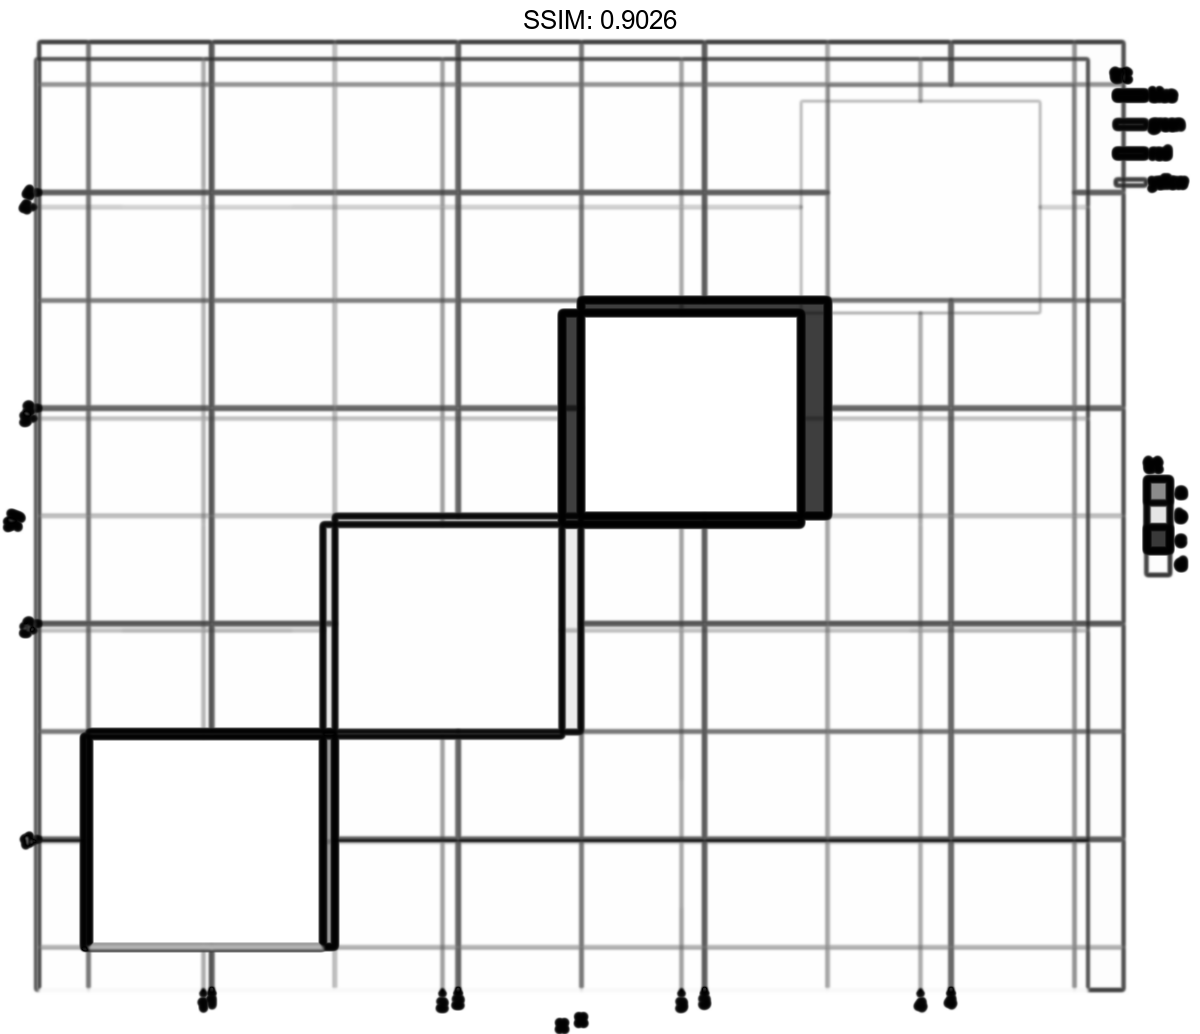
df <- data.frame(
  x = 1:4,
  y = 1:4,
  colour = c("red", "green", "blue", "yellow")
)
p <-
 ggplot(df, aes(x, y)) +
  geom_tile(aes(fill = colour)) +
  scale_fill_identity("trt", labels = letters[1:4], breaks = df$colour,
  guide = "legend")
plotly::ggplotly(p)


p <-
 ggplot(mtcars, aes(mpg, wt)) +
  geom_point(aes(size = cyl))
plotly::ggplotly(p)


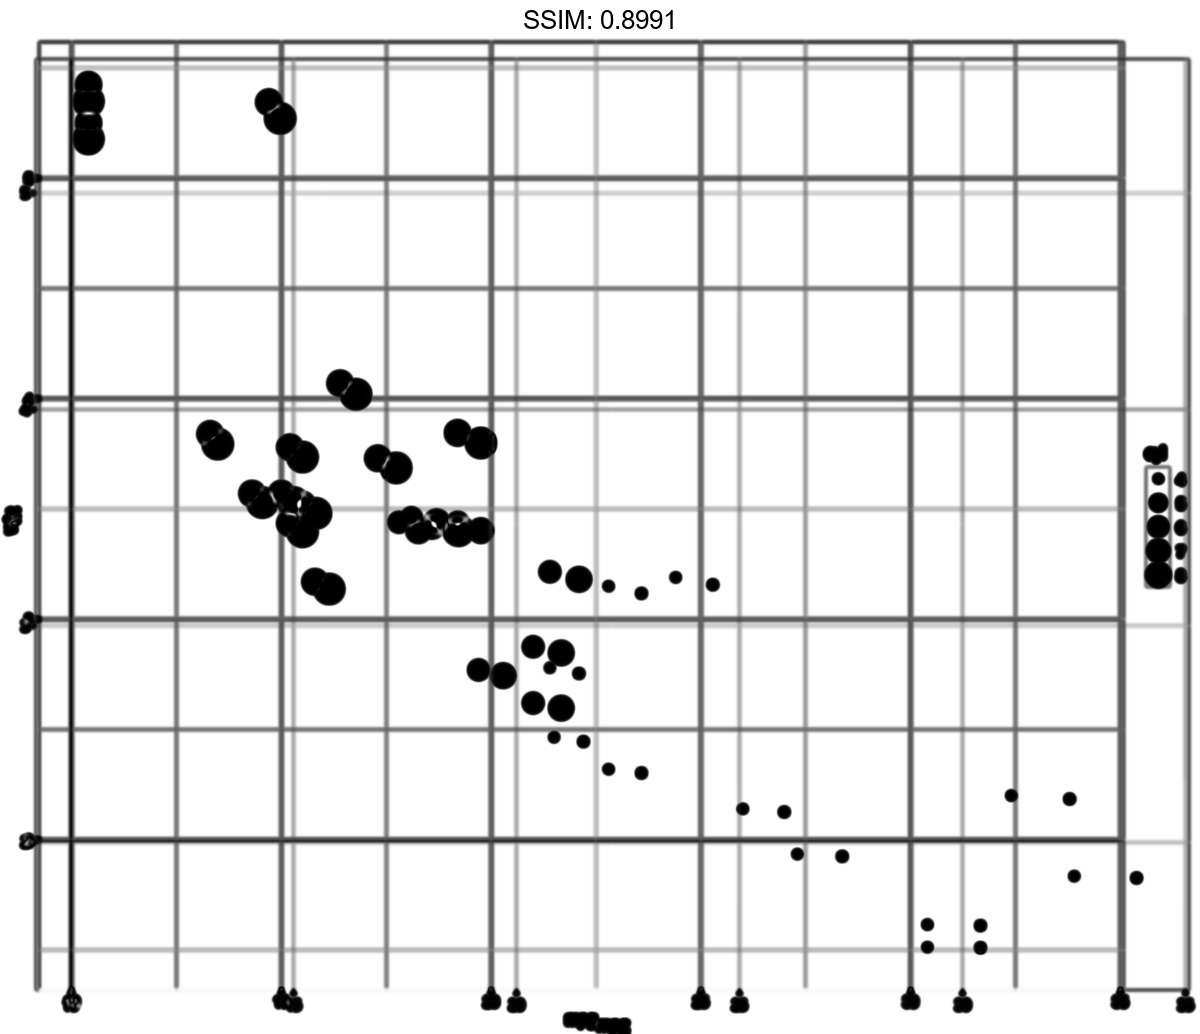
p <-
 ggplot(mtcars, aes(mpg, wt)) +
  geom_point(aes(size = cyl)) +
  scale_size_identity()
plotly::ggplotly(p)


