GGPLOT - scale_discrete
Position scales for discrete data and then convert them with ggplotly.
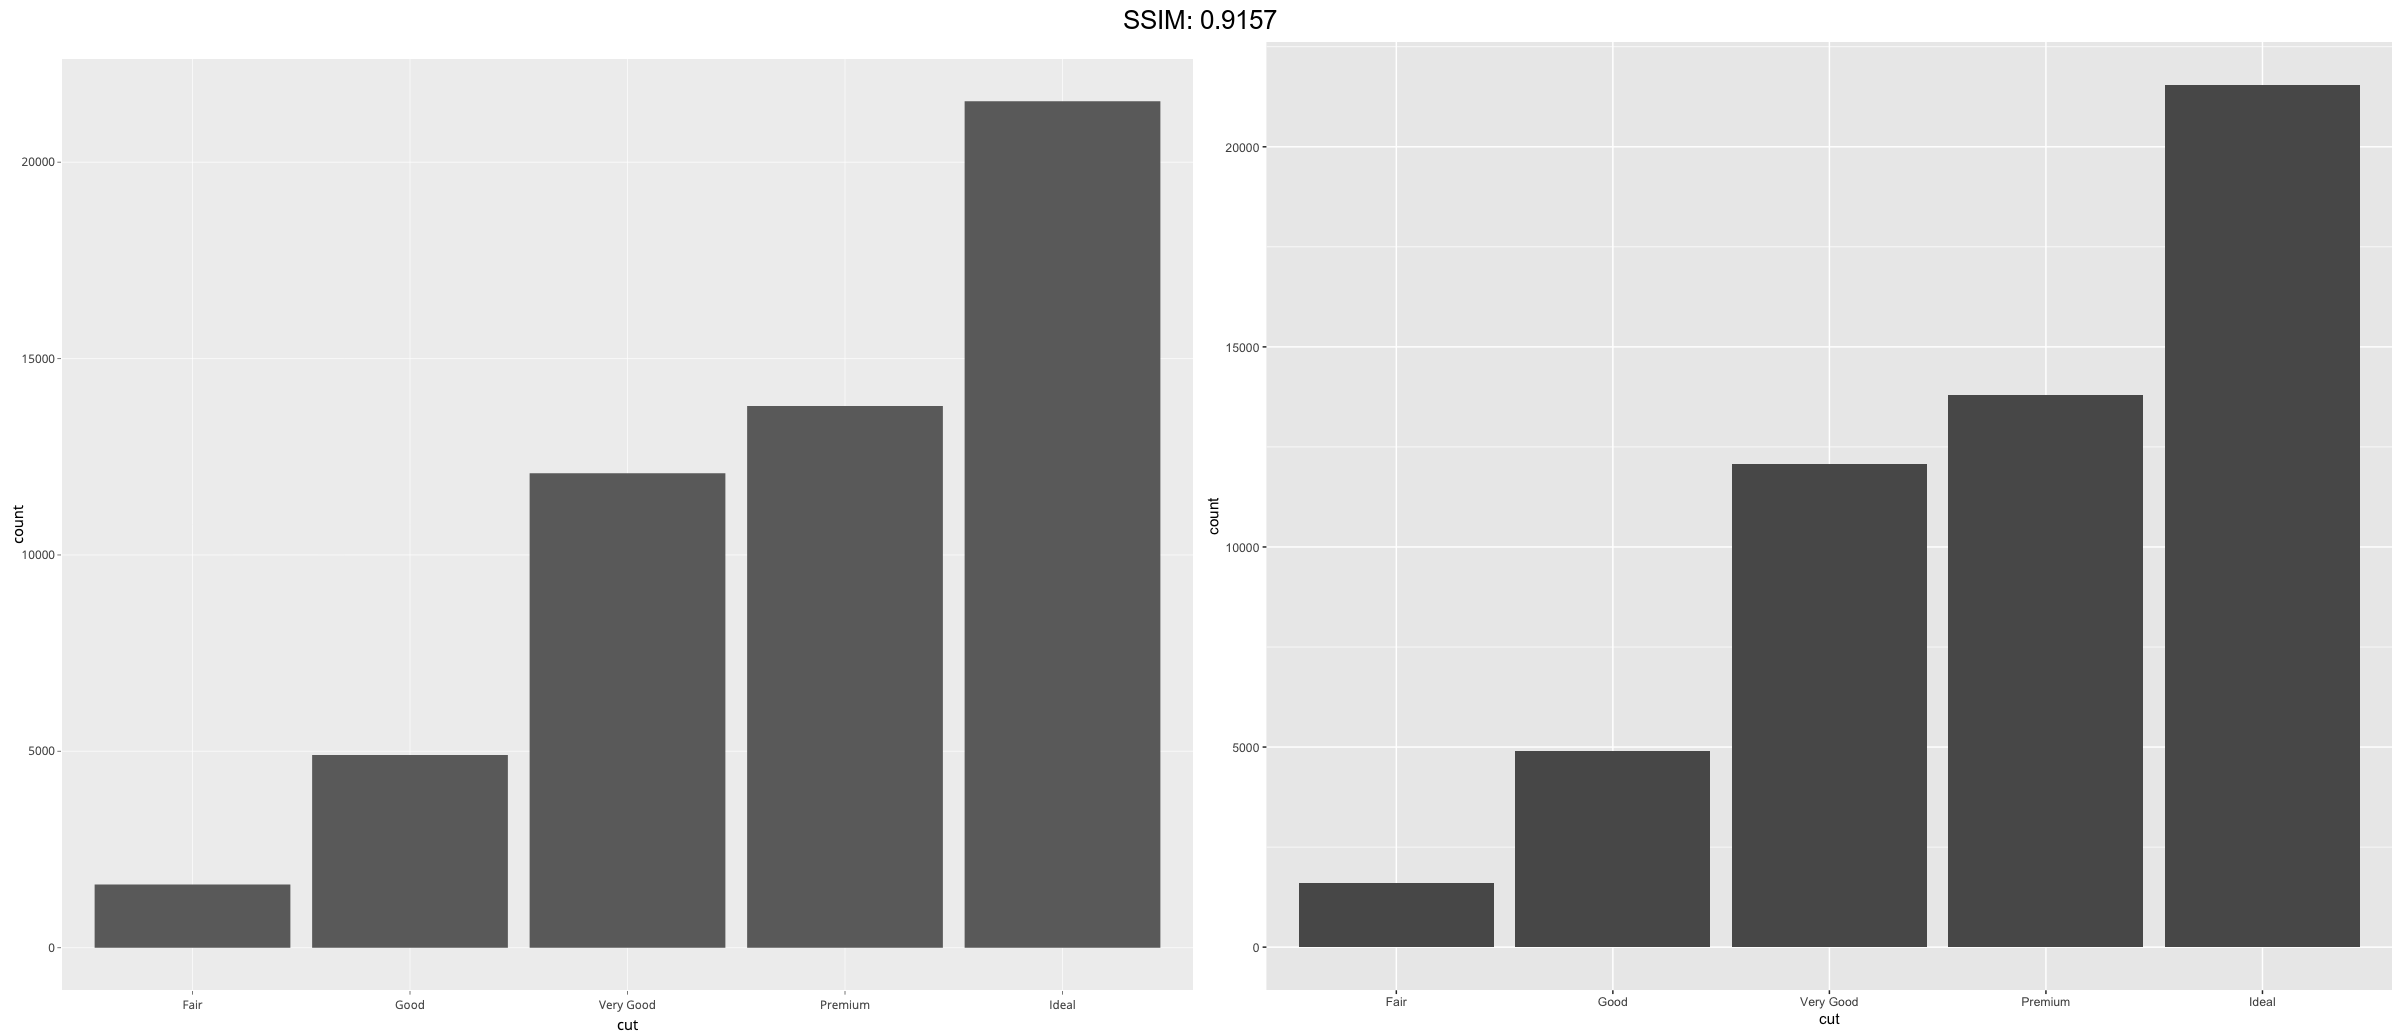
ggplot(diamonds, aes(cut)) + geom_bar()
plotly::ggplotly(p)


(d <- ggplot(subset(diamonds, carat > 1), aes(cut, clarity)) +
      geom_jitter())
plotly::ggplotly(d)


(d <- ggplot(subset(diamonds, carat > 1), aes(cut, clarity)) +
      geom_jitter())
p <-  d + scale_x_discrete("Cut")
plotly::ggplotly(p)

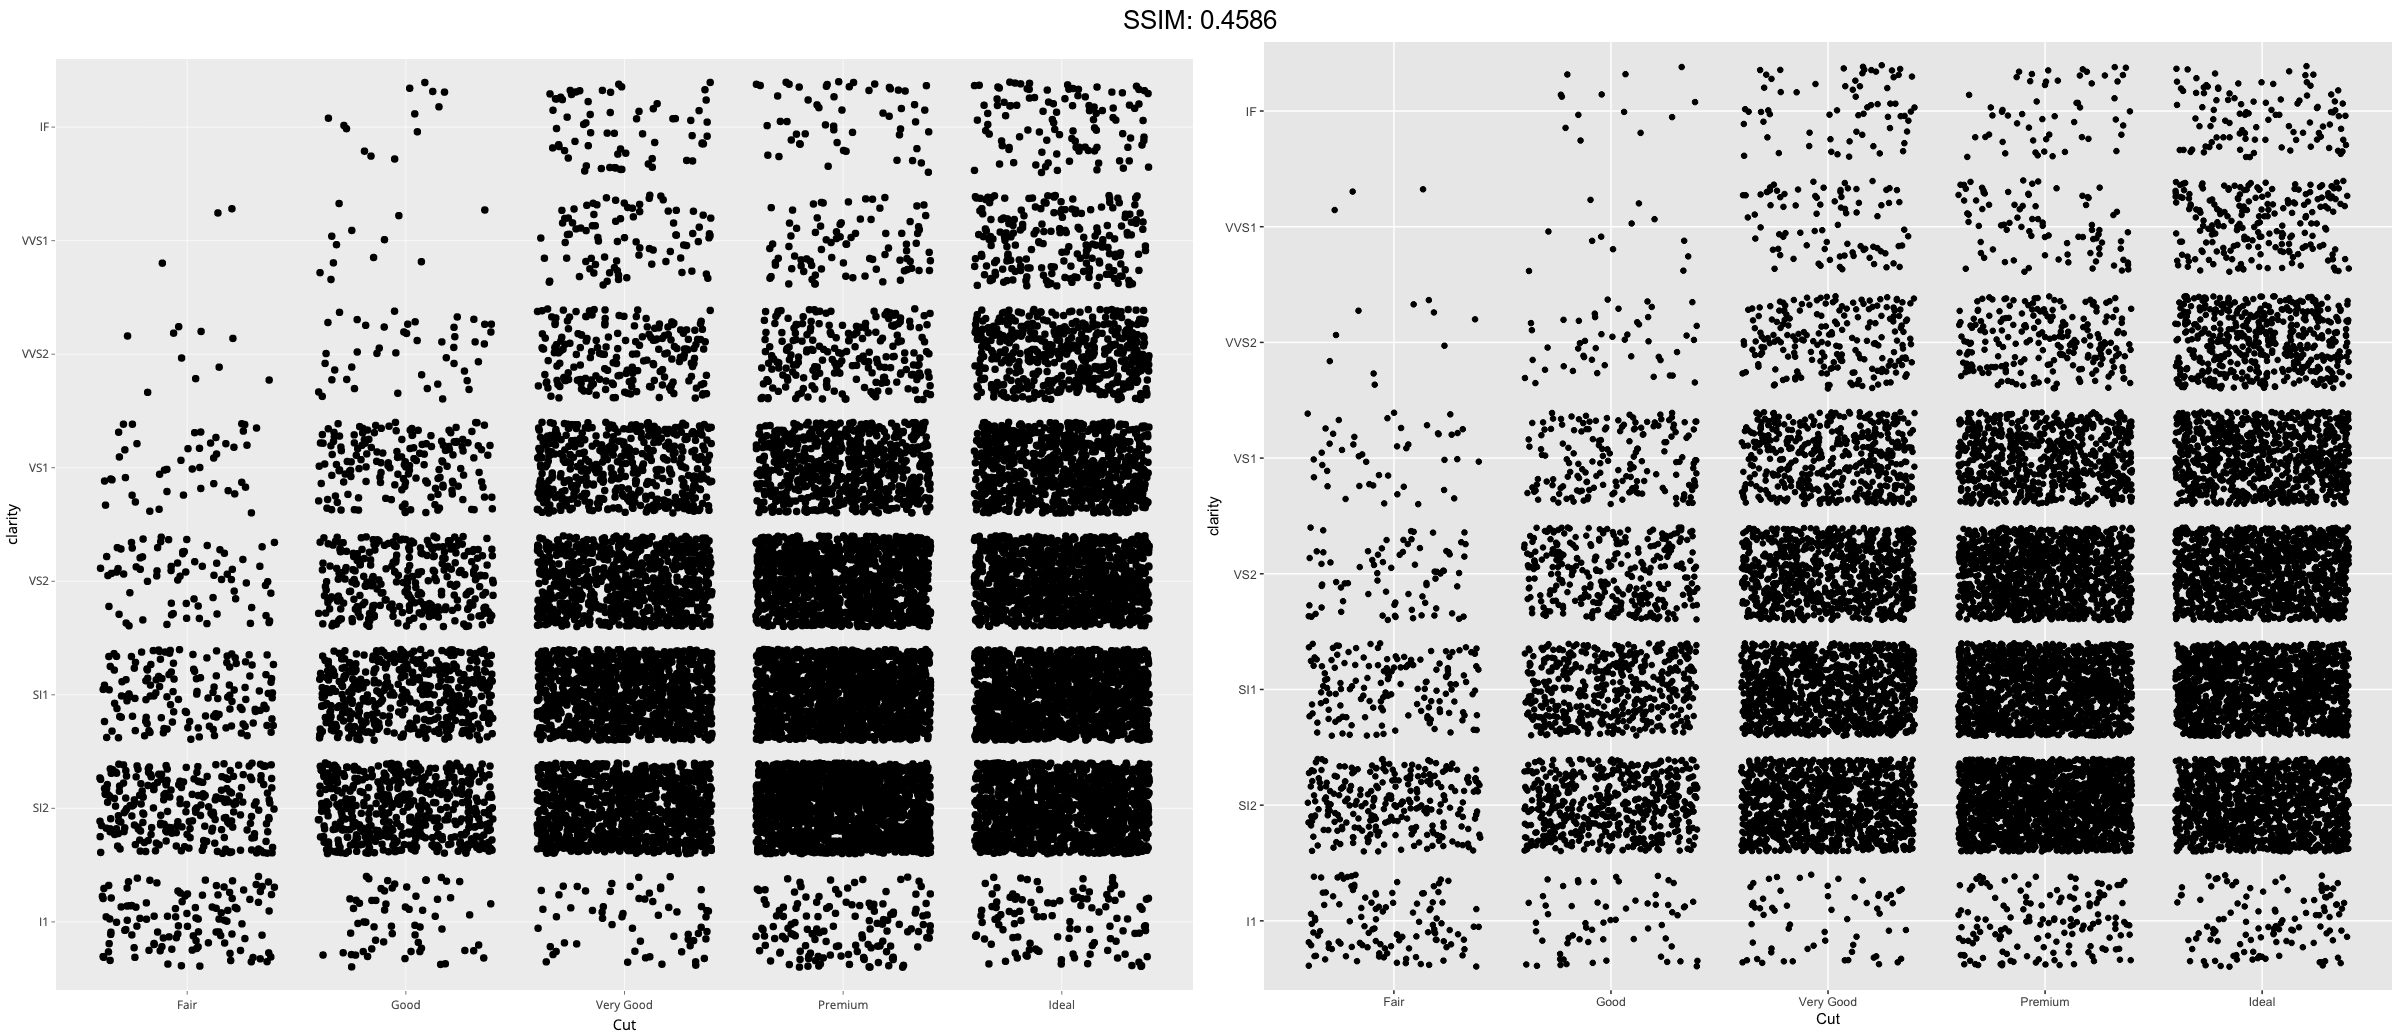

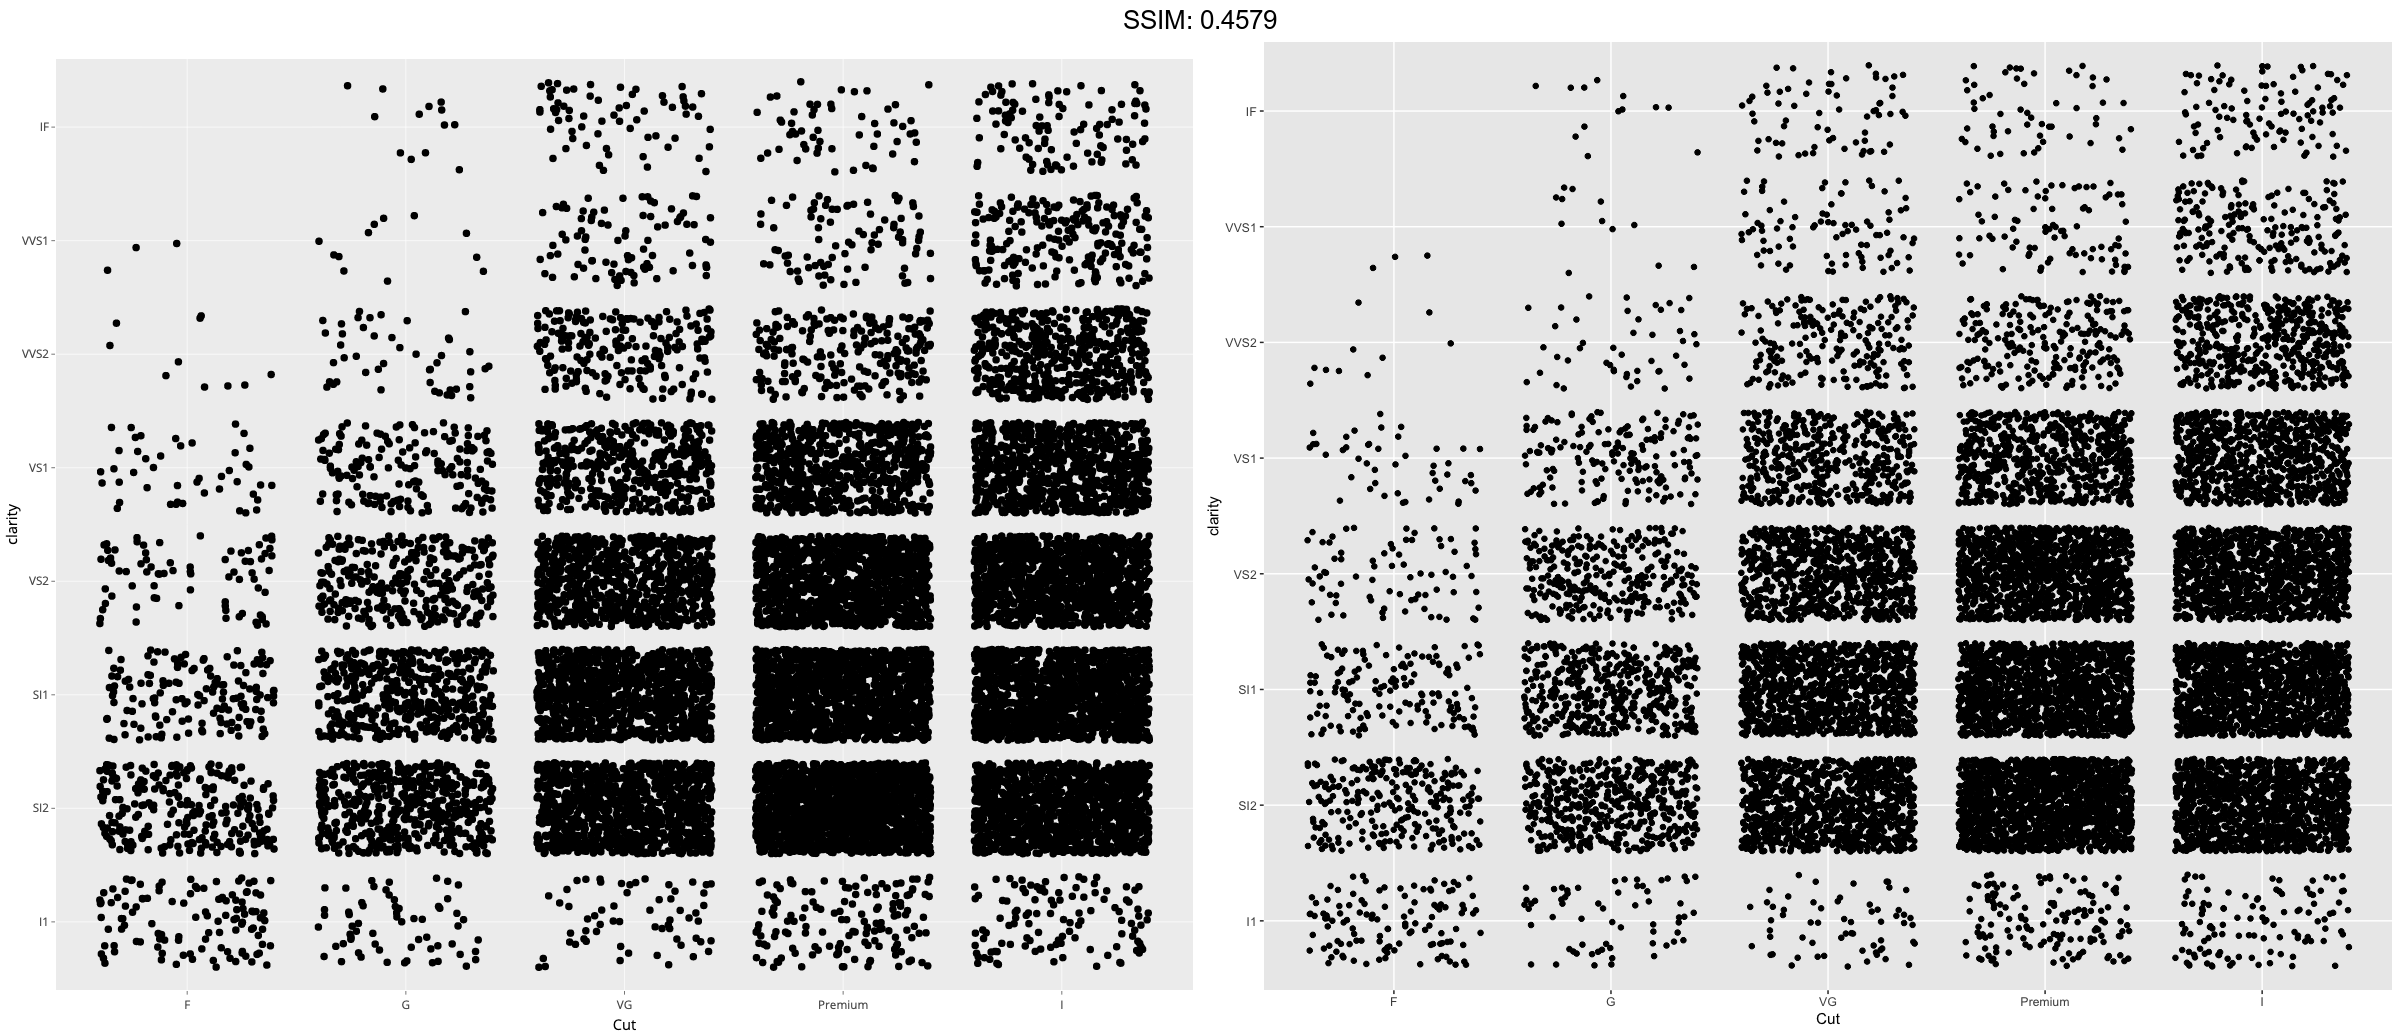
(d <- ggplot(subset(diamonds, carat > 1), aes(cut, clarity)) +
      geom_jitter())
p <-
 d +
  scale_x_discrete(
    "Cut",
    labels = c(
      "Fair" = "F",
      "Good" = "G",
      "Very Good" = "VG",
      "Perfect" = "P",
      "Ideal" = "I"
    )
  )
plotly::ggplotly(p)


(d <- ggplot(subset(diamonds, carat > 1), aes(cut, clarity)) +
      geom_jitter())
p <-  d + scale_x_discrete(limits = c("Fair","Ideal"))
plotly::ggplotly(p)


(d <- ggplot(subset(diamonds, carat > 1), aes(cut, clarity)) +
      geom_jitter())
p <-  d + xlim("Fair","Ideal", "Good")
plotly::ggplotly(p)


(d <- ggplot(subset(diamonds, carat > 1), aes(cut, clarity)) +
      geom_jitter())
p <-  d + ylim("I1", "IF")
plotly::ggplotly(p)


p <-
 ggplot(mpg, aes(manufacturer, cty)) +
  geom_point()
plotly::ggplotly(p)


p <-
 ggplot(mpg, aes(reorder(manufacturer, cty), cty)) +
  geom_point()
plotly::ggplotly(p)

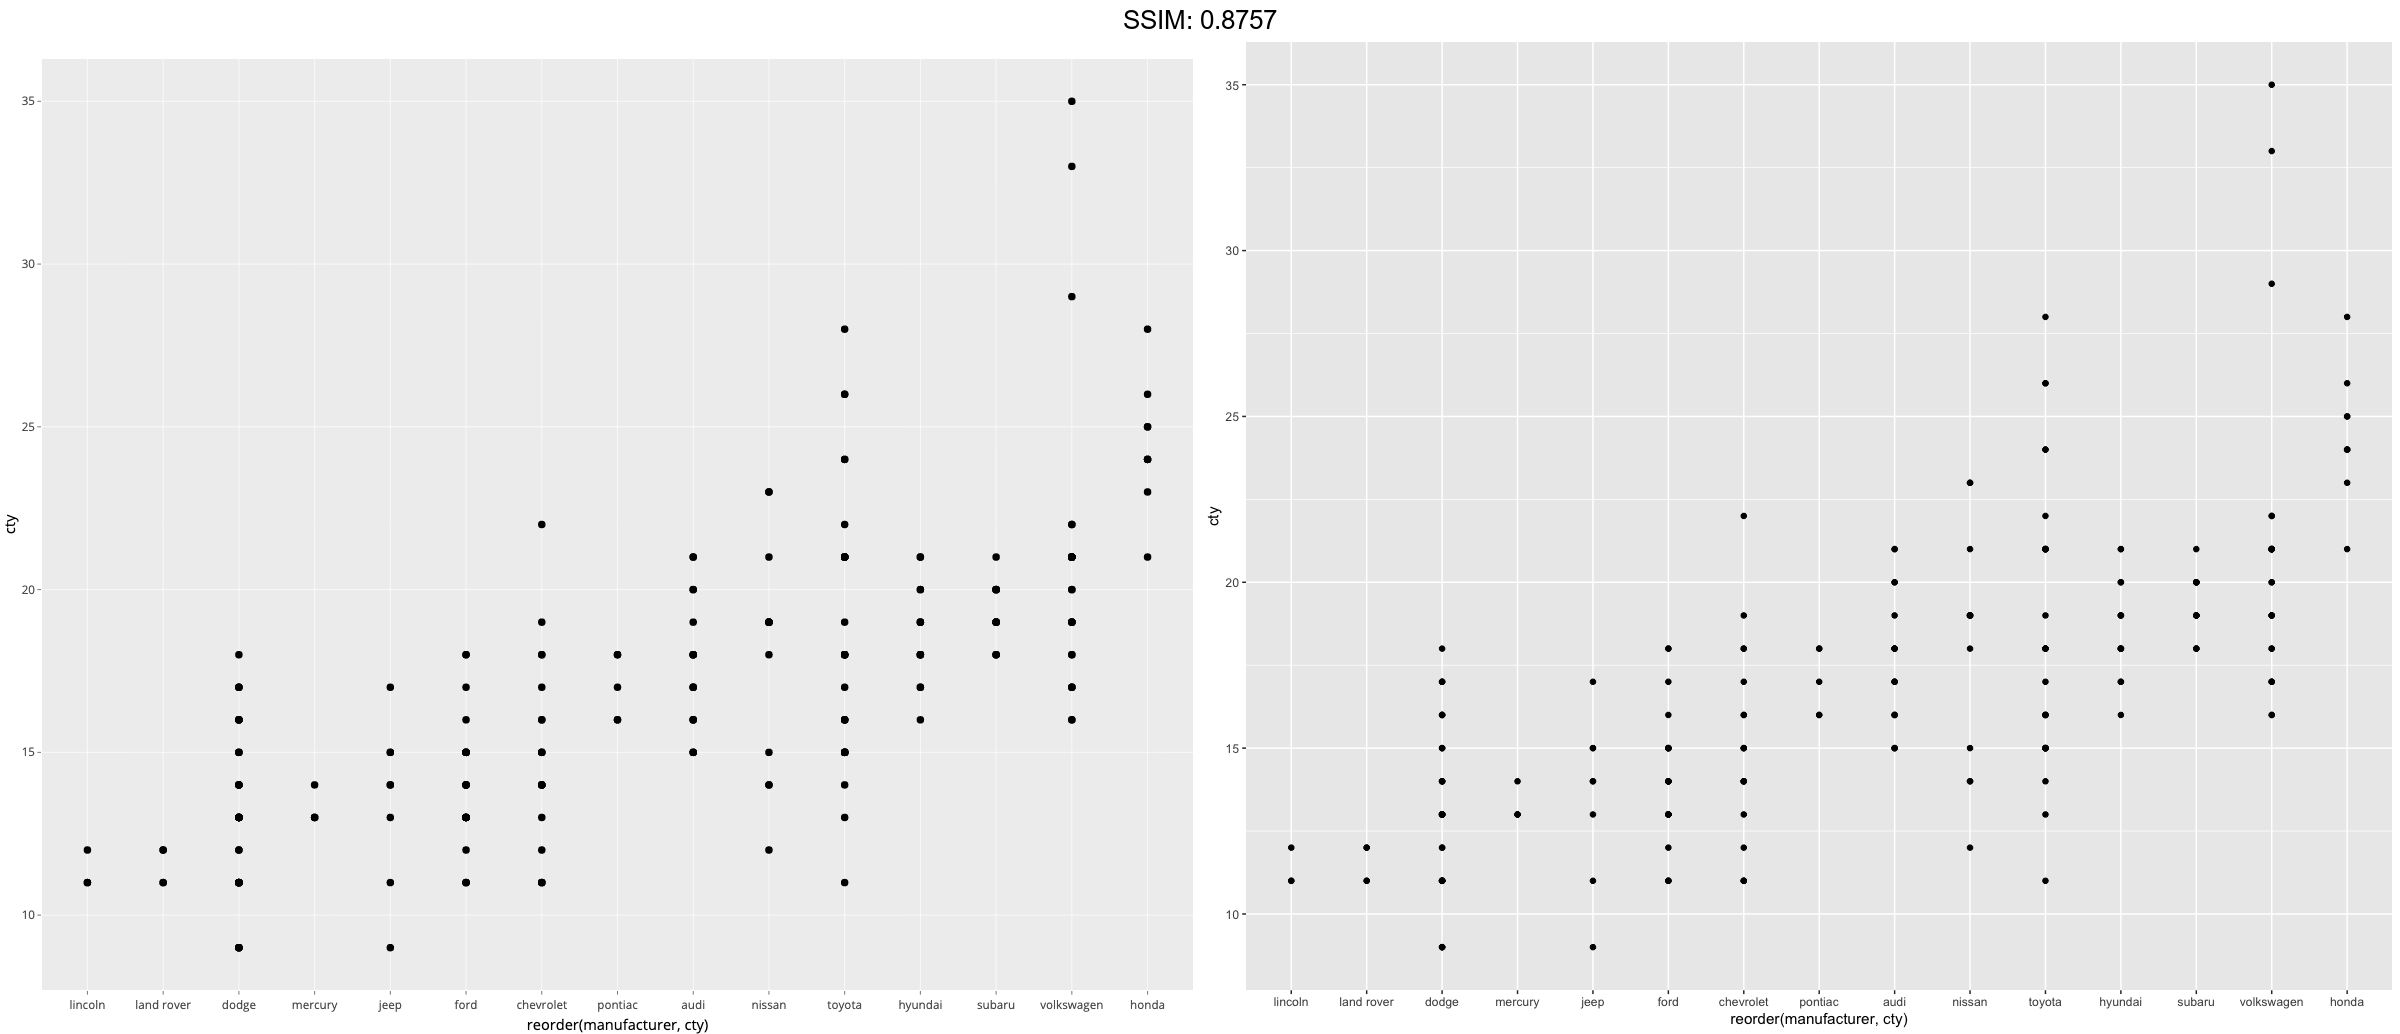

p <-
 ggplot(mpg, aes(reorder(manufacturer, displ), cty)) +
  geom_point()
plotly::ggplotly(p)


p <-
 ggplot(mpg, aes(reorder(manufacturer, displ), cty)) +
  geom_point() +
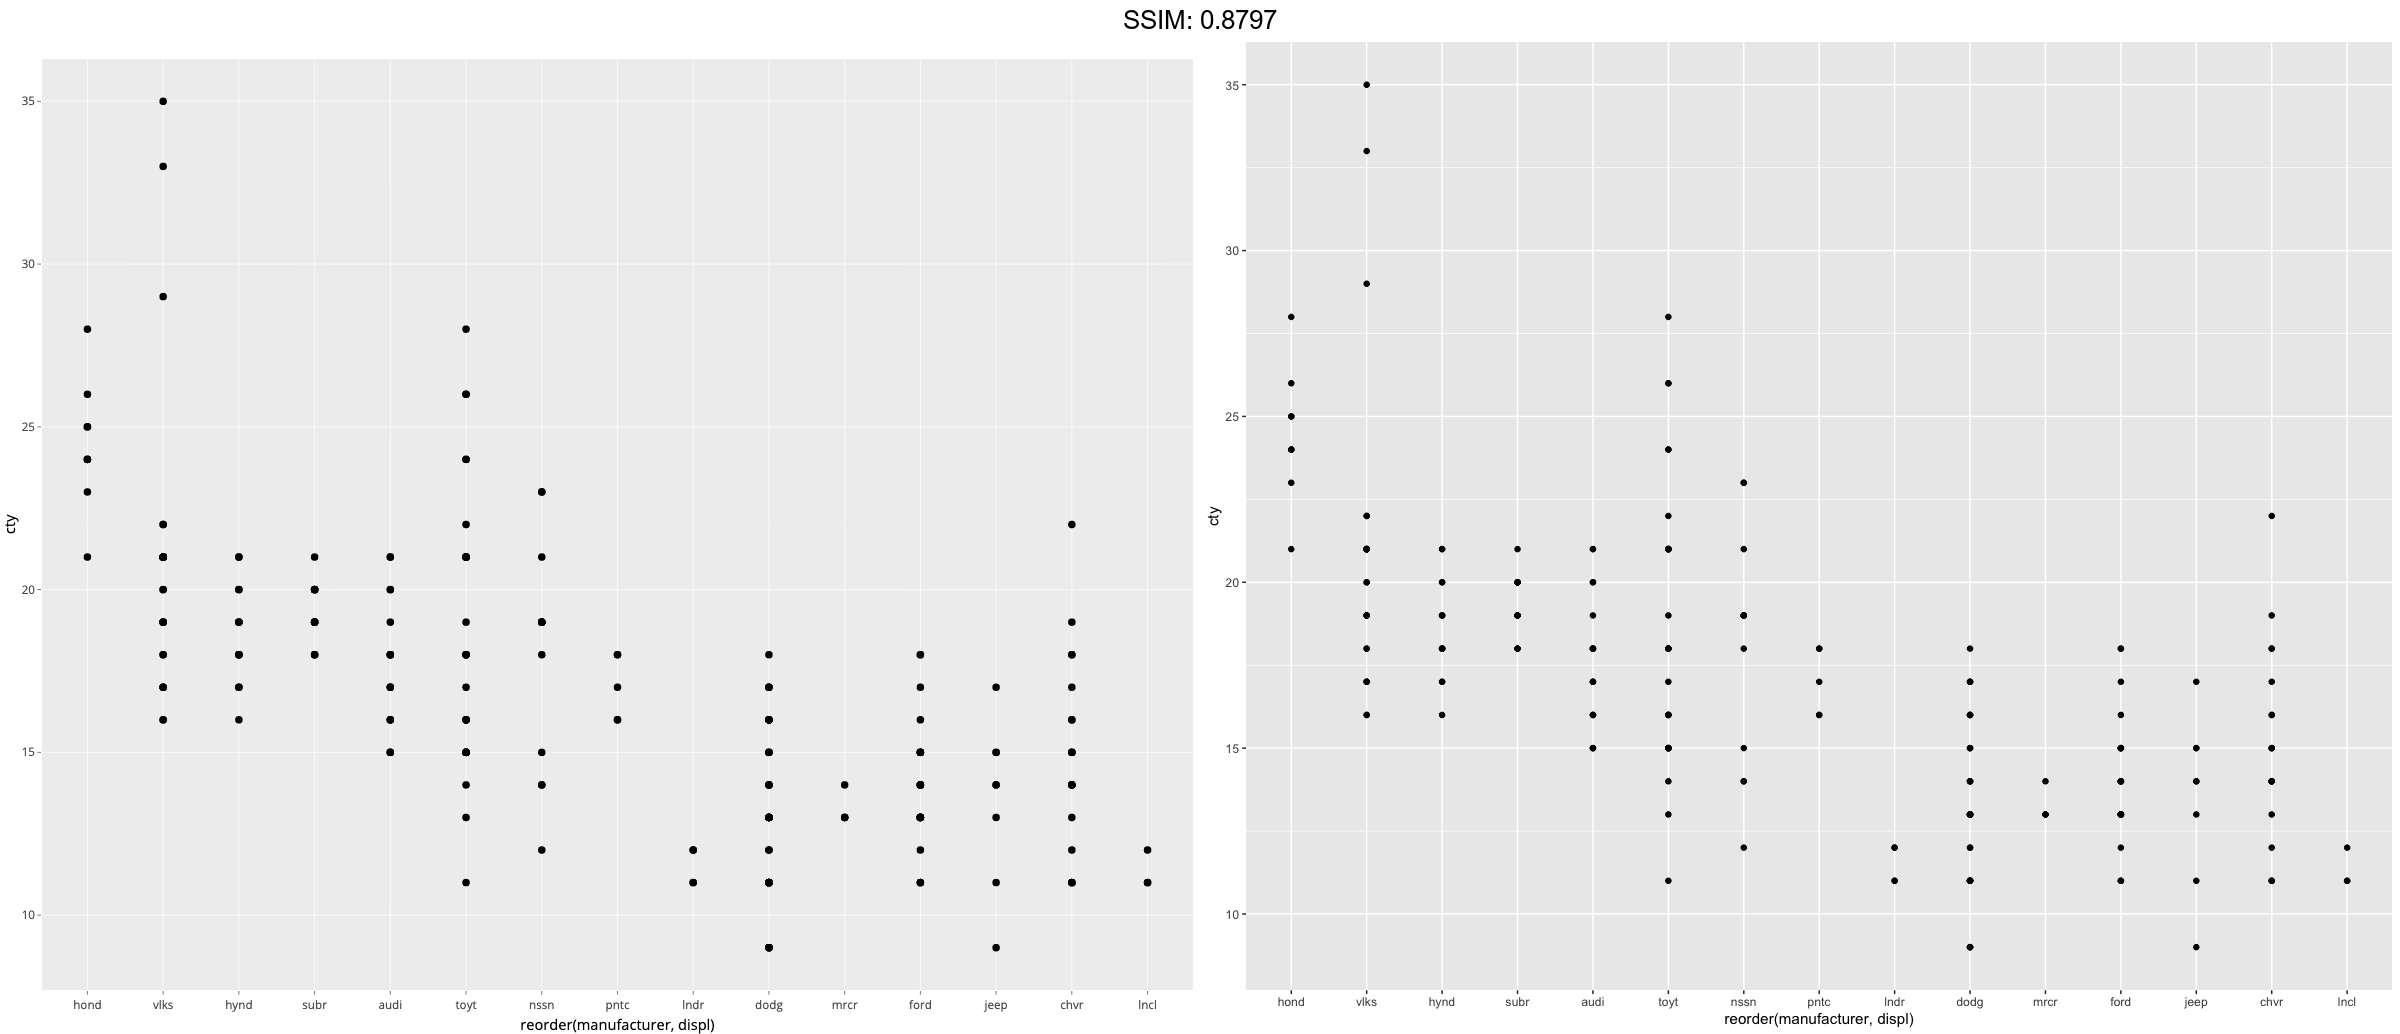
  scale_x_discrete(labels = abbreviate)
plotly::ggplotly(p)

