GGPLOT - scale_date
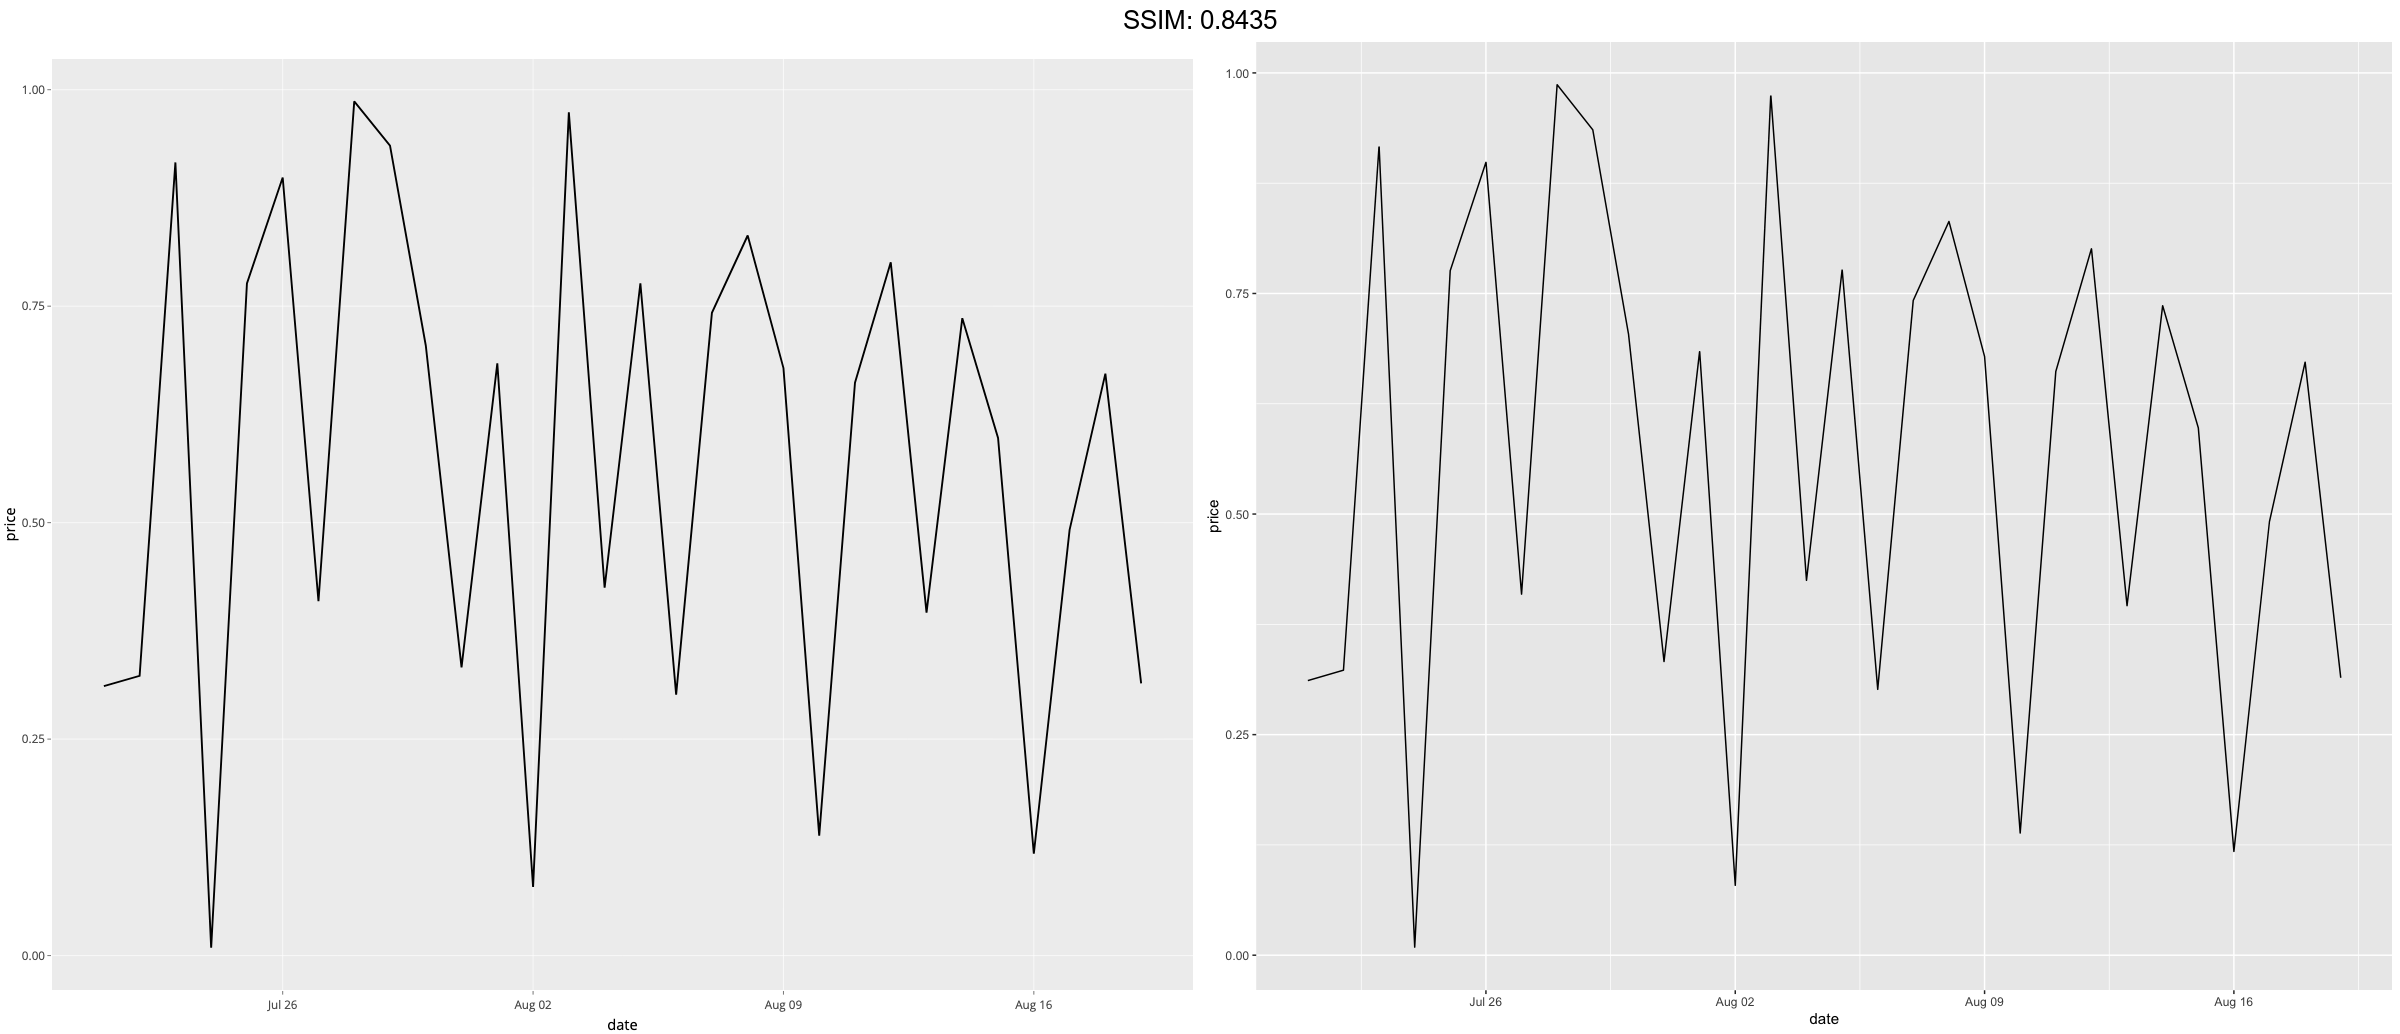
Creates default scales for the three date/time class and then convert them with ggplotly.
last_month <- Sys.Date() - 0:29
df <- data.frame(
  date = last_month,
  price = runif(30)
)
base <- ggplot(df, aes(date, price)) +
  geom_line()
p <-  base + scale_x_date(date_labels = "%b %d")
plotly::ggplotly(p)


last_month <- Sys.Date() - 0:29
df <- data.frame(
  date = last_month,
  price = runif(30)
)
base <- ggplot(df, aes(date, price)) +
  geom_line()
p <-  base + scale_x_date(date_breaks = "1 week", date_labels = "%W")
plotly::ggplotly(p)


last_month <- Sys.Date() - 0:29
df <- data.frame(
  date = last_month,
  price = runif(30)
)
base <- ggplot(df, aes(date, price)) +
  geom_line()
p <-  base + scale_x_date(date_minor_breaks = "1 day")
plotly::ggplotly(p)


last_month <- Sys.Date() - 0:29
df <- data.frame(
  date = last_month,
  price = runif(30)
)
base <- ggplot(df, aes(date, price)) +
  geom_line()
p <-  base + scale_x_date(limits = c(Sys.Date() - 7, NA))
plotly::ggplotly(p)


