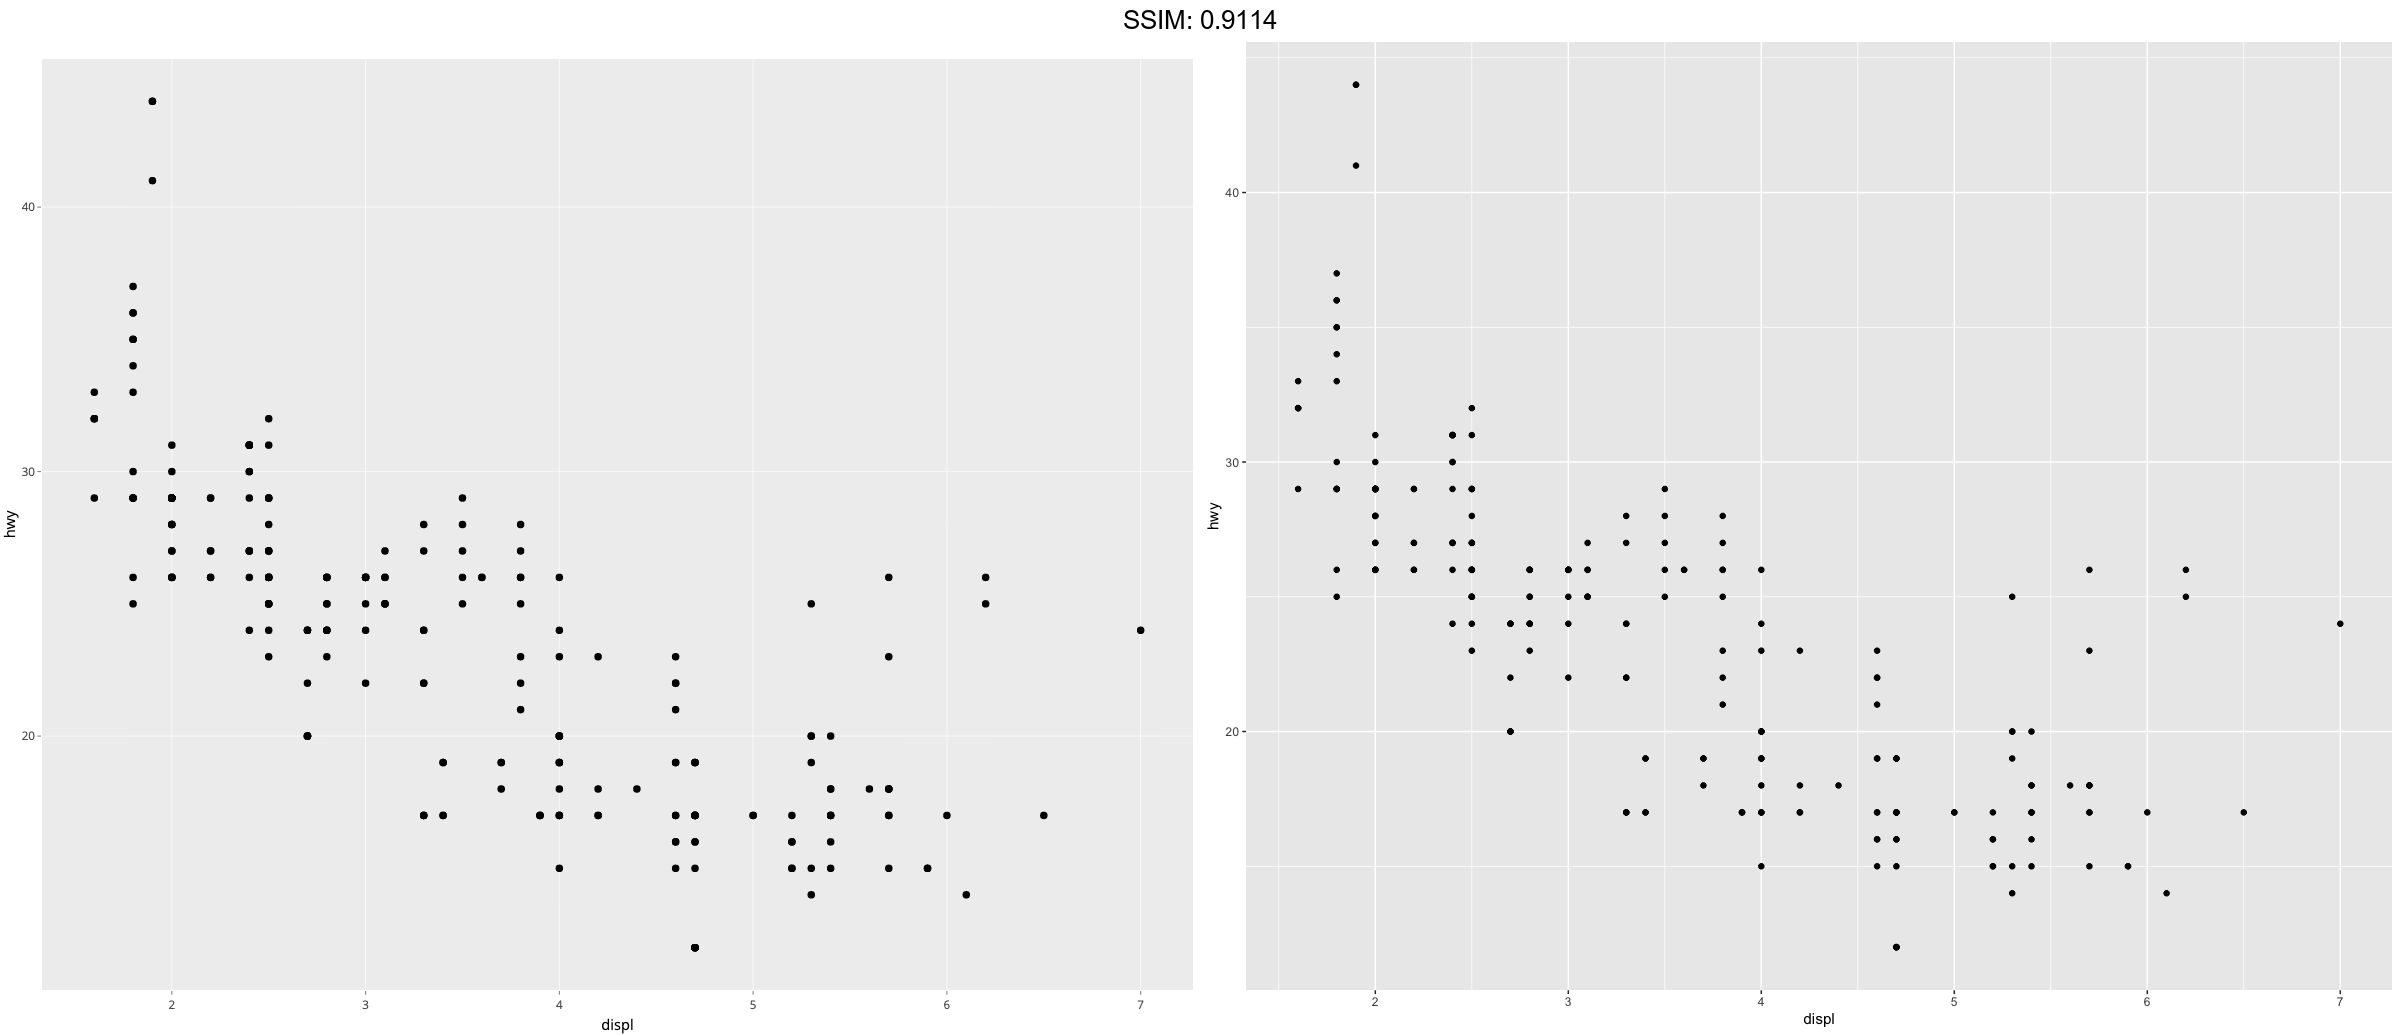
GGPLOT - scale_continuous
Position scales for continuous data (x & y) and then convert them with ggplotly.
p1 <- ggplot(mpg, aes(displ, hwy)) +
  geom_point()
plotly::ggplotly(p1)


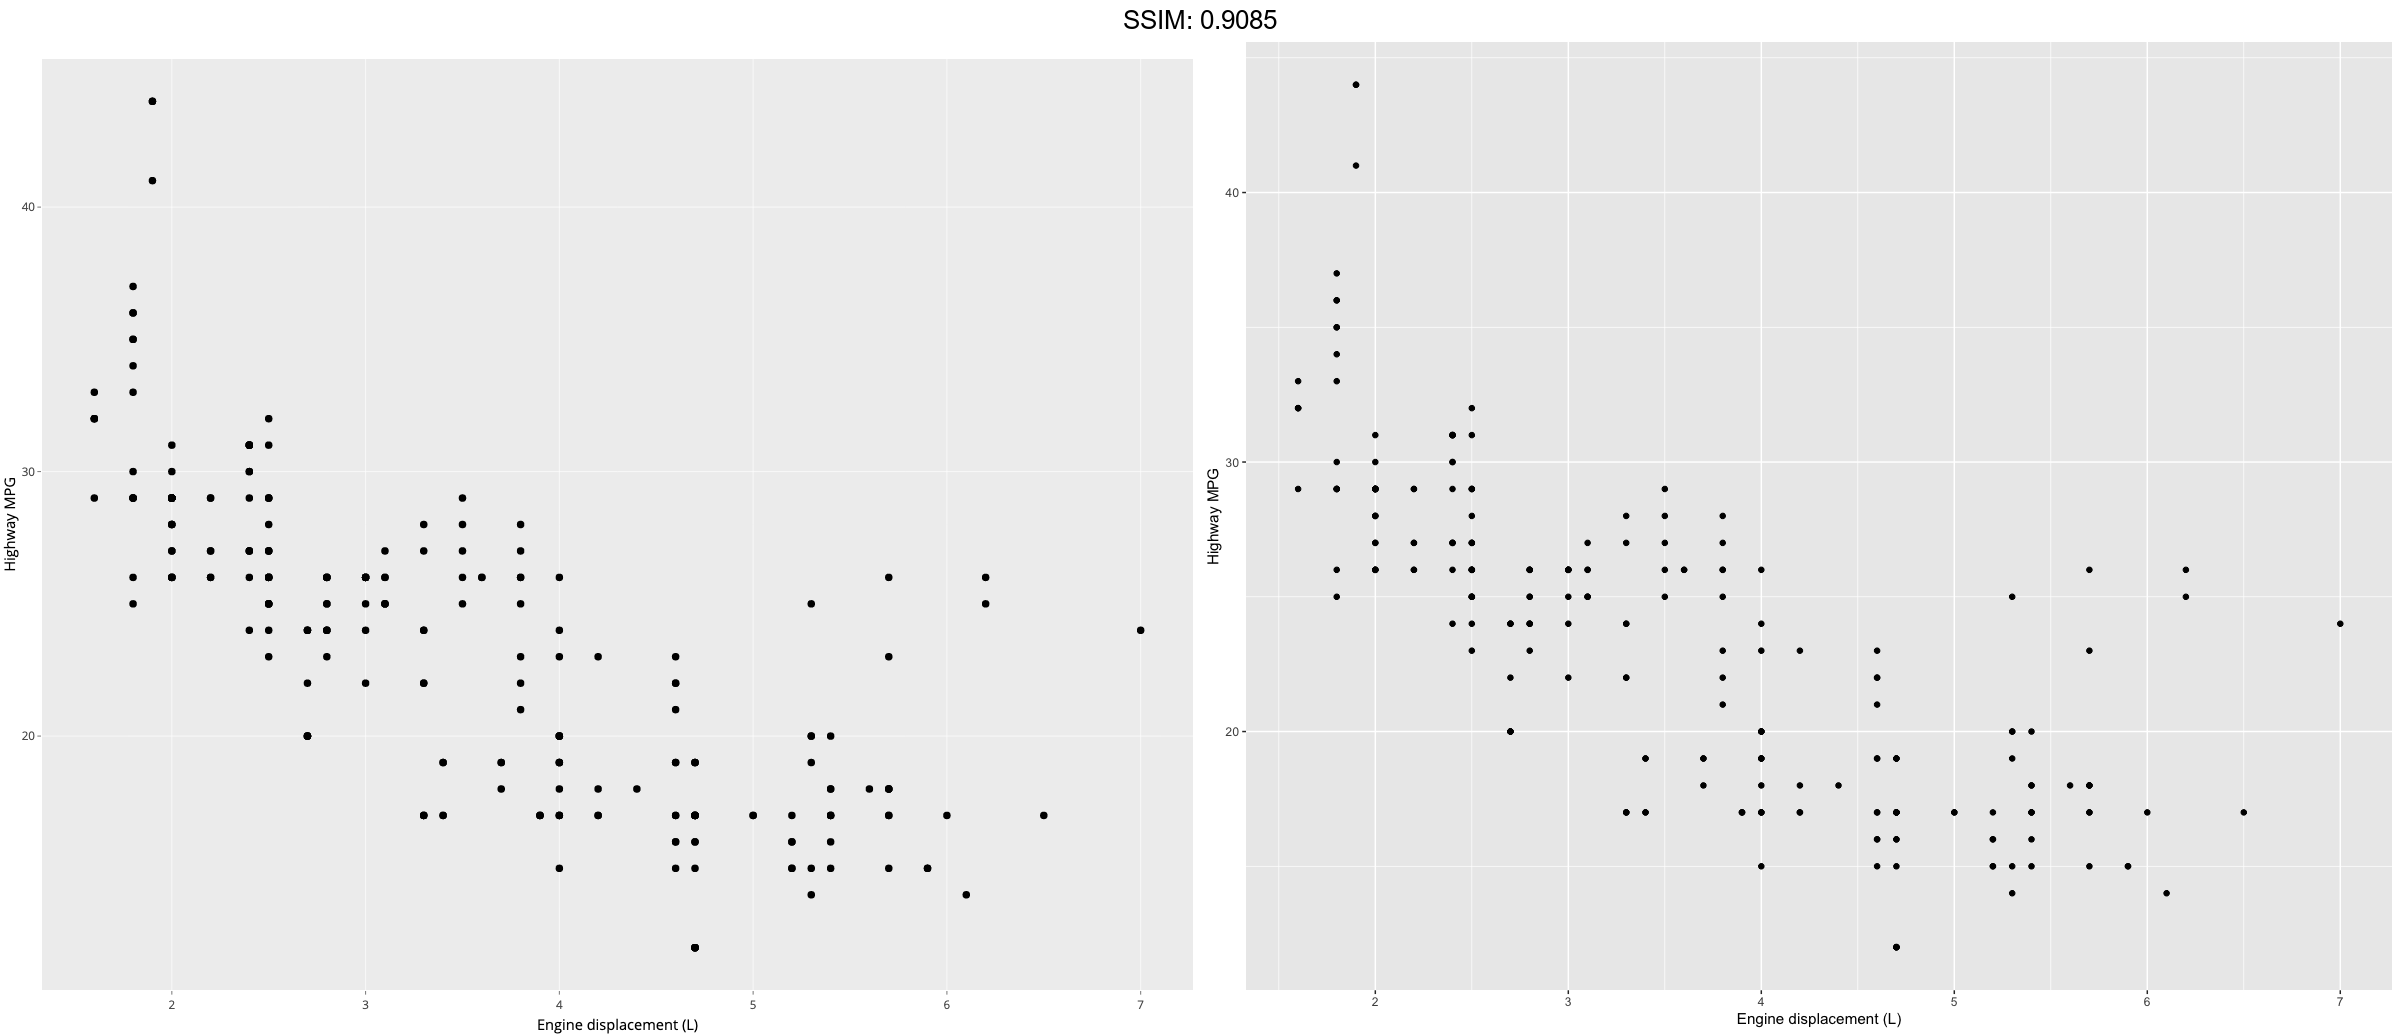
p1 <- ggplot(mpg, aes(displ, hwy)) +
  geom_point()
p <-
 p1 +
  scale_x_continuous("Engine displacement (L)") +
  scale_y_continuous("Highway MPG")
plotly::ggplotly(p)


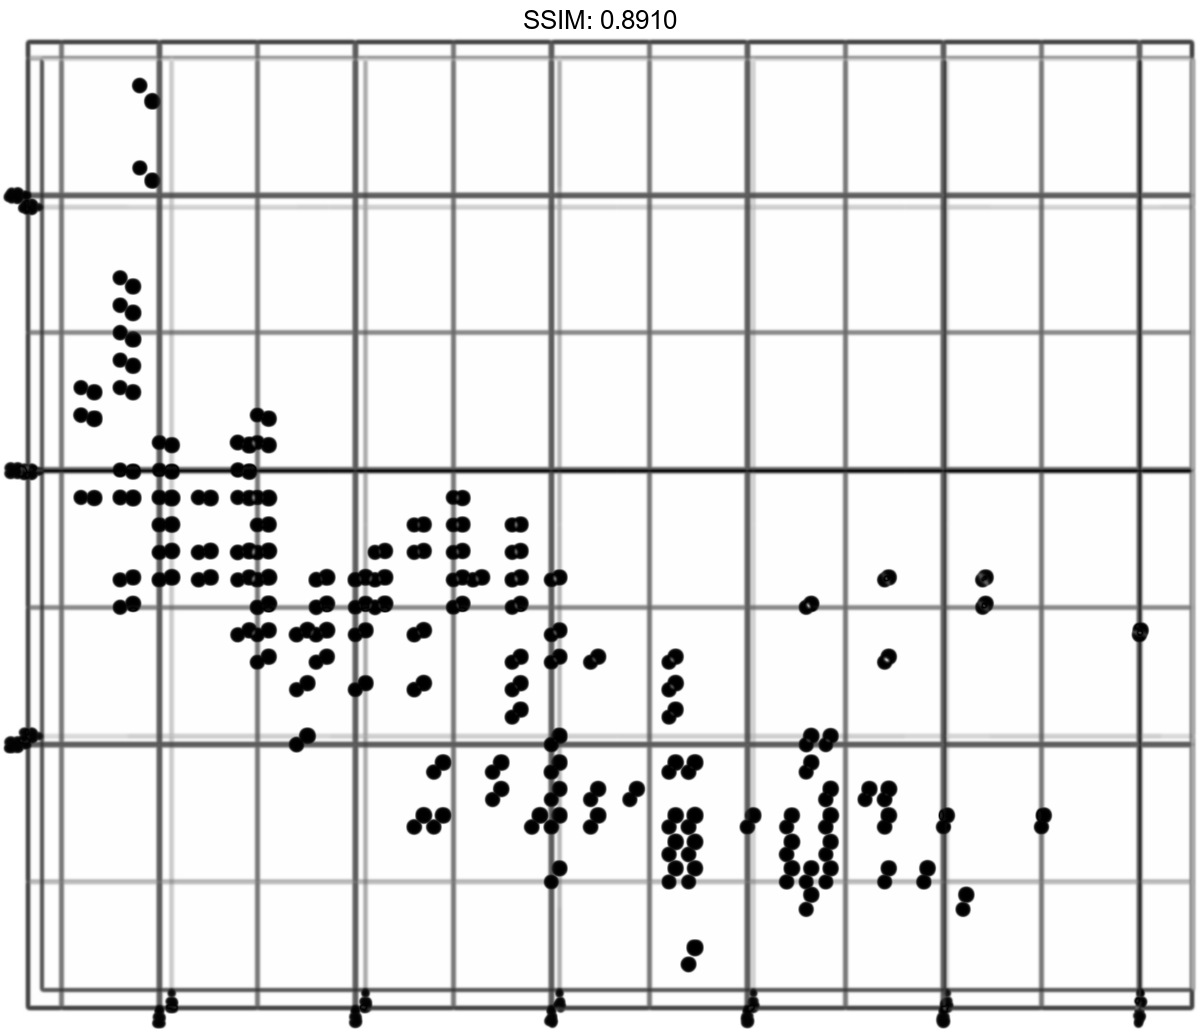
p1 <- ggplot(mpg, aes(displ, hwy)) +
  geom_point()
p <-  p1 + labs(x = NULL, y = NULL)
plotly::ggplotly(p)


p1 <- ggplot(mpg, aes(displ, hwy)) +
  geom_point()
p <-  p1 + scale_x_continuous(limits = c(2, 6))
plotly::ggplotly(p)


p1 <- ggplot(mpg, aes(displ, hwy)) +
  geom_point()
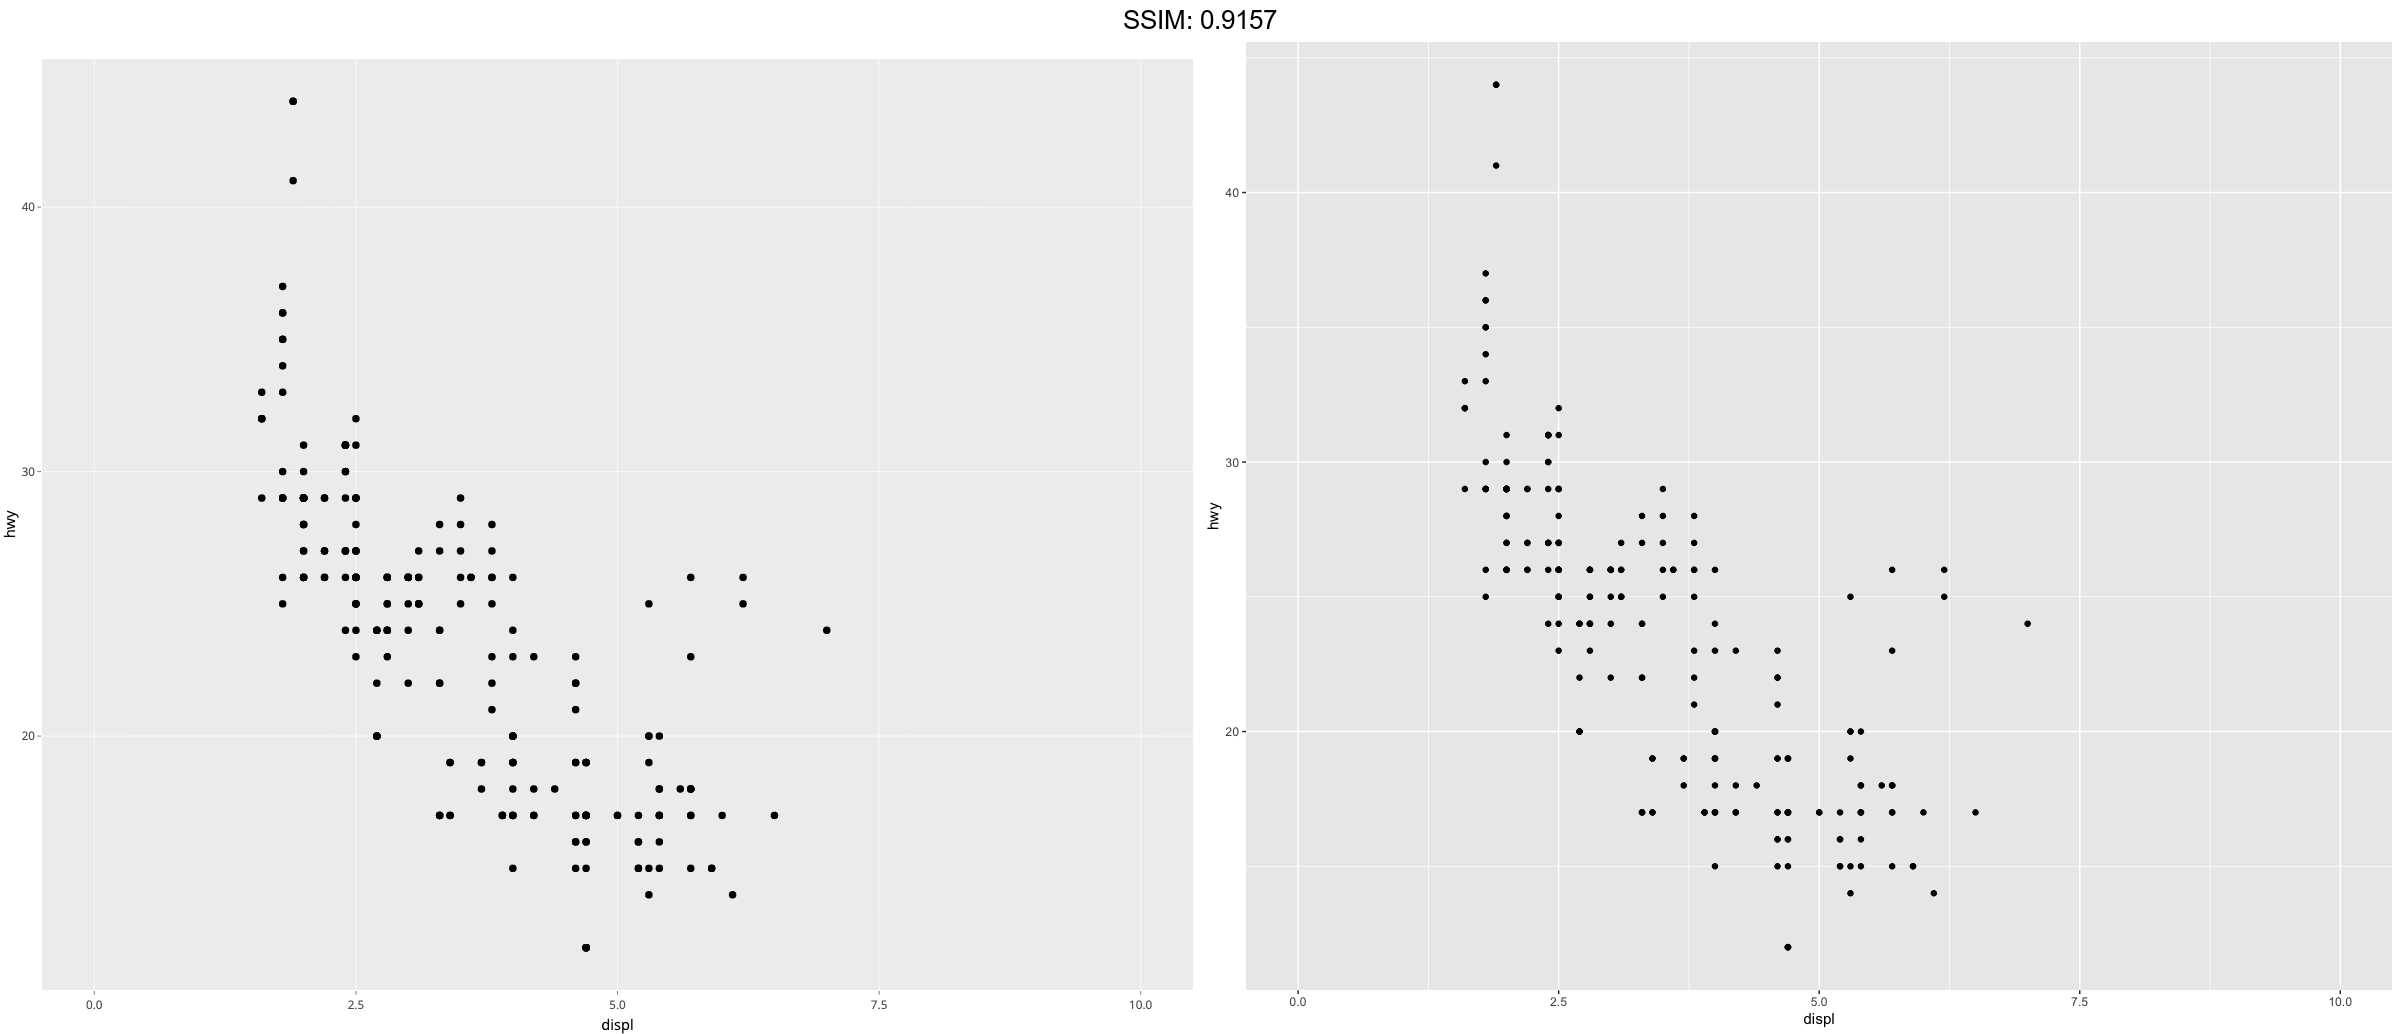
p <-  p1 + scale_x_continuous(limits = c(0, 10))
plotly::ggplotly(p)

p1 <- ggplot(mpg, aes(displ, hwy)) +
  geom_point()
p <-  p1 + xlim(2, 6)
plotly::ggplotly(p)


p1 <- ggplot(mpg, aes(displ, hwy)) +
  geom_point()
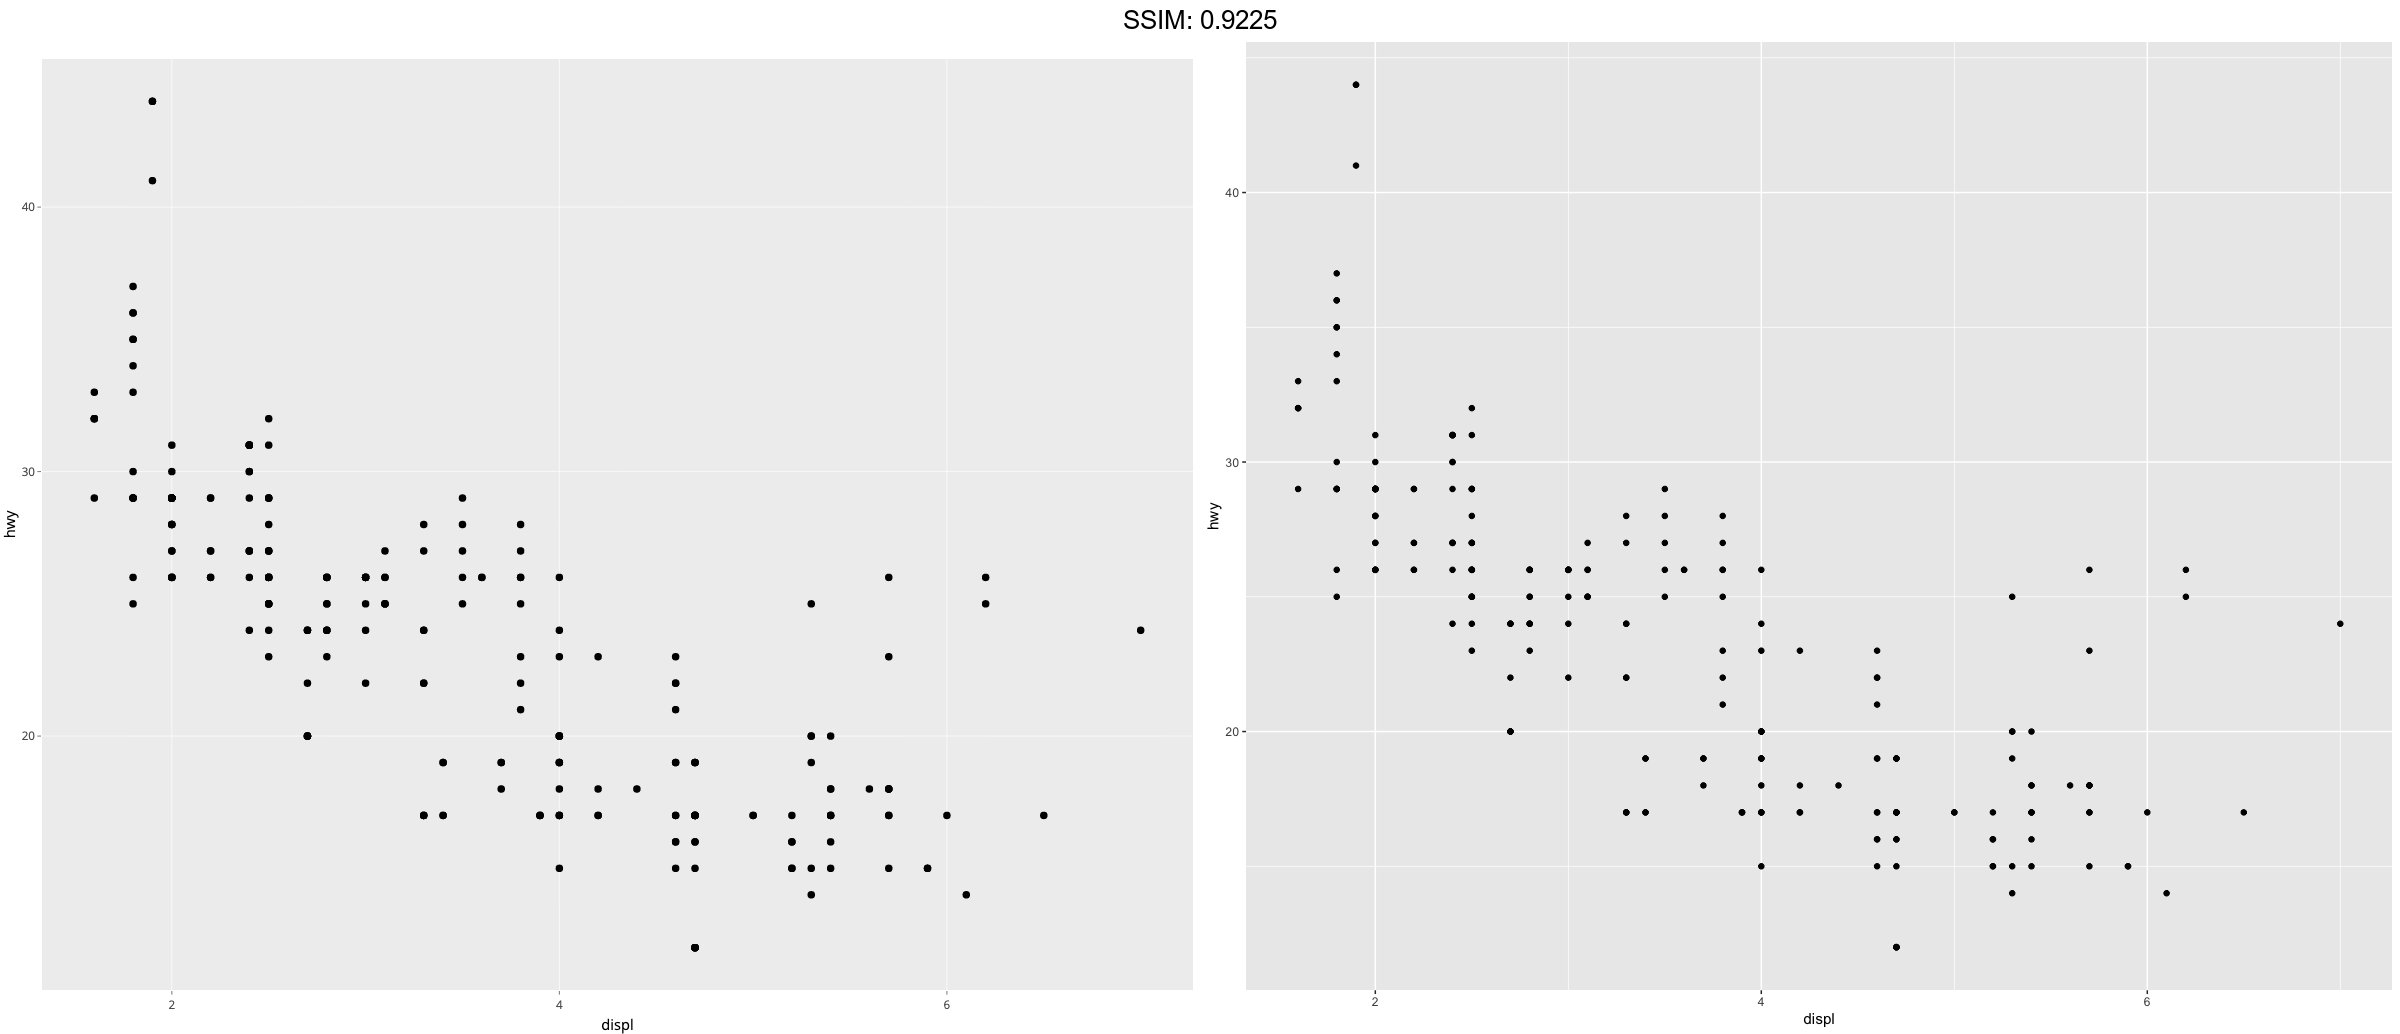
p <-  p1 + scale_x_continuous(breaks = c(2, 4, 6))
plotly::ggplotly(p)

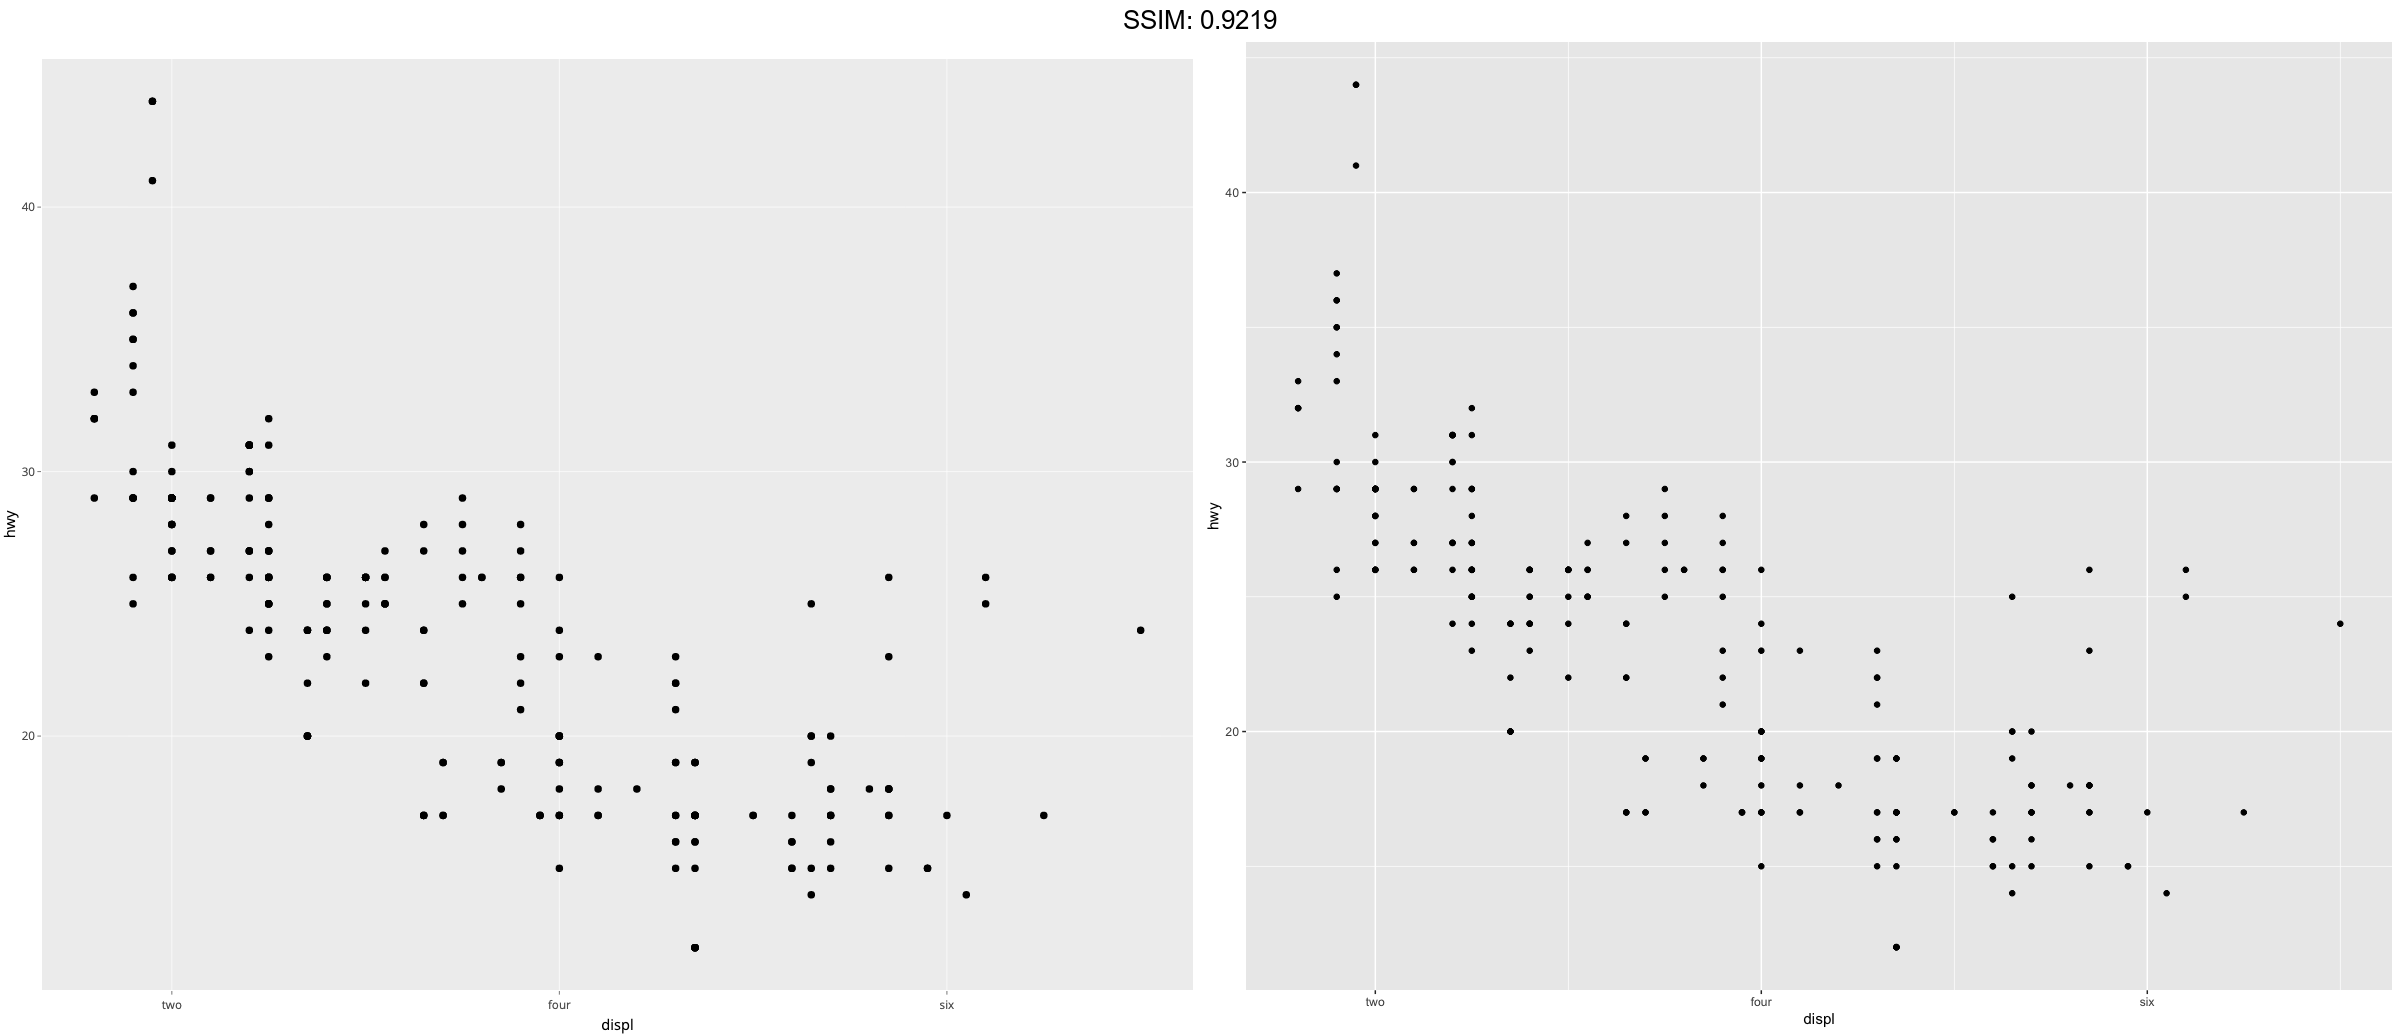
p1 <- ggplot(mpg, aes(displ, hwy)) +
  geom_point()
p <-
 p1 + scale_x_continuous(
  breaks = c(2, 4, 6),
  label = c("two", "four", "six")
)
plotly::ggplotly(p)

df <- data.frame(
  x = rnorm(10) * 100000,
  y = seq(0, 1, length.out = 10)
)
p2 <- ggplot(df, aes(x, y)) + geom_point()
p <-  p2 + scale_y_continuous(labels = scales::percent)
plotly::ggplotly(p)


df <- data.frame(
  x = rnorm(10) * 100000,
  y = seq(0, 1, length.out = 10)
)
p2 <- ggplot(df, aes(x, y)) + geom_point()
p <-  p2 + scale_y_continuous(labels = scales::dollar)
plotly::ggplotly(p)


df <- data.frame(
  x = rnorm(10) * 100000,
  y = seq(0, 1, length.out = 10)
)
p2 <- ggplot(df, aes(x, y)) + geom_point()
p <-  p2 + scale_x_continuous(labels = scales::comma)
plotly::ggplotly(p)


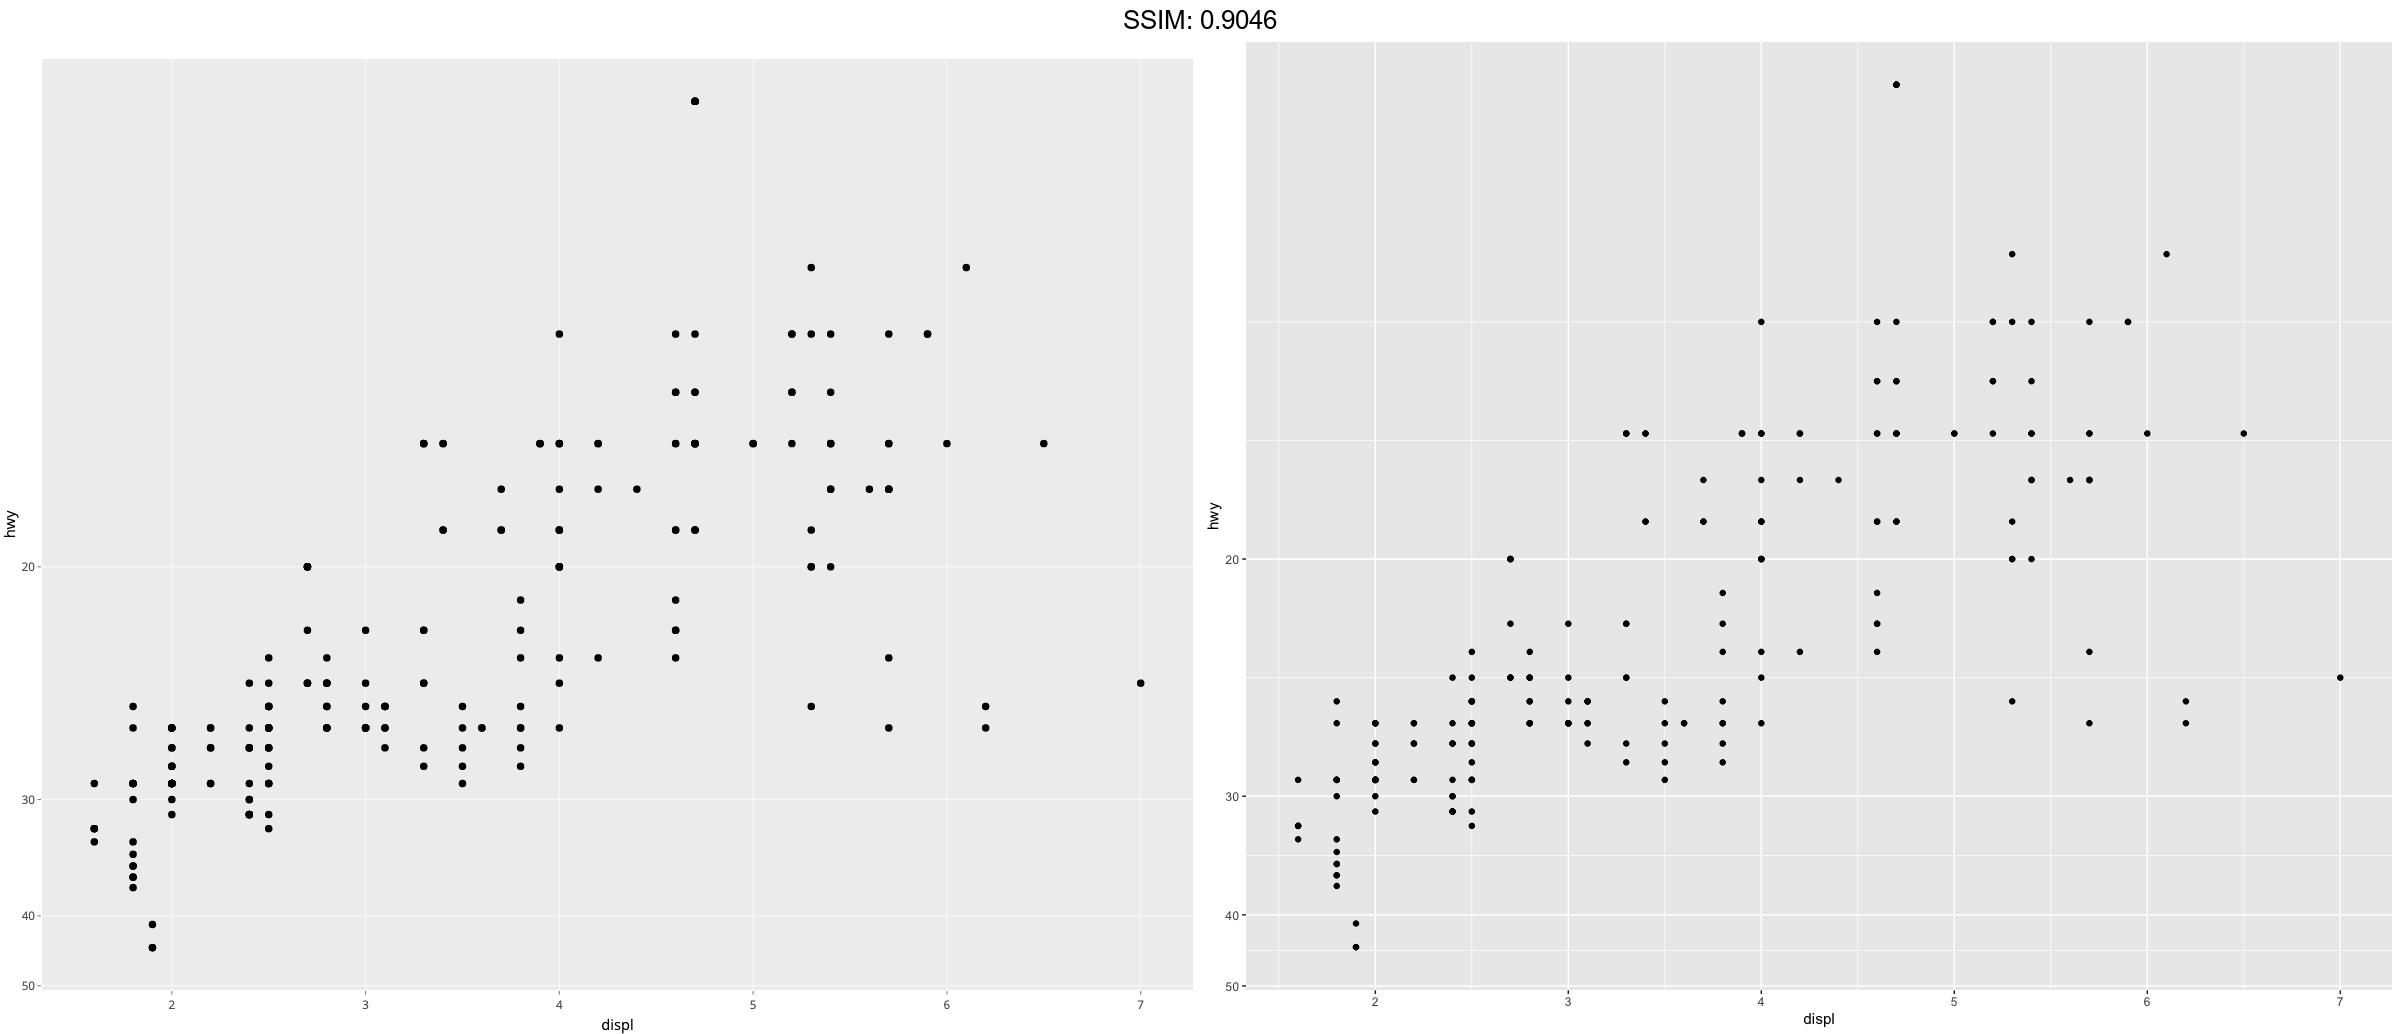
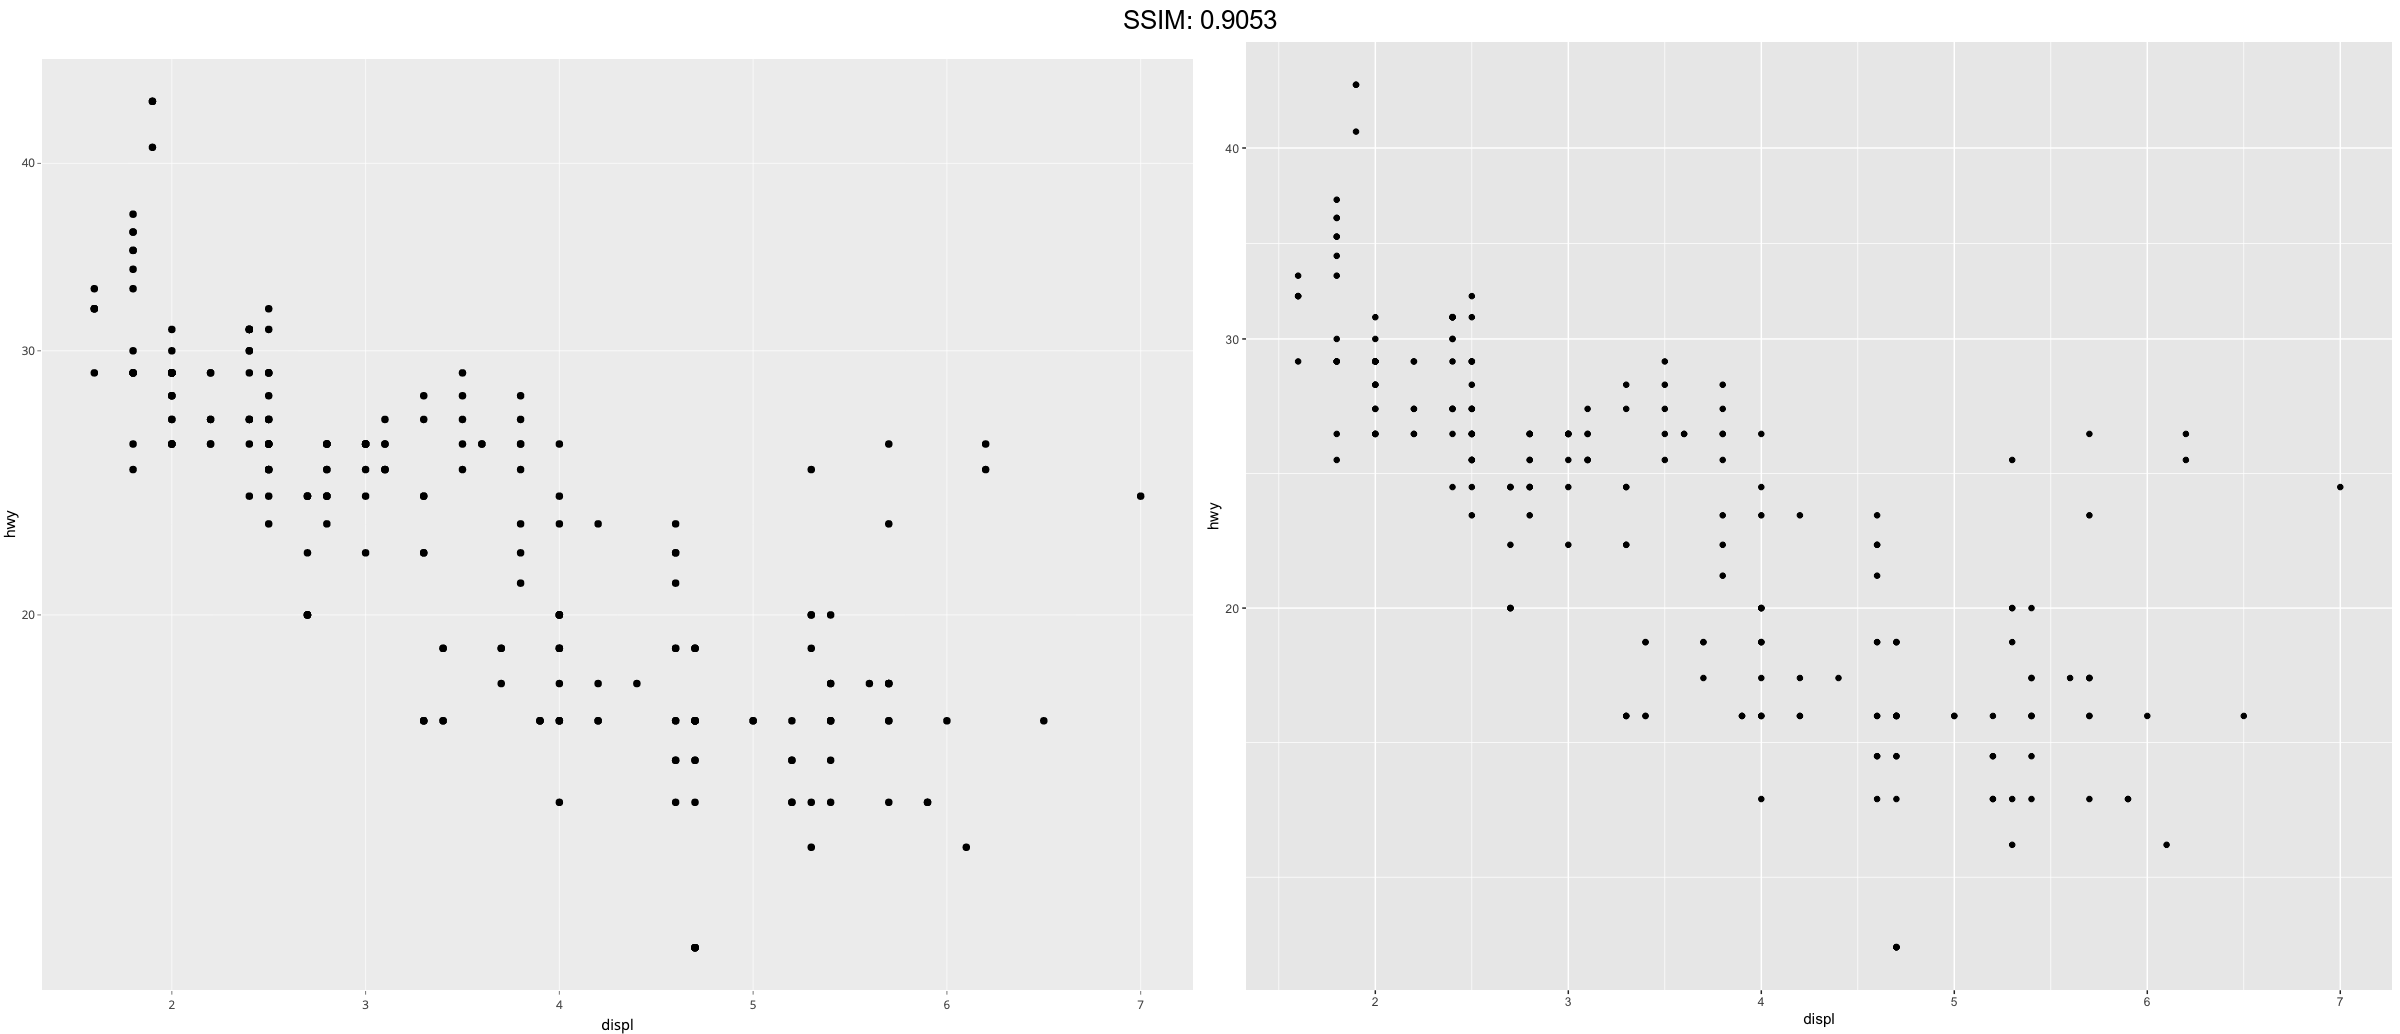
p1 <- ggplot(mpg, aes(displ, hwy)) +
  geom_point()
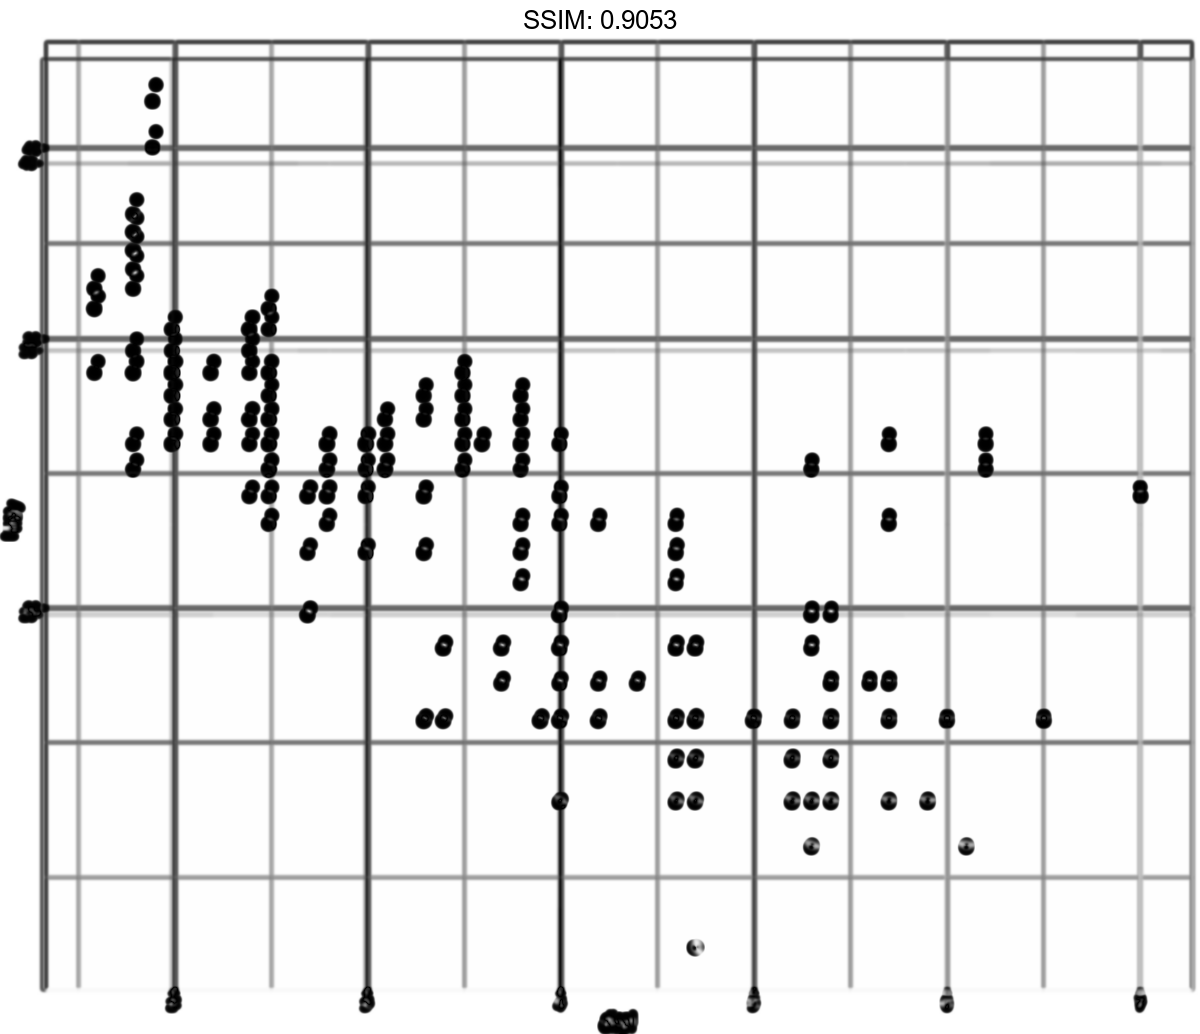
p <-  p1 + scale_y_log10()
plotly::ggplotly(p)

p1 <- ggplot(mpg, aes(displ, hwy)) +
  geom_point()
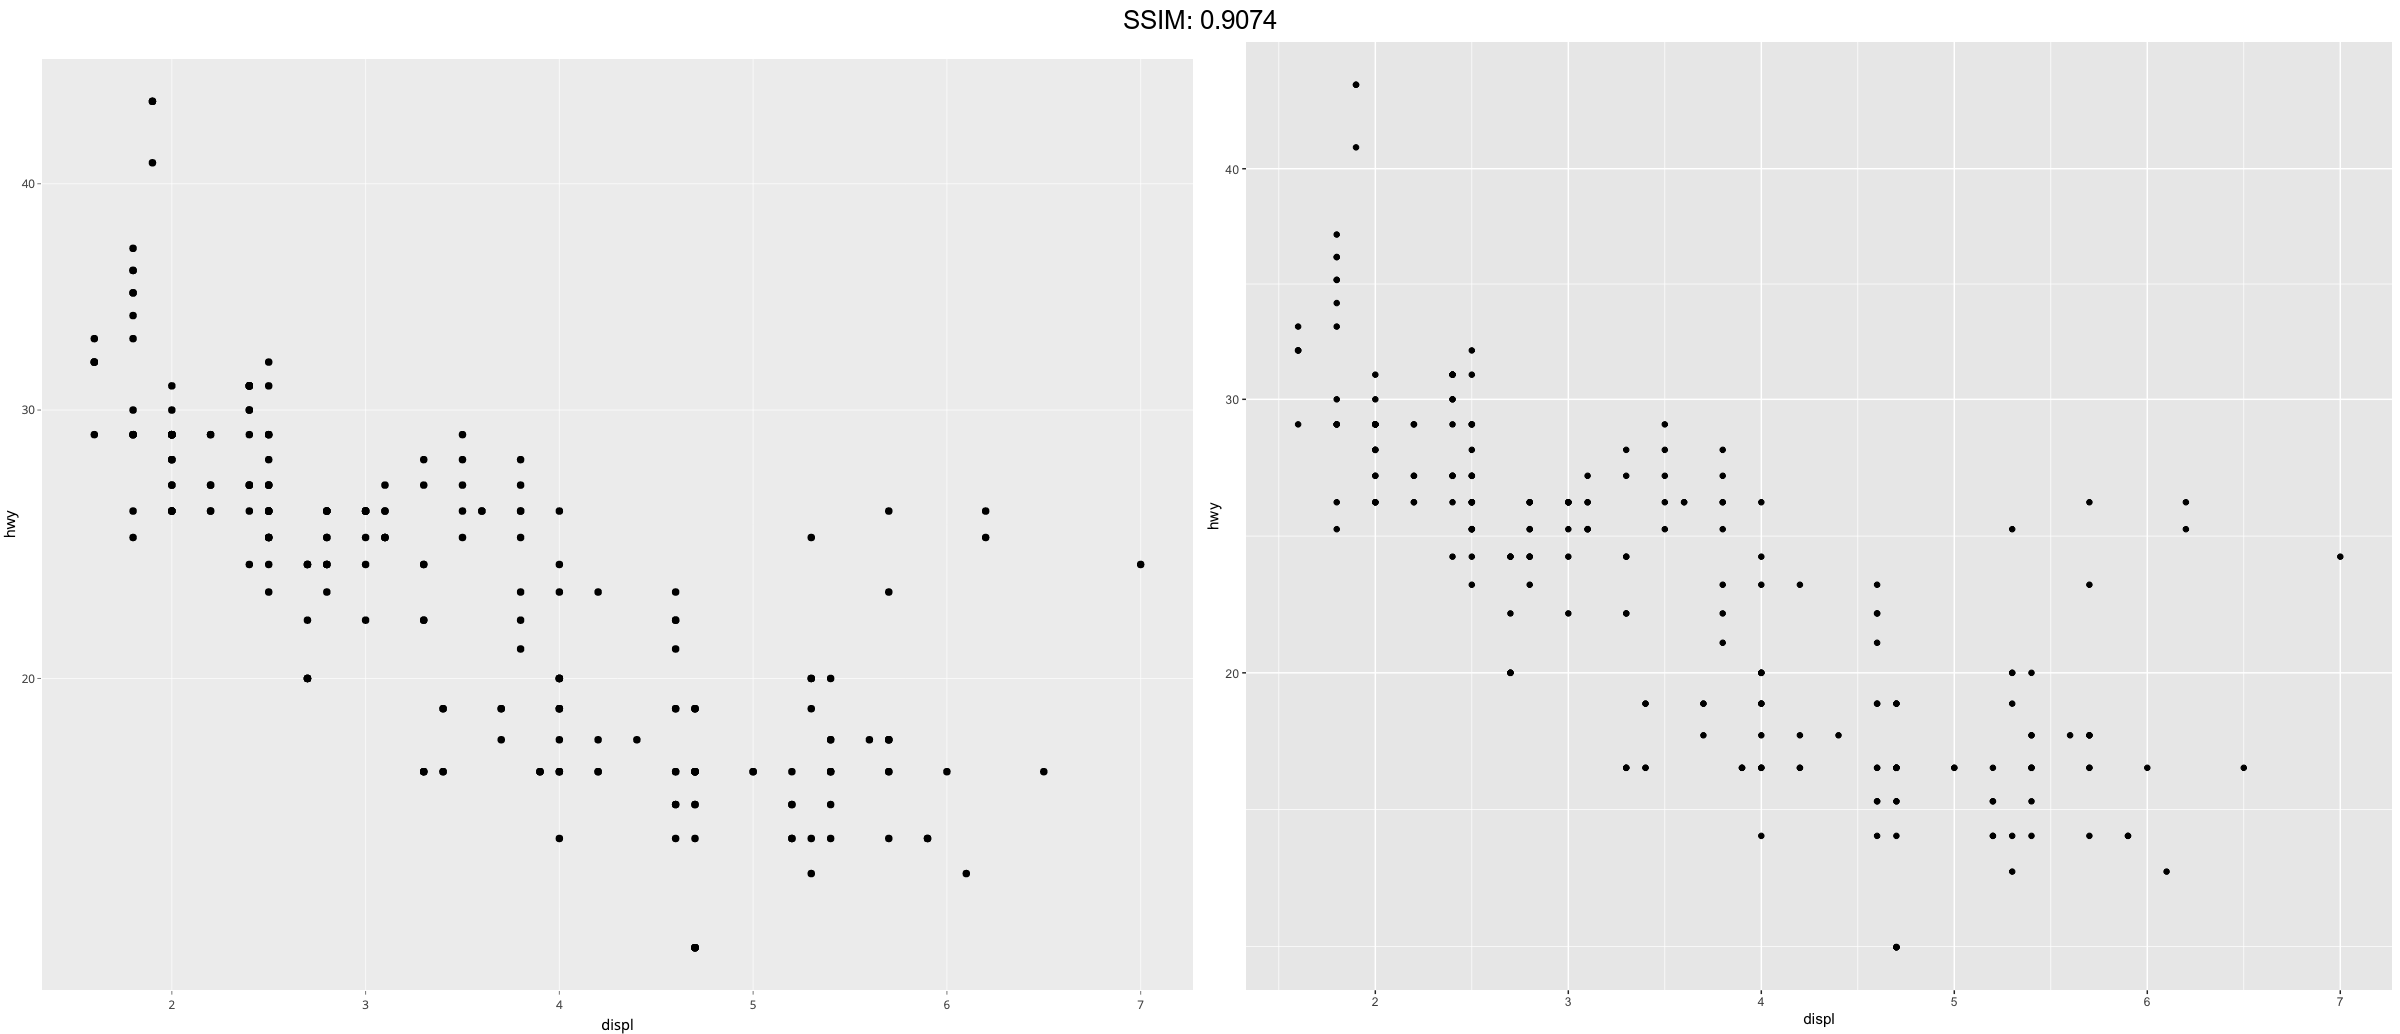
p <-  p1 + scale_y_sqrt()
plotly::ggplotly(p)


p1 <- ggplot(mpg, aes(displ, hwy)) +
  geom_point()
p <-  p1 + scale_y_reverse()
plotly::ggplotly(p)


p1 <- ggplot(mpg, aes(displ, hwy)) +
  geom_point()
p <-  p1 + scale_y_continuous(trans = scales::reciprocal_trans())
plotly::ggplotly(p)

