GGPLOT - scale_colour_discrete
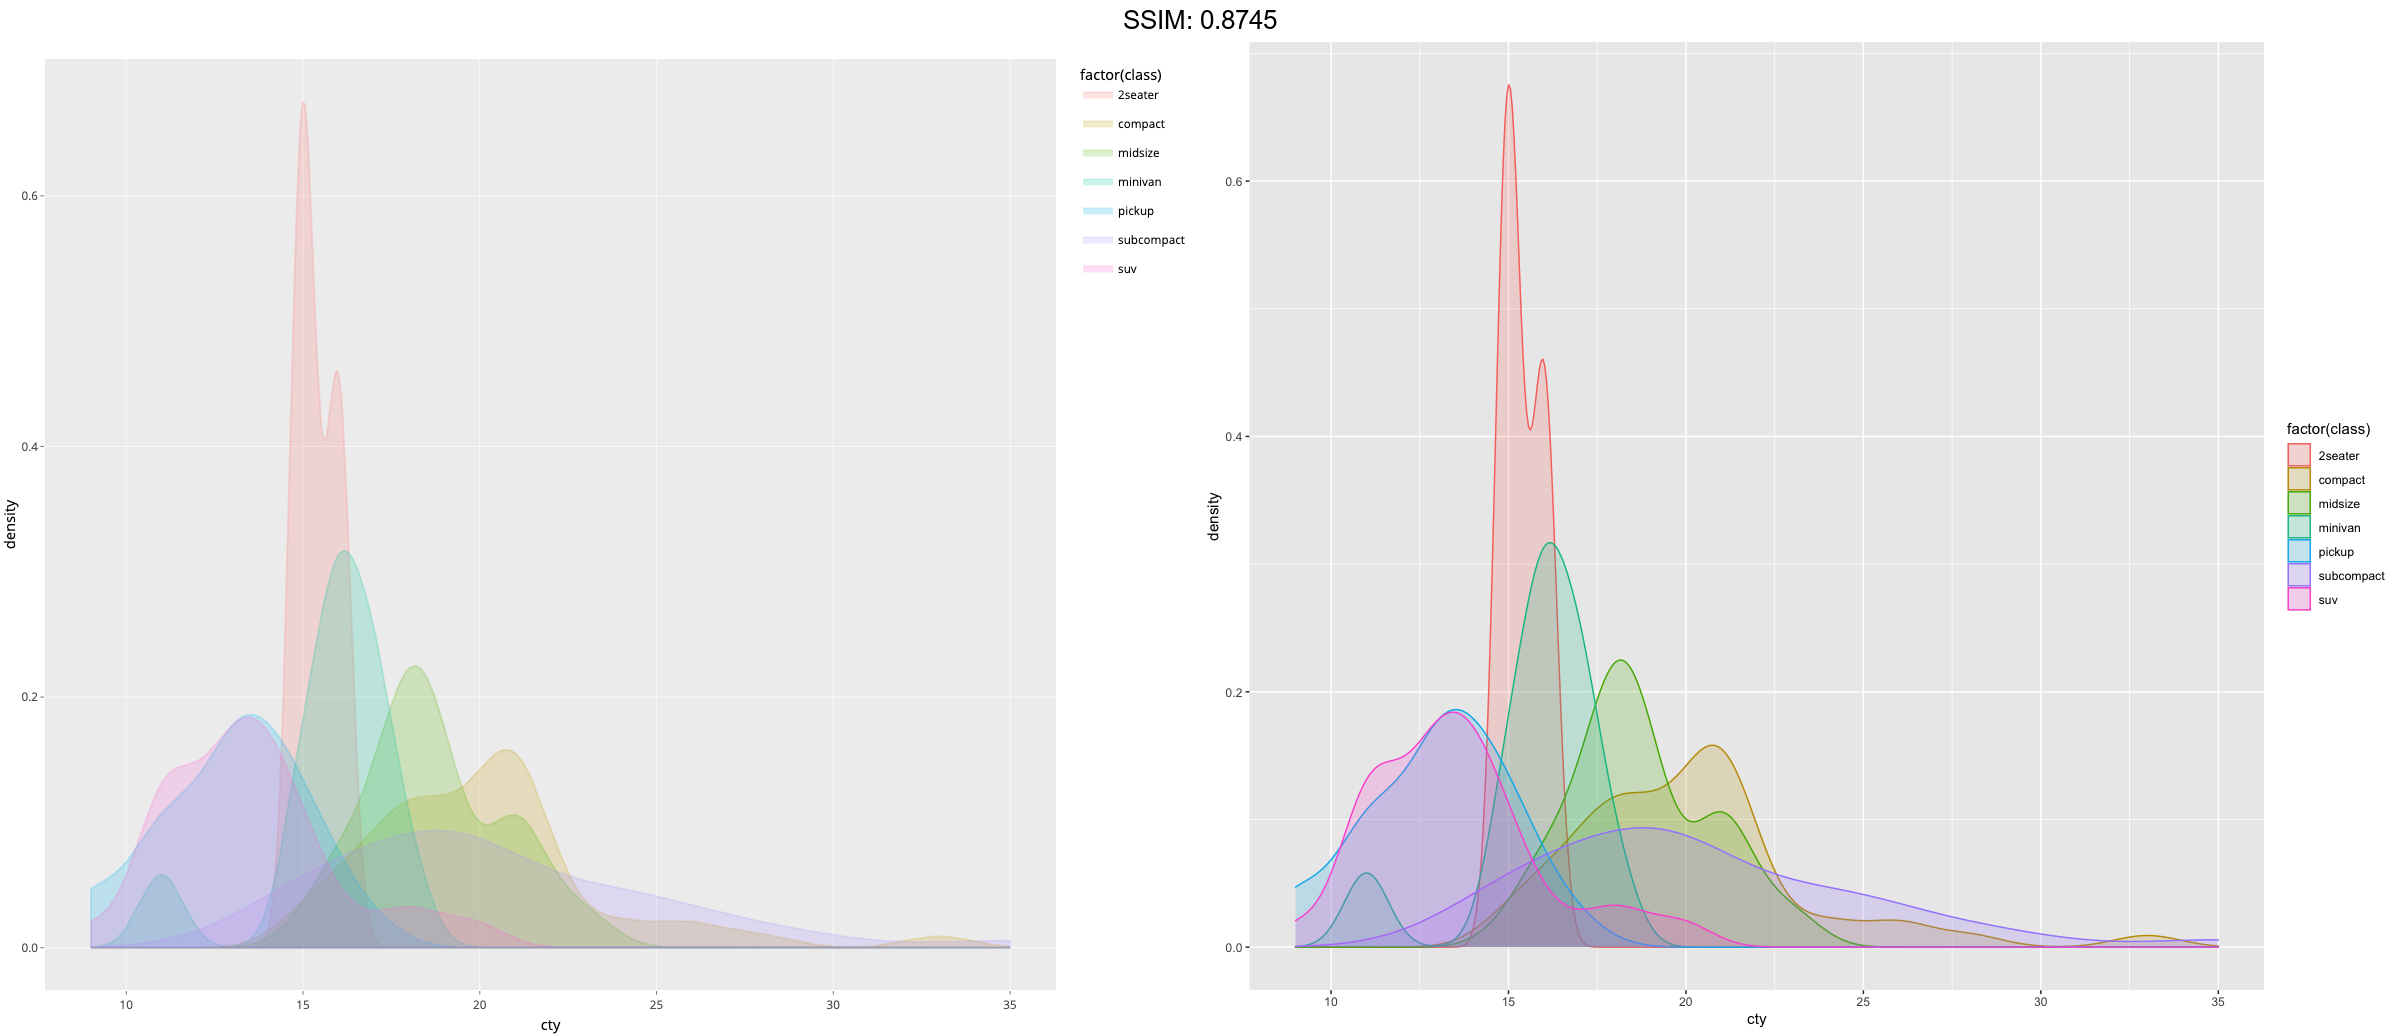
Uses for discrete colour scales and then convert them with ggplotly.
cty_by_var <- function(var) {
  ggplot(mpg, aes(cty, colour = factor(), fill = factor())) +
    geom_density(alpha = 0.2)
}
p <-  cty_by_var(class)
plotly::ggplotly(p)


cty_by_var <- function(var) {
  ggplot(mpg, aes(cty, colour = factor(), fill = factor())) +
    geom_density(alpha = 0.2)
}
okabe <- c("#E69F00", "#56B4E9", "#009E73", "#F0E442", "#0072B2", "#D55E00", "#CC79A7")
p <-
 withr::with_options(
  list(ggplot2.discrete.fill = okabe),
  print(cty_by_var(class))
)
plotly::ggplotly(p)

cty_by_var <- function(var) {
  ggplot(mpg, aes(cty, colour = factor(), fill = factor())) +
    geom_density(alpha = 0.2)
}
discrete_palettes <- list(
  c("skyblue", "orange"),
  RColorBrewer::brewer.pal(3, "Set2"),
  RColorBrewer::brewer.pal(6, "Accent")
)
p <-
 withr::with_options(
  list(ggplot2.discrete.fill = discrete_palettes), {
  # 1st palette is used when there 1-2 levels (e.g., year)
  print(cty_by_var(year))
  # 2nd palette is used when there are 3 levels
  print(cty_by_var(drv))
  # 3rd palette is used when there are 4-6 levels
  print(cty_by_var(fl))
})
plotly::ggplotly(p)
## Warning: Groups with fewer than two data points have been dropped.

