GGPLOT - scale_colour_continuous
Uses when continuous data values are mapped onto the colour or fill aesthetics and then convert them with ggplotly.
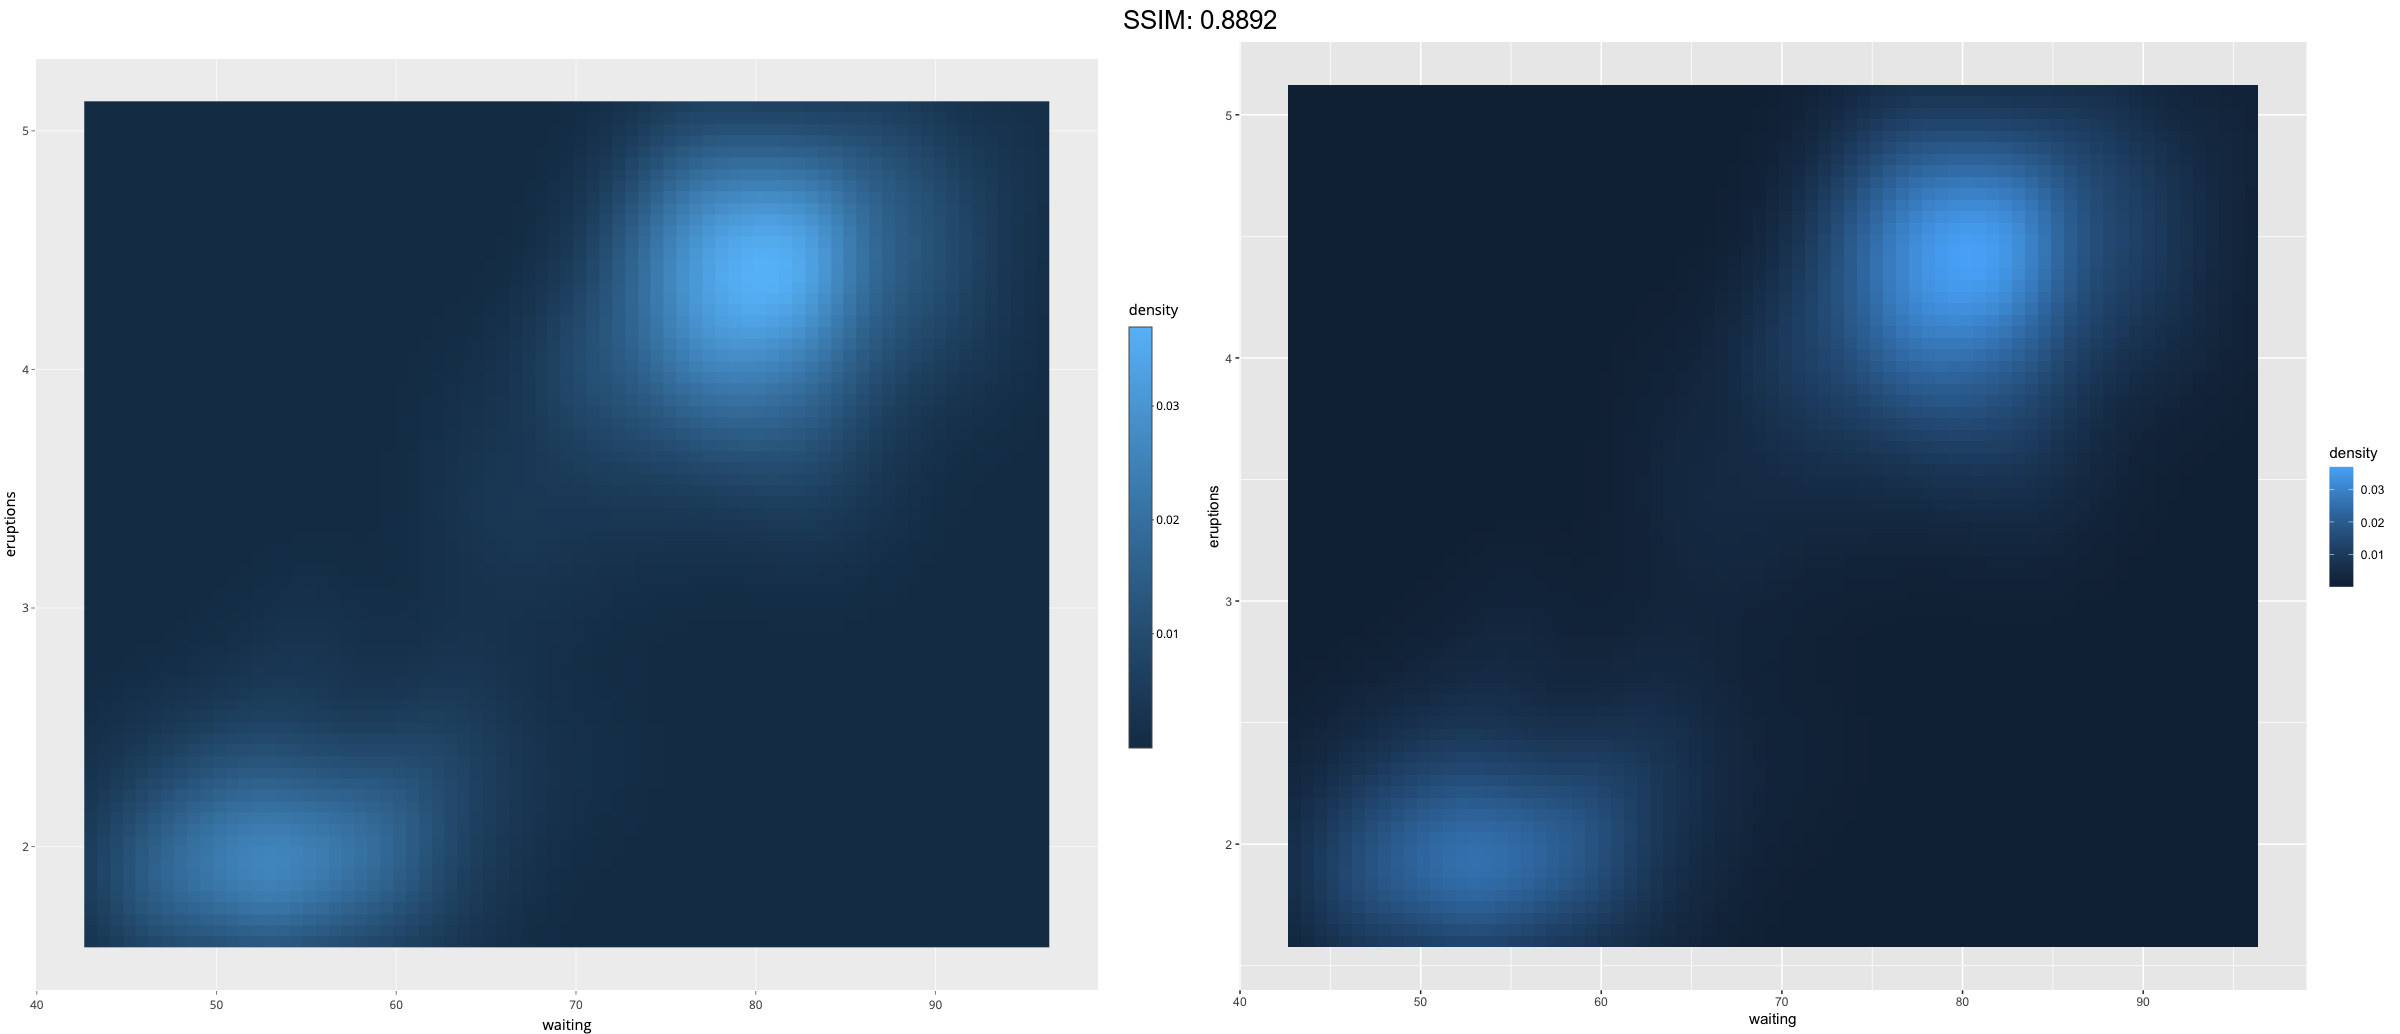
v <- ggplot(faithfuld, aes(waiting, eruptions, fill = density)) +
geom_tile()
plotly::ggplotly(v)


v <- ggplot(faithfuld, aes(waiting, eruptions, fill = density)) +
geom_tile()
p <-  v + scale_fill_continuous(type = "gradient")
plotly::ggplotly(p)


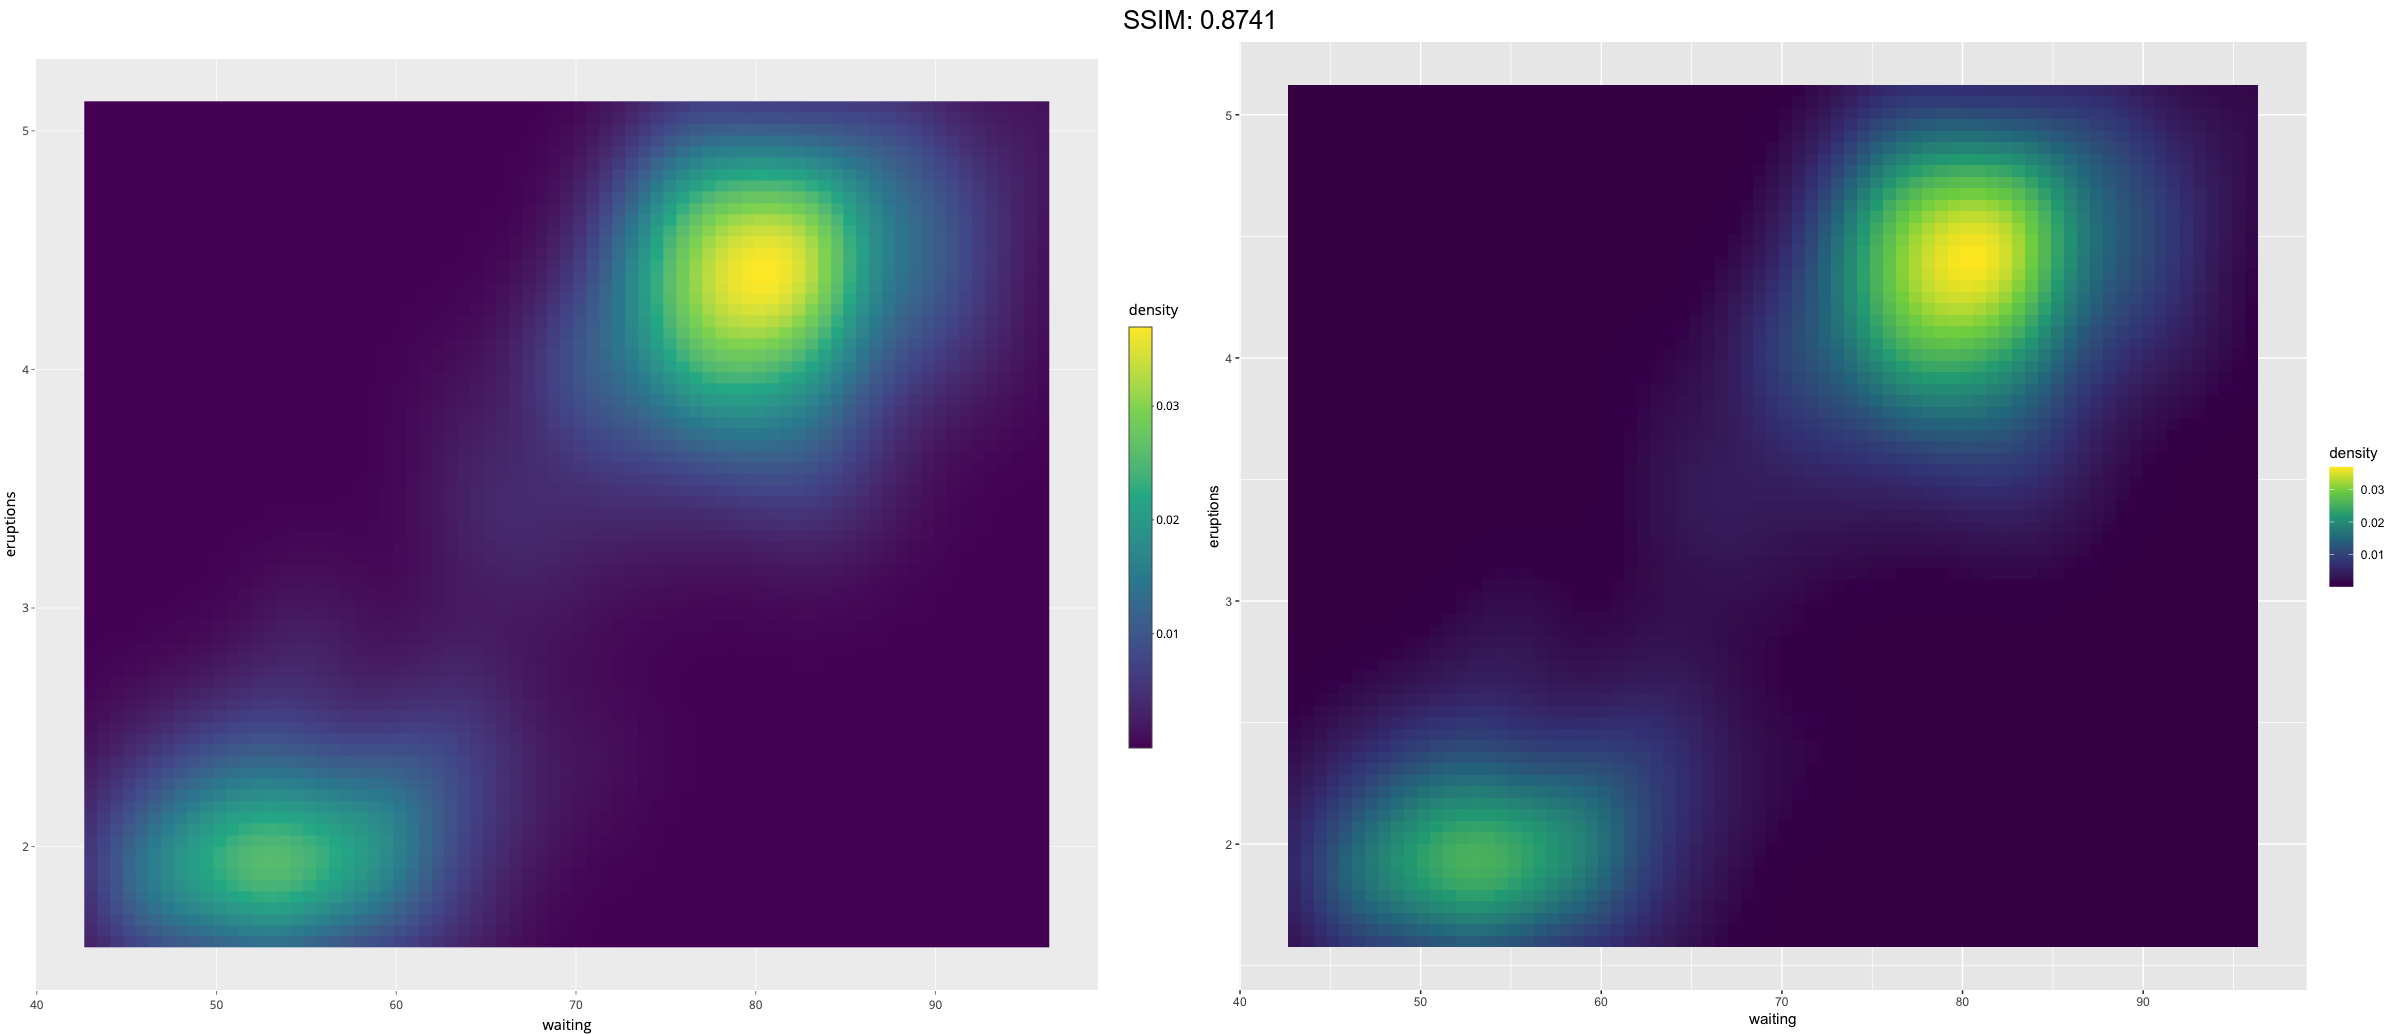
v <- ggplot(faithfuld, aes(waiting, eruptions, fill = density)) +
geom_tile()
p <-  v + scale_fill_continuous(type = "viridis")
plotly::ggplotly(p)

v <- ggplot(faithfuld, aes(waiting, eruptions, fill = density)) +
geom_tile()
p <-  v + scale_fill_gradient()
plotly::ggplotly(p)


v <- ggplot(faithfuld, aes(waiting, eruptions, fill = density)) +
geom_tile()
p <-  v + scale_fill_viridis_c()
plotly::ggplotly(p)


v <- ggplot(faithfuld, aes(waiting, eruptions, fill = density)) +
geom_tile()
p <-  v + scale_fill_binned(type = "viridis")
plotly::ggplotly(p)


v <- ggplot(faithfuld, aes(waiting, eruptions, fill = density)) +
geom_tile()
tmp <- getOption("ggplot2.continuous.fill") # store current setting
options(ggplot2.continuous.fill = scale_fill_distiller)
p <-  v
options(ggplot2.continuous.fill = tmp) # restore previous setting
plotly::ggplotly(p)