GGPLOT - scale_alpha
Visually down-weight less important observations and then convert them with ggplotly
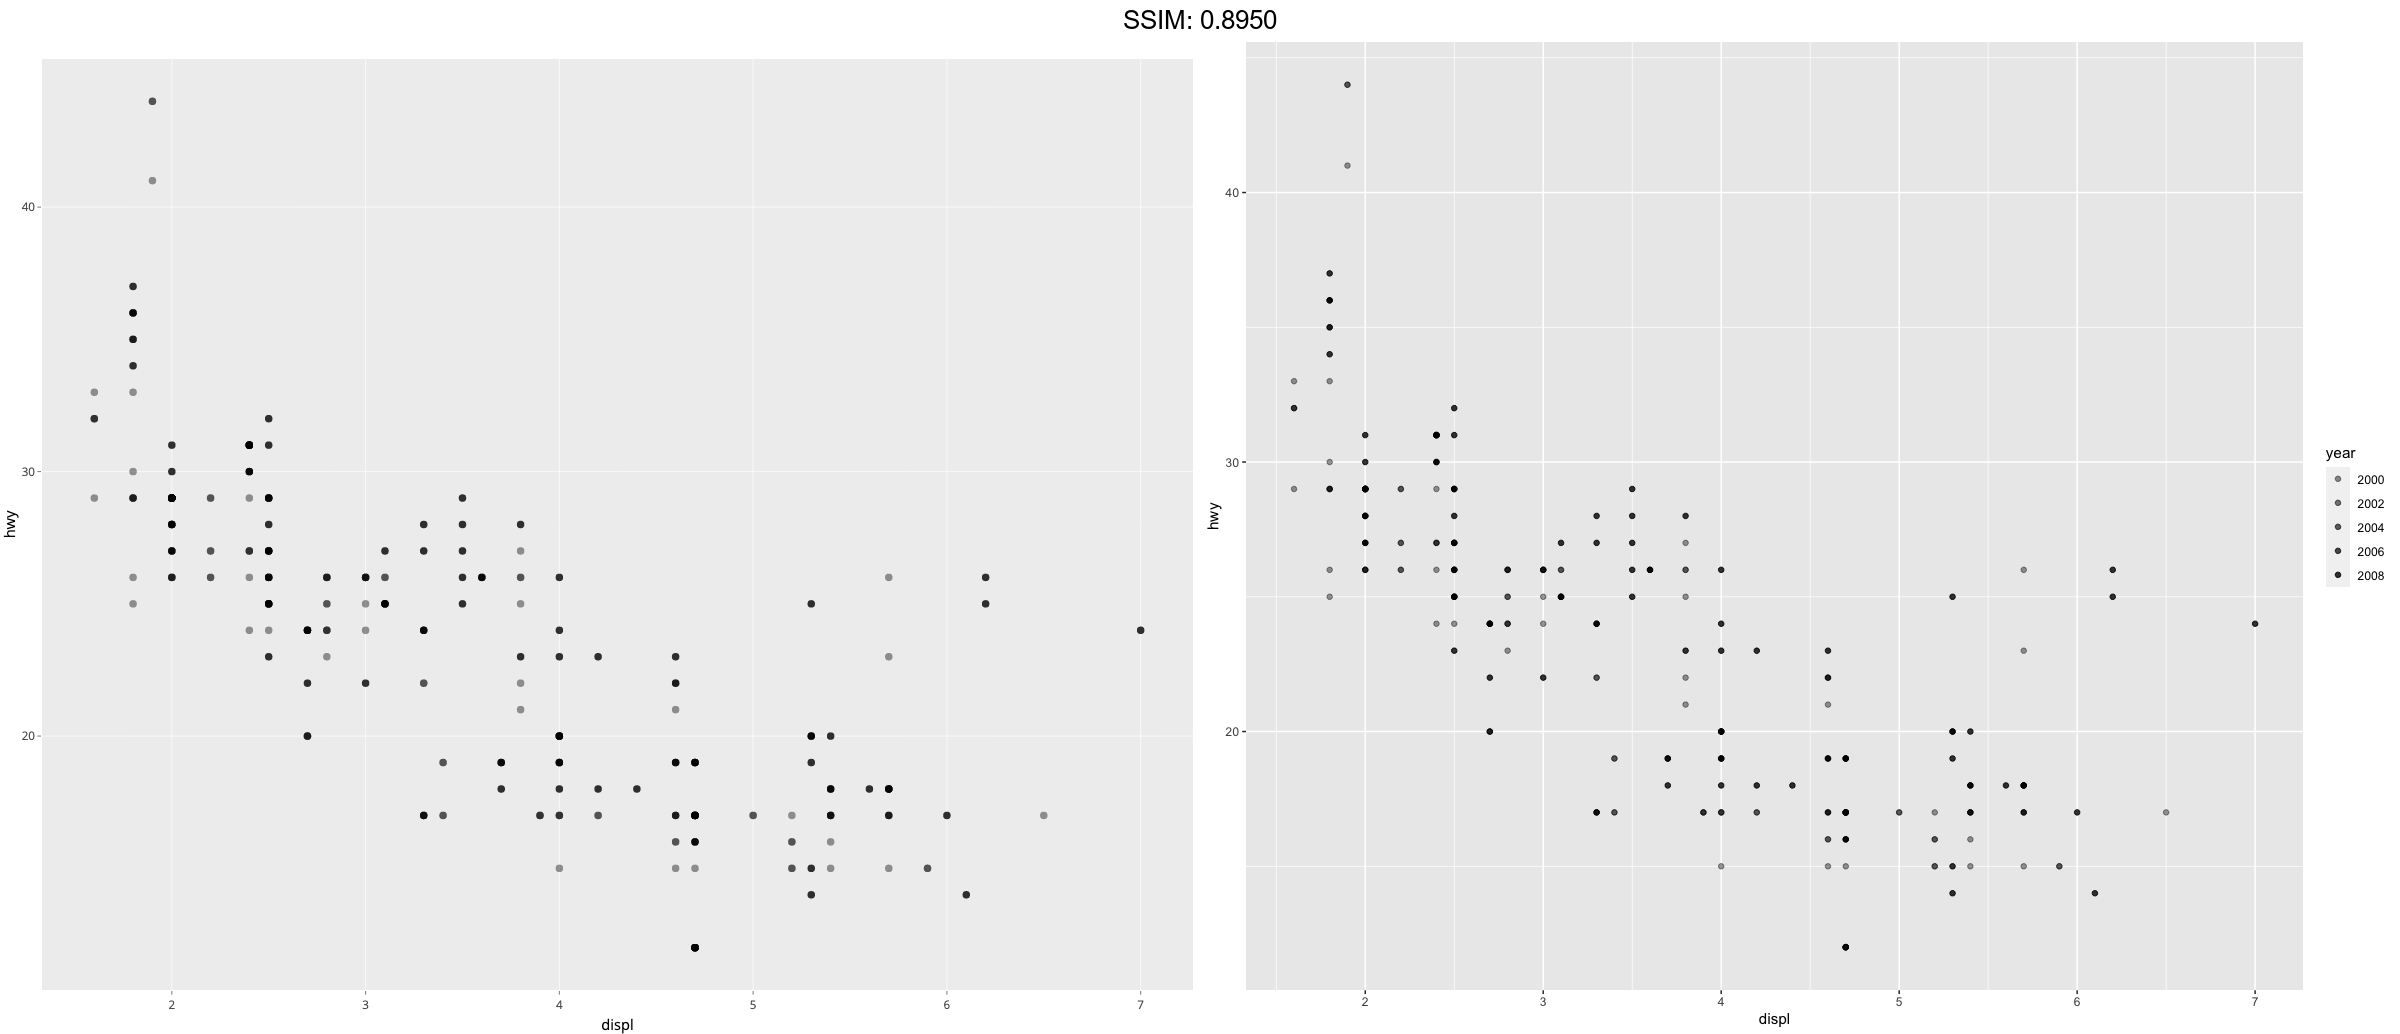
p <- ggplot(mpg, aes(displ, hwy)) +
  geom_point(aes(alpha = year))
plotly::ggplotly(p)

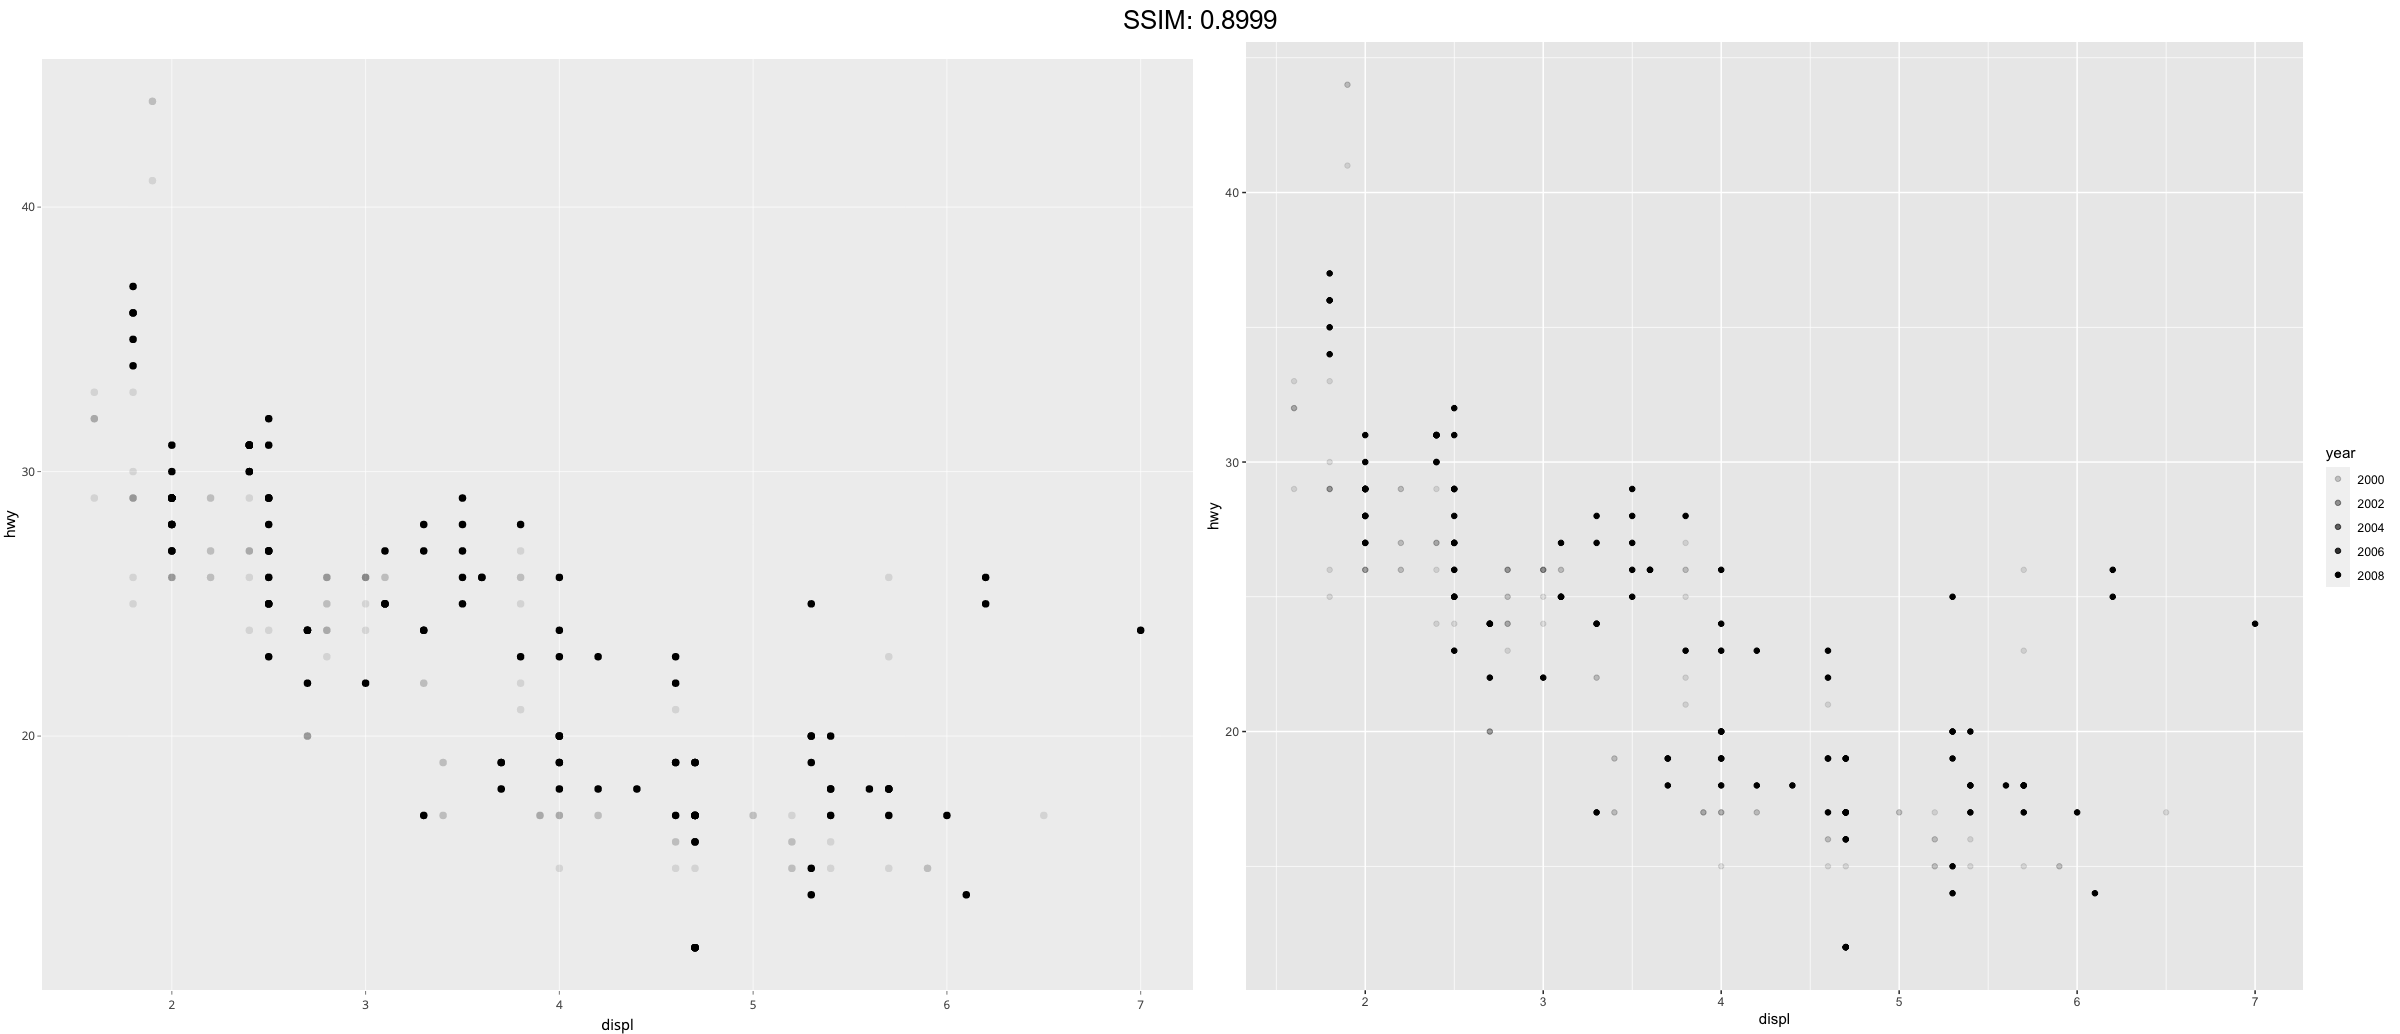

p <- ggplot(mpg, aes(displ, hwy)) +
  geom_point(aes(alpha = year))
p <-  p + scale_alpha("cylinders")
plotly::ggplotly(p)

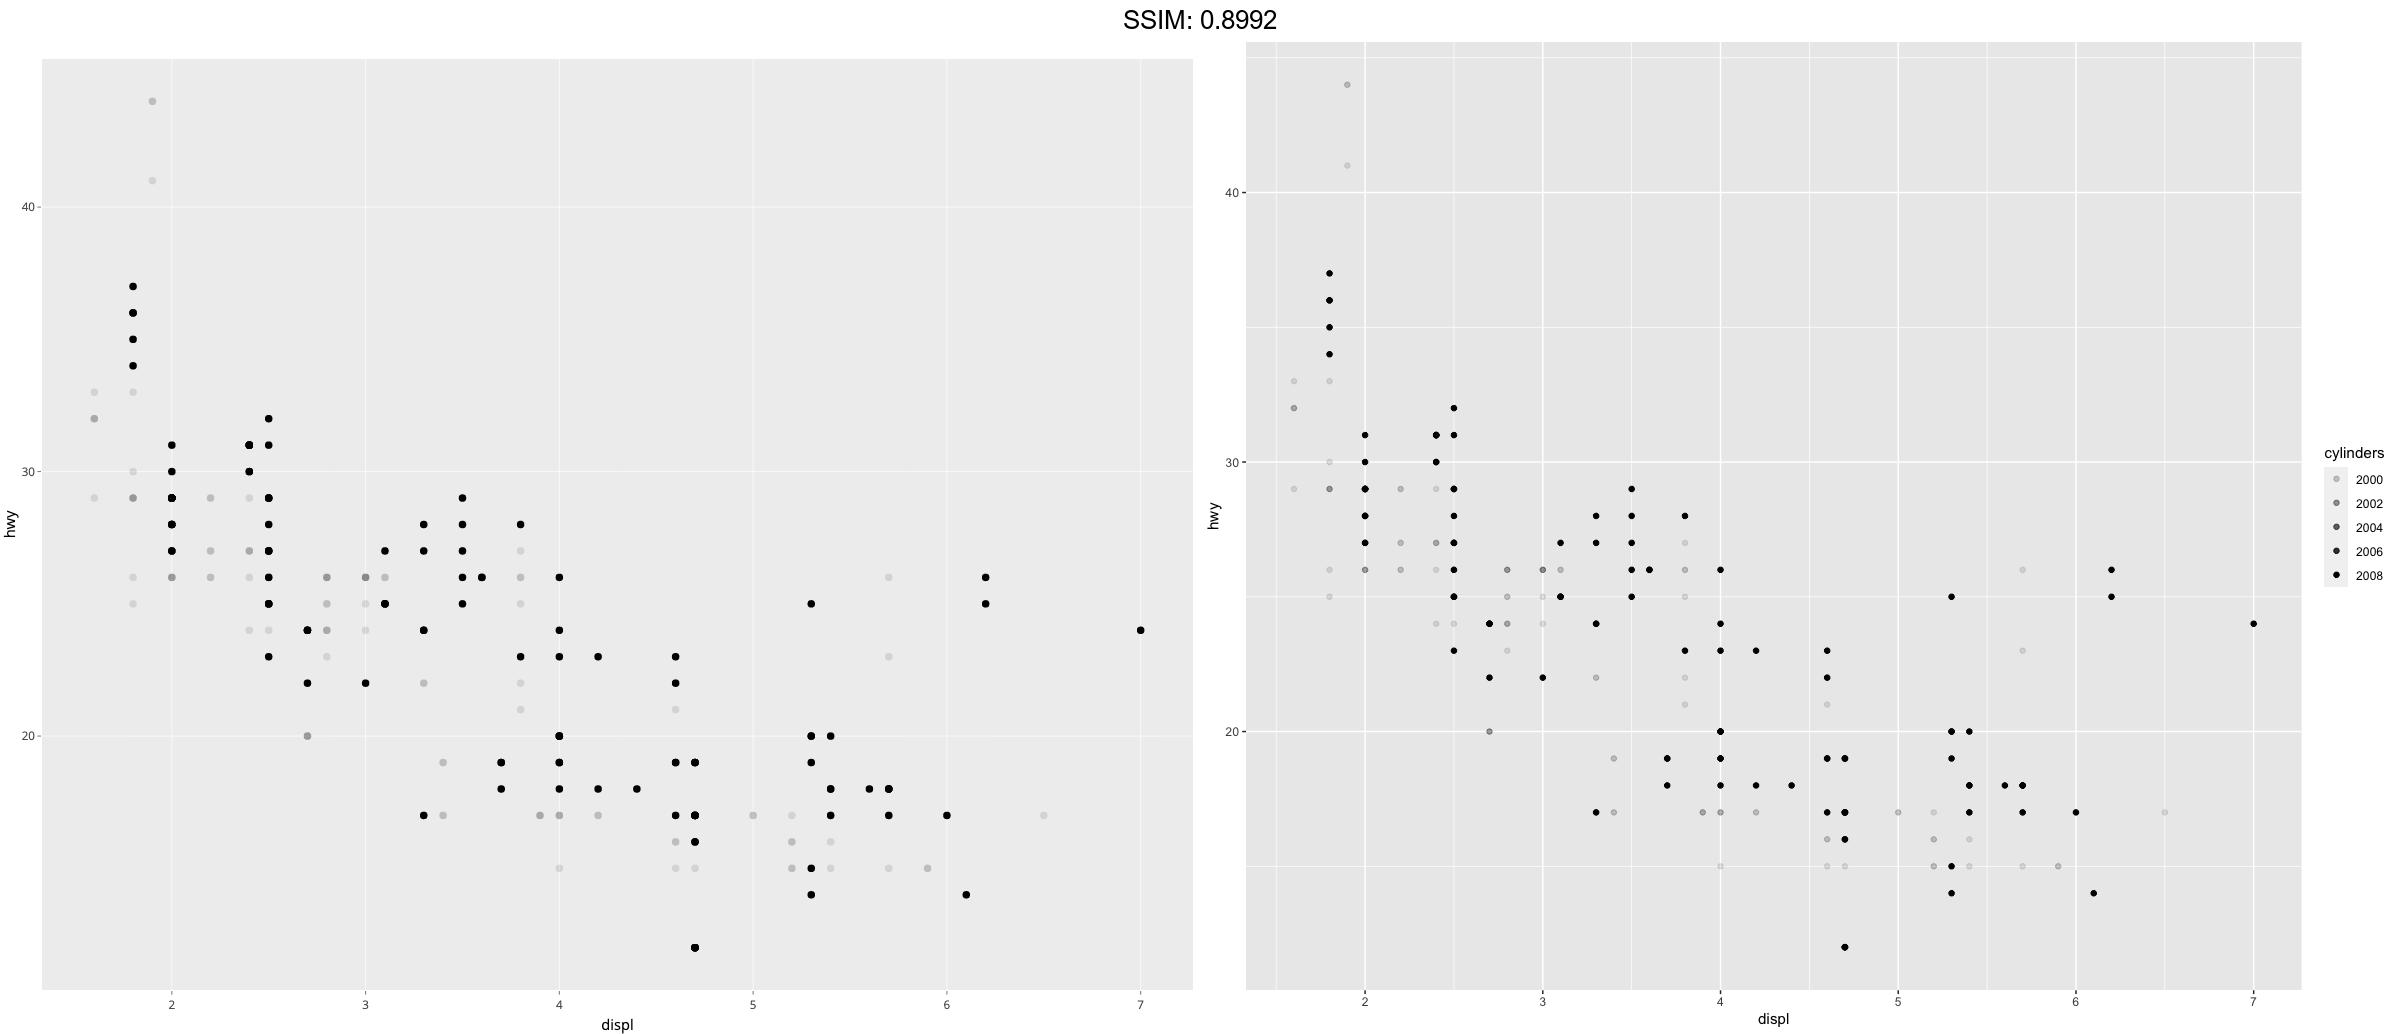
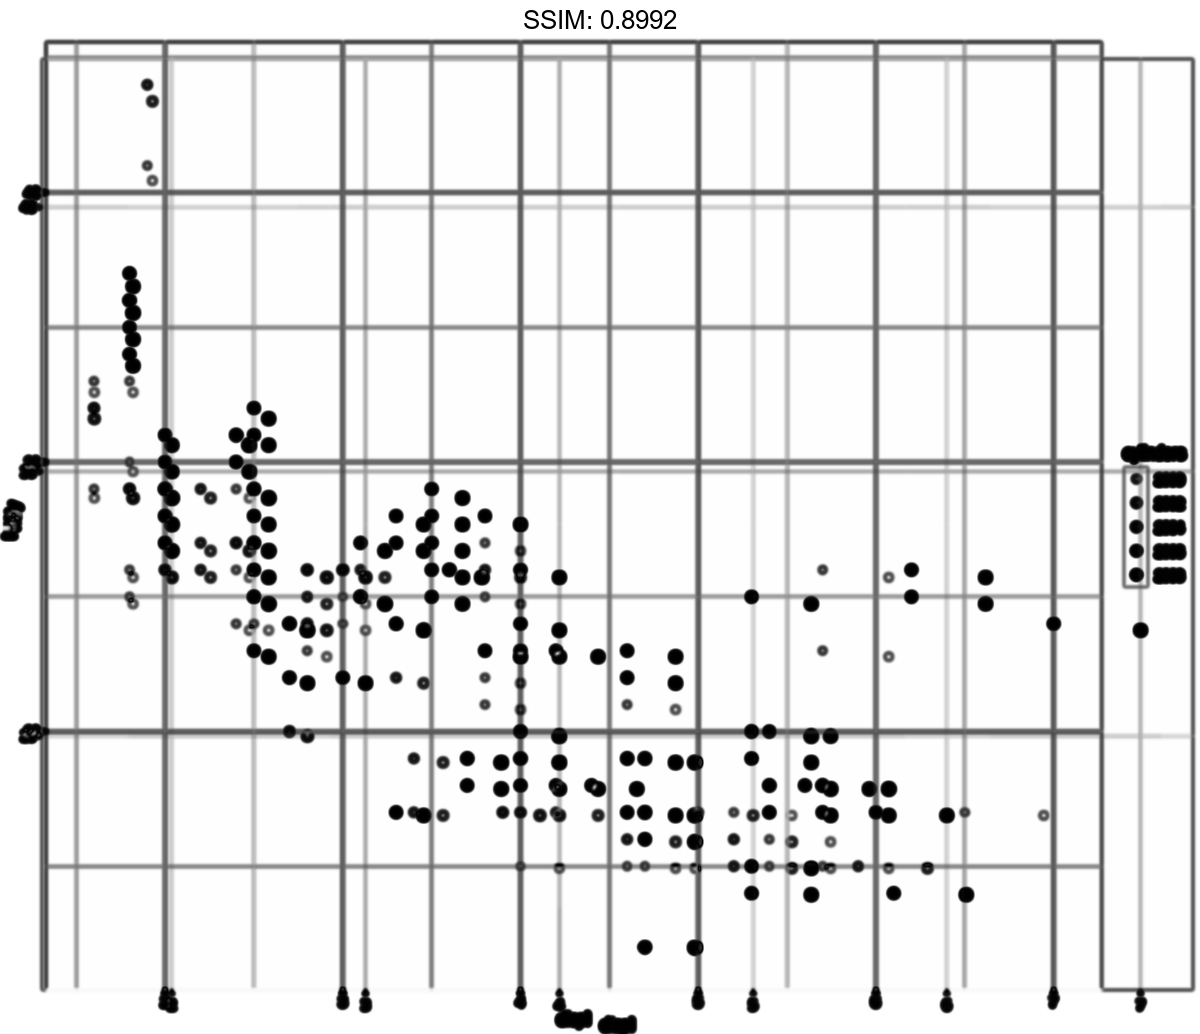
p <- ggplot(mpg, aes(displ, hwy)) +
  geom_point(aes(alpha = year))
p <-  p + scale_alpha(range = c(0.4, 0.8))
plotly::ggplotly(p)

